Journal List > Acute Crit Care > v.34(4) > 1154236

Park, Ryu, Lee, and Lee: The association between the initial lactate level and need for massive transfusion in severe trauma patients with and without traumatic brain injury

Abstract

Background

Exsanguination is a major cause of death in severe trauma patients. The purpose of this study was to analyze the prognostic impact of the initial lactate level for massive transfusion (MT) in severe trauma. We divided patients according to subgroups of traumatic brain injury (TBI) and non-TBI.

Methods

This single-institution retrospective study was conducted on patients who were admitted to hospital for severe trauma between January 2016 and December 2017. TBI was defined by a head Abbreviated Injury Scale ≥3. Receiver operating characteristic analysis was used to analyze the prognostic impact of the lactate level. Multivariate analyses were performed to evaluate the relationship between the MT and lactate level. The primary outcome was MT.

Results

Of the 553 patients, MT was performed in 62 patients (11.2%). The area under the curve (AUC) for the lactate level for predicting MT was 0.779 (95% confidence interval [CI], 0.742 to 0.813). The AUCs for lactate level in the TBI and non-TBI patients were 0.690 (95% CI, 0.627 to 0.747) and 0.842 (95% CI, 0.796 to 0.881), respectively. In multivariate analyses, the lactate level was independently associated with the MT (odds ratio [OR], 1.179; 95% CI, 1.070 to 1.299). The lactate level was independently associated with MT in non-TBI patients (OR, 1.469; 95% CI, 1.262 to 1.710), but not in TBI patients.

Conclusions

The initial lactate level may be a possible prognostic factor for MT in severe trauma. In TBI patients, however, the initial lactate level was not suitable for predicting MT.

INTRODUCTION

Approximately 50% of trauma patients who present to the emergency department (ED) die within 24 hours of admission [1,2]. Exsanguination is one of the major causes of death after trauma. Exsanguination most commonly occurs after central nervous system injury, which accounts for approximately 30% to 40% of all trauma-related deaths [3]. It is critical to identify patients who may experience sudden massive bleeding, and provide intensive care to them in order to improve their prognosis. This intensive care may include massive transfusion (MT). Many prior studies have shown that early and proper MT can improve the prognosis of trauma patients [4-6].
Measurement of the initial lactate level may help in predicting the prognosis of critical illnesses, such as sepsis [7,8] or cardiovascular disease [9]. Prior studies have suggested that the initial lactate level is related to prognosis after trauma [10,11]. In previous studies, the initial lactate levels could predict mortality in trauma patients [10]. One prior study showed that the lactate level in trauma patients was associated with the need for blood transfusion [11]. However, few studies have evaluated the relationship between the initial lactate level and MT in severe trauma.
Therefore, the purpose of this study was to analyze the prognostic impact of the initial lactate level for MT in patients with severe trauma. The clinical course of trauma patients may differ depending on the area of injury. For instance, systemic reactions may differ between patients with head injury and those with hemorrhagic shock [12]. Therefore, we divided patients into traumatic brain injury (TBI) and non-TBI subgroups.

MATERIALS AND METHODS

Study Design and Population

We conducted a retrospective, observational study involving patients who were admitted to the Chonnam National University Hospital, Gwangju, South Korea, with severe trauma between January 2016 and December 2017. Severe trauma was defined by an Injury Severity Score (ISS) >15 [13]. The exclusion criteria were as follows: age <18 years; lack of a lactate level result from the ED visit; specific mechanisms of trauma including drowning, hanging, or burns; traumatic cardiac arrest before the ED visit; and missing data. The study design was approved by the Institutional Review Board of Chonnam National University Hospital (IRB No. CNUH-2018-066).

Study Protocol and Data Collection

The following variables were collected from each patient: age, sex, past medical history, mechanism of trauma (such as blunt or penetrating), systolic blood pressure (SBP, mm Hg), respiratory rate, pulse rate, and Glasgow Coma Scale (GCS) on arrival, laboratory data on admission (including the white blood cell count, hemoglobin, platelet count, aspartate transaminase, alanine aminotransferase, activated partial thromboplastin time [aPTT], international normalized ratio of prothrombin time [PT-INR], and lactate level), the amount of transfused packed red blood cells (PRCs) within the first 24 hours of trauma, the need for emergent surgery and emergency interventions, length of stay in the hospital and intensive care unit, in-hospital mortality, and 30-day mortality. The Abbreviated Injury Scale (AIS) score and ISS were measured from the ED visit. The revised trauma score (RTS) was measured using the GCS and vital signs. The head AIS scores ≥3 were defined as the TBI [14]. The primary outcome was the MT, considered as a transfusion of ≥10 units of PRC within the first 24 hours of arrival.

Statistical Analysis

We described the continuous variables as median values with interquartile ranges, and categorical variables as frequencies and percentages. We analyzed the continuous variables using the Mann-Whitney U-test, as all of the continuous variables showed a non-normal distribution. We analyzed the categorical variables using Fisher’s exact tests. Receiver operating characteristic (ROC) analysis was conducted to evaluate the prognostic performance of the RTS, ISS, hemoglobin, SBP, and lactate levels for MT. The method proposed by DeLong et al. [15] was used to compare each dependent ROC curve. In order to examine the relationship between the MT and lactate levels, multivariate logistic regression analyses with backward elimination were performed. Next, subgroup analysis was performed on the TBI and non-TBI groups. The results of each model were described as odds ratio (OR) and 95% confidence interval (CI). A two-tailed significance level of 0.05 was considered statistically significant.

RESULTS

Patient Selection and Baseline Characteristics

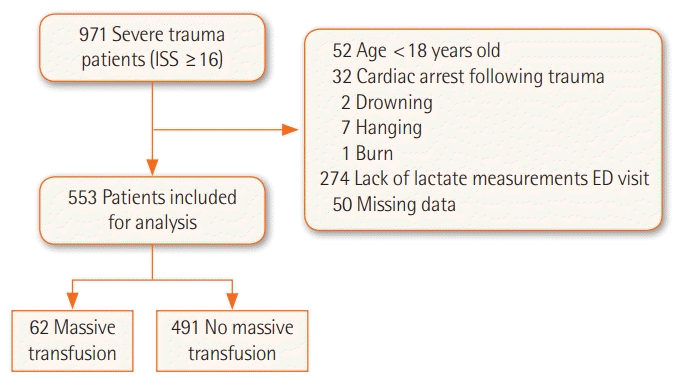
We identified 971 patients with severe trauma during the study period. After applying the exclusion criteria, 553 patients were selected (Figure 1). The patients’ baseline and clinical characteristics are shown in Table 1. The median age was 59 years (interquartile range [IQR], 45 to 72 years). There were 411 male patients (74.3%). There were 244 and 309 patients in the TBI and non-TBI subgroups, respectively. MT was performed in 62 patients (11.2%), of which 25 (10.2%) and 37 (12.0%) were in the TBI and non-TBI groups, respectively. The in-hospital mortality was 14.8% (n=80). Penetrating injuries were more common in the MT group than they were in the no-MT group. Patients in the MT group had lower values of RTS, hemoglobin levels, and platelet counts, and higher values of ISS, aPTT, and PT-INR than did those in the no-MT group. The median lactate levels were higher in the MT group than they were in the no-MT group (5.5 [IQR, 3.8–9.0] vs. 2.7 [IQR, 1.6–4.3] mmol/L; P<0.001). Among the TBI patients, there were no statistically significant differences between the MT and no-MT groups with regard to the mechanism of trauma or in the platelet counts (Table 2).

Prognostic Performance of the Lactate Level for MT

The areas under the curve (AUCs) for ISS, RTS, hemoglobin, SBP, and lactate levels were 0.651 (95% CI, 0.609 to 0.690), 0.717 (95% CI, 0.677 to 0.754), 0.726 (95% CI, 0.687 to 0.763), 0.768 (95% CI, 0.730 to 0.802), and 0.779 (95% CI, 0.742 to 0.813), respectively (Table 3, Figure 2A). The AUC of the lactate level was significantly different from that of ISS (P=0.006). However, the AUC of the lactate level was not significantly different from that of RTS (P=0.054), SBP (P=0.726), or the hemoglobin level (P=0.154). In TBI and non-TBI patients, the AUCs of the lactate level were 0.690 (95% CI, 0.627 to 0.747) and 0.842 (95% CI, 0.796 to 0.881), respectively (Table 3). In the TBI patients, the AUC of the lactate level was significantly different from that of SBP (P=0.009) and was not different from that ISS (P=0.600), RTS (P=0.466), and the hemoglobin level (P=0.654) (Figure 2B). In the non-TBI patients, the AUC of the lactate level was significantly different from that of ISS (P=0.003), RTS (P=0.008), SBP (P=0.016) and the hemoglobin level (P=0.021) (Figure 2C). Table 4 displays the cutoff score, sensitivity, specificity, positive predictive value, and negative predictive value of the lactate levels in all patients (including TBI and non-TBI patients).

Relationship between Lactate Level and MT in Multivariate Analysis

Table 5 shows the association between the variables and MT. After adjusting for confounders, the mechanism of trauma (OR, 0.178; 95% CI, 0.041 to 0.768), SBP (OR, 0.979; 95% CI, 0.968 to 0.990), and hemoglobin (OR, 0.834; 95% CI, 0.740 to 0.940) were associated with MT. The lactate level was also independently associated with MT (OR, 1.179; 95% CI, 1.070 to 1.299). The lactate level was independently associated with MT (OR, 1.469; 95% CI, 1.262 to 1.710) in non-TBI patients, but not in TBI patients (OR, 1.002; 95% CI, 0.843 to 1.190) (Table 5).

DISCUSSION

In this study, the lactate level had fair discriminatory power in predicting MT. In non-TBI patients, the lactate level showed good prognostic performance for MT, and was a significant predictor of MT. In TBI patients, the lactate level showed poor prognostic performance for MT and was not associated with MT.
In trauma patients, hemorrhage leads to a decrease in the circulating volume and rapidly depletes the hemoglobin level. Therefore, oxygen supply to the tissue becomes inadequate and anaerobic metabolism increases. Anaerobic metabolism leads to lactate accumulation. Many prior studies have described a relationship between hemorrhage and lactate levels in trauma patients [11,16,17]. Johnson et al. [11] showed that the AUC of lactate for predicting hemorrhage >250 ml was 0.824 in trauma patients. In another study, the lactate level was a good predictor of the need for transfusion of ≥6 units of PRC [16]. In this study, lactate levels of 5.0–7.5 mmol/L and >7.5 mmol/L were associated with the need for ≥6 units of PRC [16]. In hemodynamically stable trauma patients, the lactate levels of patients who received MT were higher than were those of patients who did not receive MT (5.6 vs. 2.6 mmol/L); this finding was consistent with that of the present study [17]. Despite hemodynamic stability at the time of hospital admission, the ISS score of the MT group in this study was very high (29 points) [17]. Penetrating injuries in the MT group were more common than they were in the no-MT group. This finding was similar to that in the present study.
Many studies have reported that patients with TBI have hemostatic disturbances in the early phase of trauma. Several studies have demonstrated an association between disseminated intravascular coagulation and mortality in patients with TBI [18,19]. Another study found that the frequency of coagulopathy in blunt TBI was ~23% [20]. In this study, 10.2% of TBI patients had hemostatic disturbances that required MT. However, unlike in non-TBI patients, the lactate level in TBI patients was not independently associated with MT. Anaerobic metabolism occurs when there is insufficient oxygen supply to tissues (due to bleeding in cases of trauma). Therefore, the lactate levels increase due to glycolysis after ischemic/hypoxic injury. However, TBI patients have a complex mechanism by which lactate production increases due to hyperglycolysis after severe brain injury and glycolysis after ischemic/hypoxic metabolism [21]. Hyperglycolysis after severe brain injury is a phenomenon by which glutamate release increases (at the neuronal synapse) after severe brain injury. This glutamate release stimulates astrocyte glycolysis and blood glucose uptake [21]. Sala et al. [22] showed that the cerebral lactate level often increased in both ischemic and non-ischemic lesions after severe brain injury. However, elevated lactate levels were more prevalent in non-ischemic lesions [22]. There were fewer ischemic lesions in the no-MT group than there were in the MT group. The lactate levels of the TBI patients were higher than were those of the non-TBI patients.
This study has several limitations. First, it was a retrospective study that was performed at a single center. Therefore, its findings are no immediately generalizable to the overall population. Further multi-center studies with larger sample sizes and prospective designs are needed to substantiate our findings. A second limitation is that 274 patients (28.2%) with severe trauma were excluded because their lactate levels were not obtained within 1 hour of admission. This exclusion criterion may have contributed to a selection bias. However, this exclusion criterion was meant to avoid measurements that were delayed until after resuscitation or those that were repeated (due to hemolysis). Finally, we did not analyze the effects of hemostasis treatments (such as interventions, operations, and transfusions) on mortality. Further research is needed to address these effects. In conclusion, the initial lactate level may be a possible prognostic factor for predicting MT in severe trauma. In non-TBI patients, the initial lactate level showed good prognostic performance with regard to MT. In TBI patients, the initial lactate level was not able to predict the need for MT.

HIGHLIGHTS

■ The lactate level had fair prognostic performance in predicting massive transfusion (MT) in severe trauma patients.
■ The under the curve of lactate level for predicting MT in non-traumatic brain injury (non-TBI) patients was better than that in TBI patients.
■ The mechanism of lactate production in TBI and non-TBI may be different.

Notes

CONFLICT OF INTEREST

No potential conflict of interest relevant to this article was reported.

AUTHOR CONTRIBUTIONS

Conceptualization: DHL. Data curation: YHP, DHR. Formal analysis & Methodology: DHL. Project administration: DHR. Visualization: DHL. Writing - original draft: YHP, BKL. Writing - reviewing & editing: BKL, DHL.

REFERENCES

1. Lefering R, Paffrath T, Bouamra O, Coats TJ, Woodford M, Jenks T, et al. Epidemiology of in-hospital trauma deaths. Eur J Trauma Emerg Surg. 2012; 38:3–9.
crossref
2. Brown JB, Gestring ML, Forsythe RM, Stassen NA, Billiar TR, Peitzman AB, et al. Systolic blood pressure criteria in the National Trauma Triage Protocol for geriatric trauma: 110 is the new 90. J Trauma Acute Care Surg. 2015; 78:352–9.
3. Kauvar DS, Lefering R, Wade CE. Impact of hemorrhage on trauma outcome: an overview of epidemiology, clinical presentations, and therapeutic considerations. J Trauma. 2006; 60(6 Suppl):S3–11.
crossref
4. Johnson JJ, Garwe T, Albrecht RM, Adeseye A, Bishop D, Fails RB, et al. Initial inferior vena cava diameter on computed tomographic scan independently predicts mortality in severely injured trauma patients. J Trauma Acute Care Surg. 2013; 74:741–6.
crossref
5. Hagiwara A, Kushimoto S, Kato H, Sasaki J, Ogura H, Matsuoka T, et al. Can early aggressive administration of fresh frozen plasma improve outcomes in patients with severe blunt trauma?: a report by the Japanese Association for the Surgery of Trauma. Shock. 2016; 45:495–501.
6. Odell DD, Liao K. Superior vena cava and innominate vein reconstruction in thoracic malignancies: double-vein reconstruction. Semin Thorac Cardiovasc Surg. 2011; 23:326–9.
crossref
7. Jansen TC, van Bommel J, Schoonderbeek FJ, Sleeswijk Visser SJ, van der Klooster JM, Lima AP, et al. Early lactate-guided therapy in intensive care unit patients: a multicenter, openlabel, randomized controlled trial. Am J Respir Crit Care Med. 2010; 182:752–61.
8. Lyu X, Xu Q, Cai G, Yan J, Yan M. Efficacies of fluid resuscitation as guided by lactate clearance rate and central venous oxygen saturation in patients with septic shock. Zhonghua Yi Xue Za Zhi. 2015; 95:496–500.
9. Liang D, Zhou X, Hong X, Feng X, Shan P, Xie Q, et al. Association between admission lactate levels and mortality in patients with acute coronary syndrome: a retrospective cohort study. Coron Artery Dis. 2019; 30:26–32.
10. Dekker SE, de Vries HM, Lubbers WD, van de Ven PM, Toor EJ, Bloemers FW, et al. Lactate clearance metrics are not superior to initial lactate in predicting mortality in trauma. Eur J Trauma Emerg Surg. 2017; 43:841–51.
crossref
11. Johnson MC, Alarhayem A, Convertino V, Carter R 3rd, Chung K, Stewart R, et al. Comparison of compensatory reserve and arterial lactate as markers of shock and resuscitation. J Trauma Acute Care Surg. 2017; 83:603–8.
crossref
12. Namas R, Ghuma A, Hermus L, Zamora R, Okonkwo DO, Billiar TR, et al. The acute inflammatory response in trauma/hemorrhage and traumatic brain injury: current state and emerging prospects. Libyan J Med. 2009; 4:97–103.
13. Baker SP, O’Neill B, Haddon W Jr, Long WB. The injury severity score: a method for describing patients with multiple injuries and evaluating emergency care. J Trauma. 1974; 14:187–96.
14. Mellick D, Gerhart KA, Whiteneck GG. Understanding outcomes based on the post-acute hospitalization pathways followed by persons with traumatic brain injury. Brain Inj. 2003; 17:55–71.
crossref
15. DeLong ER, DeLong DM, Clarke-Pearson DL. Comparing the areas under two or more correlated receiver operating characteristic curves: a nonparametric approach. Biometrics. 1988; 44:837–45.
crossref
16. Vandromme MJ, Griffin RL, Weinberg JA, Rue LW 3rd, Kerby JD. Lactate is a better predictor than systolic blood pressure for determining blood requirement and mortality: could prehospital measures improve trauma triage? J Am Coll Surg. 2010; 210:861–9.
crossref
17. Brooke M, Yeung L, Miraflor E, Garcia A, Victorino GP. Lactate predicts massive transfusion in hemodynamically normal patients. J Surg Res. 2016; 204:139–44.
crossref
18. Dekker SE, Duvekot A, de Vries HM, Geeraedts LM Jr, Peerdeman SM, de Waard MC, et al. Relationship between tissue perfusion and coagulopathy in traumatic brain injury. J Surg Res. 2016; 205:147–54.
crossref
19. Tian HL, Chen H, Wu BS, Cao HL, Xu T, Hu J, et al. D-dimer as a predictor of progressive hemorrhagic injury in patients with traumatic brain injury: analysis of 194 cases. Neurosurg Rev. 2010; 33:359–66.
crossref
20. Spinella PC, Holcomb JB. Resuscitation and transfusion principles for traumatic hemorrhagic shock. Blood Rev. 2009; 23:231–40.
crossref
21. Patet C, Suys T, Carteron L, Oddo M. Cerebral lactate metabolism after traumatic brain injury. Curr Neurol Neurosci Rep. 2016; 16:31.
crossref
22. Sala N, Suys T, Zerlauth JB, Bouzat P, Messerer M, Bloch J, et al. Cerebral extracellular lactate increase is predominantly nonischemic in patients with severe traumatic brain injury. J Cereb Blood Flow Metab. 2013; 33:1815–22.
crossref

Figure 1.
Schematic diagram showing the number of patients with severe trauma included in this study. ISS: Injury Severity Score; ED: emergency department.
acc-2019-00640f1.tif
Figure 2.
The areas under the curve (AUCs) for predicting massive transfusion between hemoglobin, Injury Severity Score (ISS), Revised Trauma Score (RTS), systolic blood pressure (SBP), and lactate levels. (A) AUC in all patients. The AUC of the lactate level was significantly different from that of ISS (P=0.006), but not significantly different from that of the RTS (P=0.054), SBP (P=0.726), and hemoglobin level (P=0.154). (B) AUC in traumatic brain injury (TBI) patients. (C) AUC in non-TBI patients. In non-TBI patients, the AUC of the lactate level was significantly different from that of ISS (P=0.003), RTS (P=0.008), SBP (P=0.016) and, hemoglobin level (P=0.021).
acc-2019-00640f2.tif
Table 1.
Baseline characteristics according to massive transfusion
Variable All patients (N=553) No MT (n=491) MT (n=62) P-value
Age (yr) 59 (45–72) 59 (46–73) 57 (37–72) 0.269
Male sex 411 (74.3) 364 (74.1) 47 (75.8) 0.776
Medical history
 Hypertension 163 (29.5) 150 (30.5) 13 (21.) 0.119
 Diabetes 94 (17.0) 88 (17.9) 6 (9.7) 0.103
 Renal impairment 5 (0.9) 4 (0.8) 1 (1.6) 0.532
Mechanism of trauma 0.008
 Blunt 542 (98.0) 484 (98.6) 58 (93.5)
 Penetrating 11 (2.0) 7 (1.4) 4 (6.5)
Injury Severity Score (AIS) 22 (17–27) 22 (17–25) 26 (20–34) <0.001
 Head/neck 2 (0–4) 2 (0–4) 0 (0–3) 0.124
 Face 0 (0–0) 0 (0–0) 0 (0–0) 0.079
 Chest 3 (0–3) 3 (0–3) 2 (0–3) 0.330
 Abdomen 0 (0–3) 0 (0–3) 3 (0–4) <0.001
 Extremity/pelvic 2 (0–3) 2 (0–2) 2 (0–3) 0.019
 External 0 (0–1) 0 (0–1) 0 (0–1) 0.369
Revised Trauma Score 7.84 (6.13–7.84) 7.84 (6.38–7.84) 6.38 (4.34–7.11) <0.001
Glasgow Coma Scale 15 (9–15) 15 (9–15) 14 (5–15) 0.005
SBP (mm Hg) 110 (80–130) 110 (90–130) 75 (60–100) <0.001
Respiratory rate (/min) 20 (20–22) 20 (20–22) 21 (20–24) 0.058
Pulse rate (/min) 88 (80–102) 88 (80–100) 99 (78–120) 0.031
Laboratory test
 White blood cell count (×109/L) 15.1 (10.4–19.1) 15.1 (10.5–19.0) 14.8 (10.1–20.5) 0.631
 Hemoglobin (g/dl) 11.5 (9.8–13.3) 11.8 (10.0–13.5) 9.8 (7.9–11.2) <0.001
 Platelet count (×109/L) 192 (150–233) 194 (154–237) 156 (124–216) 0.002
 AST (U/L) 66 (37–152) 66 (37–143) 84 (37–287) 0.203
 ALT (U/L) 39 (23–91) 39 (23–86) 42 (23–171) 0.559
 aPTT (sec) 31.4 (27.4–37.6) 30.7 (27.0–35.8) 38.9 (31.6–66.8) <0.001
 PT-INR 1.16 (1.07–1.33) 1.14 (1.06–1.28) 1.32 (1.17–1.80) <0.001
 Lactate (mmol/L) 2.9 (1.7–4.9) 2.7 (1.6–4.3) 5.5 (3.8–9.0) <0.001
 Base deficit 3.7 (0.8–7.4) 3.2 (0.5–6.4) 8.5 (4.8–14.0) <0.001
PRC (unit) 2 (0–5) 2 (0–4) 13 (11–16) <0.001
FFP (unit) 2 (0–4) 0 (0–3) 9 (6–14) <0.001
PC (unit) 0 (0–8) 0 (0–0) 10 (8–17) <0.001
Emergency operation 148 (26.8) 111 (22.6) 37 (59.7) <0.001
Emergency intervention 84 (15.2) 73 (14.9) 11 (17.7) 0.776
Hospital length of stay (day) 18 (10–34) 18 (10–32) 21 (2–52) 0.884
ICU length of stay (day) 4 (2–10) 4 (2–9) 7 (2–16) 0.026
In-hospital mortality 80 (14.8) 54 (11.0) 26 (41.9) <0.001
30-Day mortality 91 (16.5) 64 (13.0) 27 (43.5) <0.001

Values are presented as median (interquartile range) or number (%).

MT: massive transfusion; AIS: Abbreviated Injury Scale; SBP: systolic blood pressure; AST: aspartate transaminase; ALT: alanine aminotransferase; aPTT: activated partial thromboplastin time; PT-INR: international normalized ratio of prothrombin time; PRC: packed red blood cells; FFP: fresh frozen plasma; PC: platelet concentrates; ICU: intensive care unit.

Table 2.
Comparing baseline characteristics according to MT in TBI and non-TBI patients
Variable TBI patient (n=244)
Non-TBI patient (n=309)
No MT (n=219) MT (n=25) P-value No MT (n=272) MT (n=37) P-value
Age (yr) 64 (49–74) 52 (37–72) 0.122 57 (42–70) 57 (36–72) 0.994
Male sex 159 (72.6) 19 (76.0) 0.717 205 (75.4) 28 (75.7) 0.967
Medical history
 Hypertension 73 (33.3) 5 (20.0) 0.176 77 (28.3) 8 (21.6) 0.393
 Diabetes 44 (20.1) 3 (12.0) 0.331 44 (16.2) 3 (8.1) 0.200
 Renal impairment 2 (0.9) 0 0.631 2 (0.7) 1 (2.7) 0.252
Mechanism of trauma 0.063 0.045
 Blunt 218 (99.5) 24 (96.0) 266 (97.8) 34 (91.9)
 Penetrating 1 (0.5) 1 (4.0) 6 (2.2) 3 (8.1)
Injury Severity Score 25 (19–29) 27 (22–35) 0.014 20 (17–24) 25 (18–34) <0.001
Revised Trauma Score 6.90 (5.03–7.84) 5.44 (2.63–6.38) <0.001 7.84 (7.11–7.84) 6.38 (5.97–7.48) <0.001
Glasgow Coma Scale 10 (5–15) 6 (3–13) 0.030 15 (15–15) 15 (12–15) 0.002
SBP (mm Hg) 120 (100–140) 70 (60–95) <0.001 100 (80–120) 80 (55–105) <0.001
Respiratory rate (/min) 20 (20–22) 22 (20–24) 0.079 20 (20–22) 20 (20–24) 0.312
Pulse rate (/min) 90 (80–100) 100 (79–115) 0.168 88 (80–100) 94 (76–121) 0.093
Laboratory test
 WBC (×109/L) 14.9 (10.6–18.0) 14.3 (9.8–19.6) 0.804 15.3 (10.2–20.1) 15.8 (11.0–20.9) 0.499
 Hemoglobin (g/dl) 12.2 (10.3–13.7) 10.1 (7.9–11.3) <0.001 11.4 (9.8–13.2) 9.5 (7.7–11.2) <0.001
 Platelet count (×109/L) 194 (154–233) 148 (111–223) 0.057 197 (155–238) 156 (129–210) 0.014
 AST (U/L) 57 (34–107) 51 (33–277) 0.581 73 (40–208) 108 (42–329) 0.318
 ALT (U/L) 35 (19–62) 35 (17–164) 0.936 44 (25–125) 47 (24–177) 0.635
 aPTT (sec) 30.7 (26.9–37.2) 49.6 (30.4–76.9) <0.001 30.9 (27.0–35.6) 38.4 (31.6–44.9) <0.001
 PT-INR 1.15 (1.06–1.30) 1.53 (1.10–1.83) <0.001 1.14 (1.06–1.28) 1.29 (1.18–1.53) <0.001
 Lactate (mmol/L) 3.3 (2.2–5.4) 5.3 (3.4–9.1) 0.002 2.3 (1.4–3.4) 5.6 (3.9–8.8) <0.001
 Base deficit 3.1 (0.5–6.8) 7.4 (3.2–14.2) <0.001 3.3 (0.5–6.3) 9.4 (5.3–14.1) <0.001
PRC (unit) 2 (0–4) 13 (11–16) <0.001 2 (0–4) 13 (11–16) <0.001
FFP (unit) 0 (0–2) 8 (5–12) <0.001 0 (0–4) 11 (7–14) <0.001
PC (unit) 0 (0–0) 10 (8–14) <0.001 0 (0–0) 10 (3–17) <0.001
Emergency operation 46 (21.0) 13 (52.0) <0.001 65 (23.9) 24 (64.9) <0.001
Emergency intervention 14 (6.4) 5 (20.0) 0.016 59 (21.7) 6 (16.2) 0.443
Hospital length of stay (day) 16 (8–32) 19 (3–52) 0.567 19 (12–32) 25 (2–57) 0.725
ICU length of stay (day) 7 (3–14) 8 (2–28) 0.436 3 (1–6) 7 (2–13) 0.009
In-hospital mortality 42 (19.2) 11 (44.0) 0.004 12 (4.4) 15 (40.5) <0.001
30-Day mortality 48 (21.9) 11 (44.0) 0.015 16 (5.9) 16 (43.2) <0.001

Values are presented as median (interquartile range) or number (%).

MT: massive transfusion; TBI: traumatic brain injury; SBP: systolic blood pressure; WBC: white blood cell count; AST: aspartate transaminase; ALT: alanine aminotransferase; aPTT: activated partial thromboplastin time; PT-INR: international normalized ratio of prothrombin time; PRC: packed red blood cells; FFP: fresh frozen plasma; PC: platelet concentrates; ICU: intensive care unit.

Table 3.
AUC values for predicting massive transfusion in patients with severe trauma
Variable AUC (95% CI)
Total patient TBI patient Non-TBI patient
Injury Severity Score 0.651 (0.609–0.690) 0.649 (0.586–0.709) 0.666 (0.610–0.718)
Revised Trauma Score 0.717 (0.677–0.754) 0.731 (0.670–0.785) 0.745 (0.693–0.793)
Hemoglobin 0.726 (0.687–0.763) 0.717 (0.656–0.773) 0.728 (0.675–0.777)
Systolic blood pressure 0.768 (0.730–0.802) 0.809 (0.754–0.857) 0.728 (0.675–0.777)
Lactate level 0.779 (0.742–0.813) 0.690 (0.627–0.747) 0.842 (0.796–0.881)

AUC: area under the curve; CI: confidence interval; TBI: traumatic brain injury.

Table 4.
Prognostic performance of lactate levels for predicting massive transfusions in patients with severe trauma
Variable Cutoff Sensitivity (95% CI) Specificity (95% CI) PPV (95% CI) NPV (95% CI)
Lactate level (mmol/L)
 Total patients >3.7 75.8 (63.3–85.8) 68.4 (64.1–72.5) 23.3 (20.0–26.9) 95.7 (93.5–97.2)
 TBI patient >5.0 60.0 (38.7–78.9) 74.9 (68.6–80.5) 21.4 (15.5–28.8) 94.3 (91.0–96.4)
 Non-TBI patient >3.6 81.1 (64.8–92.0) 77.2 (71.8–82.1) 32.6 (27.0–38.8) 96.8 (93.9–98.3)

CI: confidence interval; PPV: positive predictive value; NPV: negative predictive value; TBI: traumatic brain injury.

Table 5.
Logistic regression analysis for predicting massive transfusion
Variable All patients
TBI patient
Non-TBI patient
OR (95% CI) P-value OR (95% CI) P-value OR (95% CI) P-value
Mechanism 0.178 (0.041–0.768) 0.021 0.195 (0.011–3.442) 0.265 0.139 (0.023–0.854) 0.033
Injury Severity Score 1.026 (0.990–1.063) 0.155 1.010 (0.966–1.056) 0.657 1.110 (1.040–1.185) 0.002
Revised Trauma Score 1.077 (0.875–1.325) 0.486 1.106 (0.790–1.547) 0.557 1.003 (0.674–1.492) 0.987
Systolic blood pressure (mm Hg) 0.979 (0.968–0.990) <0.001 0.966 (0.953–0.980) <0.001 0.991 (0.973–1.009) 0.308
Pulse rate (/min) 0.998 (0.984–1.012) 0.760 - - 0.995 (0.975–1.016) 0.652
Hemoglobin (g/dl) 0.834 (0.740–0.940) 0.003 0.930 (0.808–1.069) 0.308 0.704 (0.582–0.851) <0.001
Platelet count (×109/L) 1.000 (0.995–1.004) 0.888 1.001 (0.993–1.009) 0.840 0.997 (0.989–1.004) 0.388
aPTT (sec) 1.005 (0.990–1.019) 0.524 1.005 (0.994–1.016) 0.401 0.987 (0.954–1.021) 0.437
PT-INR 0.713 (0.462–1.101) 0.127 0.773 (0.452–1.322) 0.347 0.226 (0.076–0.671) 0.007
Lactate (mmol/L) 1.179 (1.070–1.299) <0.001 1.002 (0.843–1.190) 0.985 1.469 (1.262–1.710) <0.001

TBI: traumatic brain injury; OR: odds ratio; CI: confidence interval; aPTT: activated partial thromboplastin time; PT-INR: international normalized ratio of prothrombin time.

TOOLS
Similar articles