INTRODUCTION
MATERIALS AND METHODS
Study Population and Cosyntropin Stimulation Test
Data Collection and Processing
Statistical Analysis
RESULTS
Patient Baseline and Clinical Characteristics
Table 1.
| Variable | Total patients (n=94) | Hospital survivor (n=64) | Hospital non-survivor (n=30) | P-value |
|---|---|---|---|---|
| Female sex | 31 (33.0) | 24 (37.5) | 7 (23.3) | 0.173 |
| Age (yr) | 64.6±16.1 | 65.4±16.4 | 64.2±16.0 | 0.745 |
| BMI (kg/m2)a | 19.6±8.0 | 18.9±8.1 | 21.3±7.7 | 0.194 |
| Comorbidity | ||||
| Malignancy | 36 (38.3) | 22/64 (34.5) | 14 (46.7) | 0.253 |
| Chronic liver disease | 8 (8.5) | 4 (6.3) | 4 (13.3) | 0.251 |
| Diabetes | 19 (20.2) | 12 (18.8) | 7 (23.3) | 0.606 |
| Hypertension | 27 (28.7) | 11 (17.2) | 16 (53.3) | <0.001 |
| Serum albumin (g/dl) | 2.6±0.6 | 2.6±0.5 | 2.6±0.7 | 0.931 |
| Serum creatinine (mg/dl) | 1.7±1.5 | 1.5±1.5 | 2.0±1.6 | 0.142 |
| Admission APACHE II score | 24.8±8.3 | 24.4±8.4 | 25.8±8.1 | 0.446 |
| Septic shock | 50 (53.2) | 32 (50.0) | 18 (60.0) | 0.365 |
| Bacteremia | 18 (19.2) | 12 (18.8) | 6 (20.0) | 0.886 |
| ICU-acquired infectionb | 19 (20.2) | 4/28 (14.3) | 15/66 (22.7) | 0.351 |
| Previous steroid use | 30 (31.9) | 20 (31.3) | 10 (33.3) | 0.840 |
| Previous etomidate use | 24 (25.5) | 16 (25.0) | 8 (26.7) | 0.863 |
| MV | 87 (92.6) | 58 (90.6) | 29 (96.7) | 0.298 |
| CRRT | 29 (30.9) | 15 (23.4) | 14 (46.7) | 0.023 |
| Type of ICU | 0.741 | |||
| MICU | 41 (43.6) | 28 (68.3) | 13 (31.7) | |
| SICU | 11 (11.7) | 8 (72.7) | 3 (27.2) | |
| CPICU | 1 (1.1) | 0 | 1 (100) | |
| EICU | 41 (43.6) | 28 (68.3) | 13 (31.7) |
Values are presented as number (%) or mean±standard deviation.
BMI: body mass index; APACHE: Acute Physiology and Chronic Health Evaluation; ICU: intensive care unit; MV: mechanical ventilation; CRRT: continuous renal replacement therapy; MICU: medical ICU; SICU: surgical ICU; CPICU: cardiopulmonary ICU; EICU: emergency ICU.
Table 2.
| Variable | Total patients (n=94) | Hospital survivor (n=64) | Hospital non-survivor (n =30) | P-value |
|---|---|---|---|---|
| Day from admission to the 1st test | 18.0±24.9 | 16.1±21.8 | 21.9±30.6 | 0.296 |
| ACTH baseline (pmol/L) | 27.2±94.6 | 19.5±44.9 | 43.4±154.6 | 0.256 |
| Cortisol baseline (nmol/dl) | 565.8±561.2 | 530.9±580.0 | 640.3±520.3 | 0.381 |
| Cortisol after 30 minutes (nmol/dl) | 802.6±617.5 | 794.5±649.3 | 820.0±553.5 | 0.853 |
| Cortisol after 60 minutes (nmol/dl) | 841.5±561.0 | 822.2±568.8 | 882.7±551.0 | 0.629 |
| ΔMax (cortisol) (nmol/dl) | 309.9±422.6 | 336.8±482.7 | 252.7±248.0 | 0.371 |
| Cortisol baseline/serum albumin (nmol/mg) | 2.2±2.3 | 2.1±2.6 | 2.6±2.5 | 0.269 |
| Cortisol after 30 minutes/serum albumin (nmol/mg) | 3.1±2.5 | 3.1±2.5 | 3.3±2.6 | 0.619 |
| Cortisol after 60 minutes/serum albumin (nmol/mg) | 3.3±2.4 | 3.2±2.2 | 3.6±2.6 | 0.438 |
| ΔMax (cortisol)/serum albumin (nmol/mg) | 1.2±1.6 | 1.3±1.8 | 1.0±1.1 | 0.414 |
| Day from admission to the 2nd test | 49.3±62.7 | 47.3±58.1 | 53.7±72.6 | 0.645 |
| ACTH baseline (pmol/L)a | 11.3±12.2 | 12.1±12.5 | 44.8±53.0 | 0.419 |
| Cortisol baseline (nmol/dl) | 399.6±205.1 | 344.6±184.1 | 517.0±200.9 | <0.001 |
| Cortisol after 30 minutes (nmol/dl) | 603.5±245.5 | 567.6±231.6 | 680.0±260.4 | 0.038 |
| Cortisol after 60 minutes (nmol/dl) | 694.4±421.7 | 679.3±474.9 | 726.5±280.8 | 0.616 |
| ΔMax (cortisol) (nmol/dl) | 300.6±417.6 | 338.2±474.0 | 220.3±247.7 | 0.204 |
| Cortisol baseline/serum albumin (nmol/mg) | 1.5±0.9 | 1.2±0.7 | 2.0±1.1 | <0.001 |
| Cortisol after 30 minutes/serum albumin (nmol/mg) | 2.2±1.0 | 2.0±0.9 | 2.6±1.3 | 0.013 |
| Cortisol after 60 minutes/serum albumin (nmol/mg) | 2.6±2.1 | 2.5±2.3 | 2.8±1.4 | 0.527 |
| ΔMax (cortisol)/serum albumin (nmol/mg) | 1.1±2.0 | 1.3±2.3 | 0.8±1.0 | 0.279 |
Effect of ACTH-Cortisol Dissociation on Clinical Outcomes
Table 3.
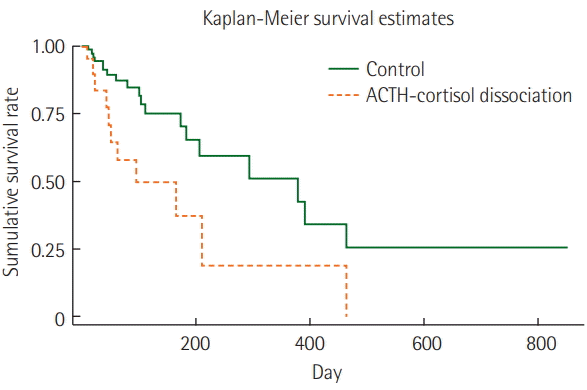
Figure 2.

Table 4.
Differences in Clinical Outcomes According to Changes in ACTH-Cortisol Dissociation in Cosyntropin Stimulation Tests
Table 5.
Values are presented as mean±standard deviation or number/total number (%).
ACTH: adrenocorticotropic hormone; Group 1: no dissociations in both tests; Group 2: ACTH-cortisol dissociation in both tests; Group 3: ACTH-cortisol dissociation in the first test; Group 4: ACTH-cortisol dissociation in the second test; ICU: intensive care unit; LOS: length of stay.


 PDF
PDF Citation
 Print
Print


 XML Download