INTRODUCTION
MATERIALS AND METHODS
Study Design and Subject Selection
Data Collection and Definition
Statistical Analysis
RESULTS
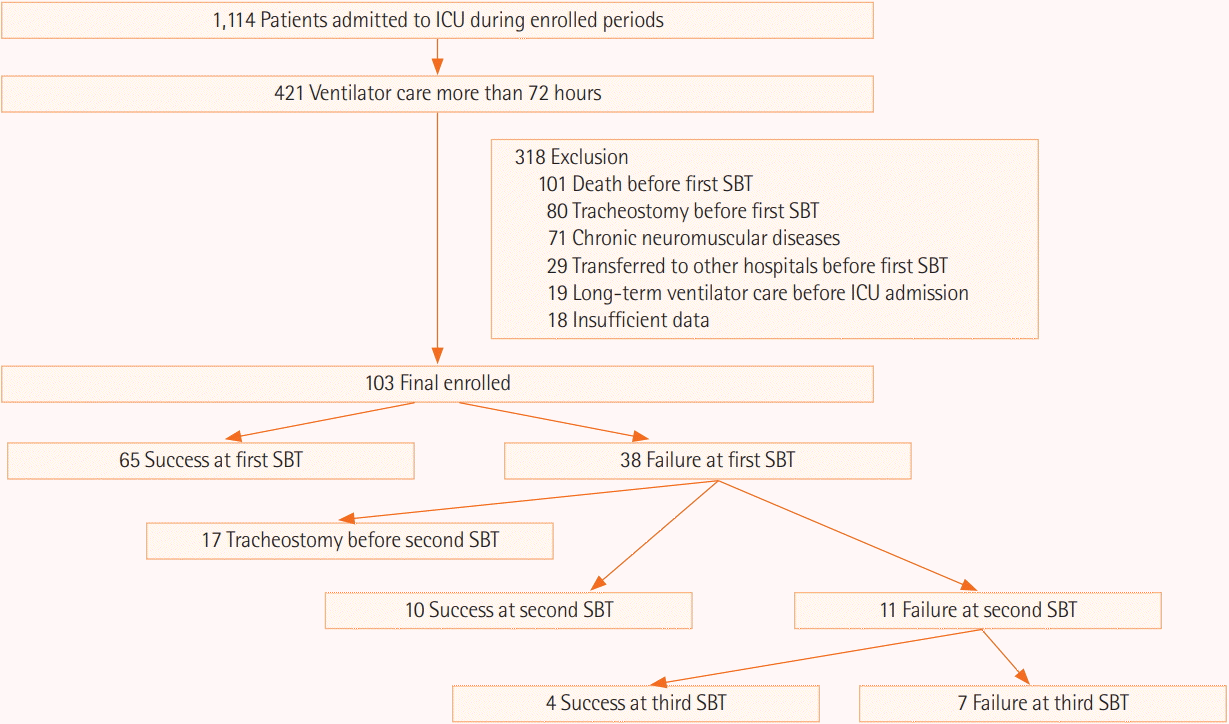
 | Figure 2.Flowchart of recruited and enrolled study participants and clinical outcomes of all enrolled patients. ICU: Intensive care unit; SBT: spontaneous breathing trial. |
Table 1.
| Variable | Total (n=103) |
Final liberation of MV |
P-value | |
|---|---|---|---|---|
| Successful (n=87) | Unsuccessful (n=16) | |||
| Age (yr) | 69 (22–87) | 69 (22–86) | 69 (45–87) | 0.912 |
| Male sex | 72 (69.9) | 60 (69.0) | 12 (75.0) | 0.771 |
| BMI (kg/m2) | 22.3 (13.8–37.6) | 23.0 (13.8–37.6) | 21.2 (16.5–24.6) | 0.004 |
| Charlson comorbidity index | 2 (0–7) | 2 (0–6) | 2 (0–7) | 0.069 |
| Severity of illness on day of ICU admission | ||||
| APACHE II score | 22 (10–37) | 22 (10–37) | 22 (11–36) | 0.927 |
| SOFA score | 8 (2–17) | 8 (3–17) | 7 (2–16) | 0.506 |
| Time between ICU admission and first SBT (day) | 5 (3–26) | 4 (3–21) | 5 (3–26) | 0.885 |
| Underlying disease | ||||
| Diabetes | 40 (38.8) | 37 (42.5) | 3 (18.8) | 0.096 |
| Hemato-oncologic disease | 27 (26.2) | 19 (21.8) | 8 (50.0) | 0.029 |
| Chronic heart diseasea | 25 (24.3) | 21 (24.1) | 4 (25.0) | >0.999 |
| Chronic lung diseaseb | 17 (16.5) | 16 (18.4) | 1 (6.3) | 0.462 |
| Neurologic diseasec | 16 (15.5) | 15 (17.2) | 1 (6.3) | 0.456 |
| Chronic kidney disease (including hemodialysis) | 10 (9.7) | 9 (10.3) | 1 (6.3) | >0.999 |
| Alimentary disease | 9 (8.7) | 8 (9.2) | 1 (6.3) | >0.999 |
| Chronic liver diseased | 7 (6.8) | 6 (6.9) | 1 (6.3) | >0.999 |
| Tracheostomy during ICU stay | 30 (29.1) | 20 (23.0) | 10 (62.5) | 0.003 |
| ICU mortality | 19 (18.4) | 9 (10.3) | 10 (62.5) | <0.001 |
| Hospital mortality | 29 (19.5) | 17 (19.5) | 12 (75.0) | <0.001 |
Values are presented as median (range) for continuous variables or number (%) for categorical variables. The Mann-Whitney U-test was used for comparison of continuous variables and the chi-square or Fisher exact test (for small numbers) were used to compare categorical variables.
MV: mechanical ventilation; BMI: body mass index; ICU: intensive care unit; APACHE: Acute Physiology and Chronic Health Evaluation; SOFA: Sequential Organ Failure Assessment; SBT: spontaneous breathing trial.
Table 2.
Values are presented as median (range) for continuous variables or number (%) for categorical variables. The Mann-Whitney U-test was used for comparisons of the continuous variables. The chi-square or Fisher exact test (for small numbers) were used to compare categorical variables.
MV: mechanical ventilation; SBT: spontaneous breathing trial; BMI: body mass index; APACHE: Acute Physiology and Chronic Health Evaluation; ICU: Intensive care unit; SOFA: Sequential Organ Failure Assessment; m-BWAP: modified Burns Wean Assessment Program; RSBI: rapid shallow breathing index; Pimax: maximal inspiratory pressure.
Table 3.
Values are presented as number (%). This table shows the comparison between patients with successful and unsuccessful liberation of ventilator care at the time of first SBT in total patients regardless of whether they had 5 points or not according to the definition of each category.
m-BWAP: modified Burns Wean Assessment Program; MV: mechanical ventilation; SBT: spontaneous breathing trial; PaO2: partial pressure of oxygen; PaCO2: partial pressure of carbon dioxide; Raw: airway resistance; Pimax: maximal inspiratory pressure; RSBI: rapid shallow breathing index.
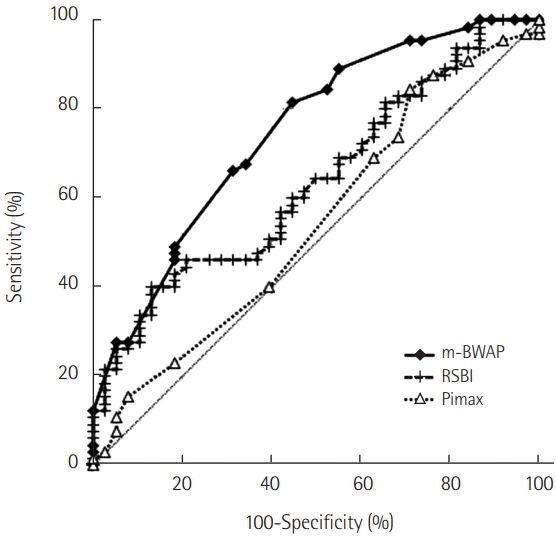
 | Figure 3.Receiver operating characteristic curves for modified Burns Wean Assessment Program (m-BWAP) score, rapid shallow breathing index (RSBI), and maximal inspiratory pressure (Pimax) at first spontaneous breathing trial for predicting successful liberation from mechanical ventilation were drawn. The areas under the curve (AUCs) for m-BWAP, RSBI, and Pimax were 0.748 (95% confidence interval [CI], 0.650 to 0.847; P<0.001), 0.637 (95% CI, 0.528 to 0.745; P=0.014), and 0.545 (95% CI, 0.429 to 0.661; P= 0.443), respectively. The AUC for m-BWAP was significantly higher than that for Pimax (P=0.005). |


 PDF
PDF Citation
 Print
Print


 XML Download