Abstract
Background and Purpose
Methods
Results
Supplementary materials
Supplementary Figure 1.
References
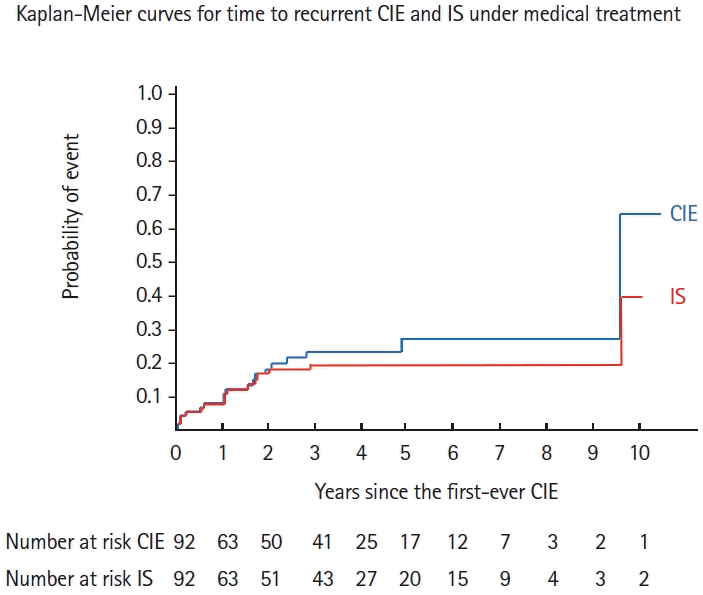
Figure 1.

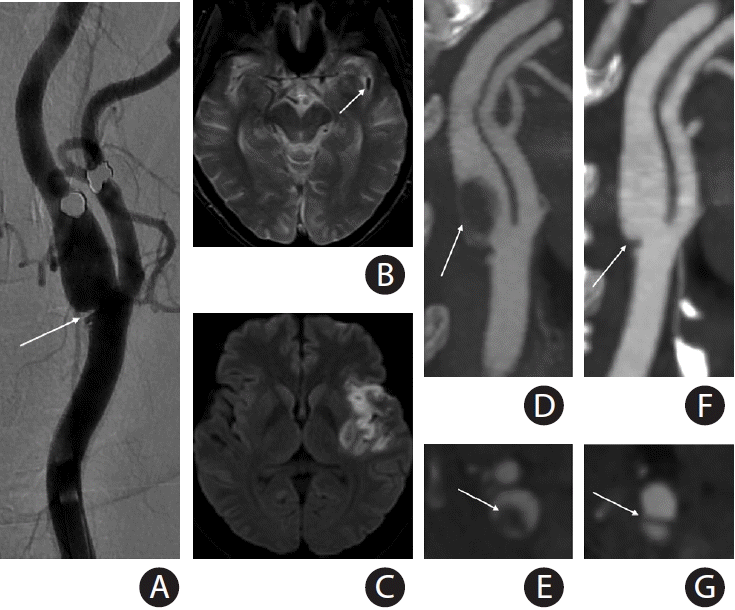
Figure 2.

Table 1.
| Characteristic | All patients (n=92) |
|---|---|
| Age at first-ever CIE (yr) | 49.3±9.7 (26–72) |
| Age at inclusion (yr) | 49.8±9.9 (27–73) |
| First-ever CIE to last visit (mo) | 53.2±33.6 (0.1–179) |
| Study enrollment to last visit (mo) | 50.5±29.6 (0.1–135) |
| Male sex | 40 (43.5) |
| Vascular risk factor | 40 (43.5) |
| Arterial hypertension | 19 (20.6) |
| Diabetes | 3 (3.3) |
| Hyperlipidemia | 9 (9.8) |
| Smoking | 19 (20.6) |
| Left symptomatic CaW | 48 (52.2) |
| Admission NIHSS | 7.7±7.4 (0–27) |
| Admission DWI-ASPECTS* | 7.2±2.5 (0–10) |
| Modified Rankin Scale score 0–2 at 3 months | 70 (76.1) |
| Modified Rankin Scale score 0–2 at final follow-up visit | 85 (92.4) |
| Index CIE | |
| TIA | 13 (14.1) |
| Acute ischemic stroke | 79 (85.9) |
| Superficial MCA infarction | 42 (45.7) |
| Deep MCA infarction | 10 (10.9) |
| Total MCA infarction | 22 (23.9) |
| Fetal disposition PCA infarction | 3 (3.3) |
| Retinal infarction | 2 (2.2) |
| Vessel occlusion | 51 (55.4) |
| Anterior cerebral artery | 2 (2.2) |
| M1 MCA | 30 (32.6) |
| M2 MCA | 13 (14.1) |
| M3 MCA | 2 (2.2) |
| Internal cerebral artery | 4 (4.3) |
| Silent cerebral infarcts ipsilateral to CIE | 7 (7.6) |
| ECST stenosis (%) | 36±14 (10–90) |
| ESCT stenosis >35% | 42 (45.6) |
| Presence of contralateral CaW | 42 (45.6) |
| Carotid surgery or stenting | 23 (25) |
Values are presented as mean±standard deviation (range) or number (%).
CIE, cerebral ischemic event; CaW, carotid web; NIHSS, National Institutes of Health Stroke Scale; DWI-ASPECTS, diffusion-weighted imaging Alberta Stroke Program Early CT score; TIA, transient ischemic attack; MCA, middle cerebral artery; PCA, posterior cerebral artery; ECST, European Carotid Surgery Trial.
Table 2.
| Characteristic | Medical treatment group (n=69) | Surgery/stenting treatment group (n=23) | P |
|---|---|---|---|
| Age at first-ever CIE (yr) | 50.4±9.5 (26–72) | 45.9±9.7 (28–71) | 0.020 |
| Age at inclusion (yr) | 51.1±9.9 (27–73) | 46.2±9.7 (29–72) | 0.020 |
| First-ever CIE to last visit (mo) | 53.1±34.6 (1–177) | 55.6±28.8 (12–125) | 0.560 |
| Study enrollment to last visit (mo) | 49.7±29.5 (1–136) | 54.3±30.1 (3–125) | 0.440 |
| Male sex | 29 (42.0) | 11 (47.8) | 0.800 |
| Vascular risk factor | 34 (49.3) | 6 (26.1) | 0.090 |
| Arterial hypertension | 17 (24.6) | 2 (8.7) | 0.180 |
| Diabetes | 3 (4.4) | 0 (0) | 0.730 |
| Hyperlipidemia | 8 (11.6) | 1 (4.4) | 0.500 |
| Smoking | 16 (23.2) | 3 (13.0) | 0.450 |
| TIA as index CIE | 12 (17.4) | 1 (4.4) | 0.170 |
| Admission NIHSS | 7.5±7.5 (0–27) | 8.1±7.2 (0–24) | 0.600 |
| Admission DWI-ASPECTS* | 7.4±2.5 (0–10) | 6.5±2.2 (1–10) | 0.060 |
| Vessel occlusion | 32 (46.4) | 19 (82.6) | 0.005 |
| Silent cerebral infarction on first imaging | 5 (7.3) | 2 (8.7) | 0.990 |
| mRS score 0–2 at 3 months | 52 (75.4) | 18 (78.3) | 0.990 |
| mRS score 0–2 at last follow-up visit | 63 (91.3) | 22 (95.7) | 0.820 |
| ECST stenosis (%) | 34±0.14 (10–90) | 43±13 (19–74) | 0.002 |
| Presence of contralateral CaW | 31 (44.9) | 11 (47.8) | 0.990 |
| Ipsilateral CIE recurrence | 12 (17.4) | 7 (30.4)† | 0.290 |
Values are presented as mean±standard deviation (range) or number (%).
CIE, cerebral ischemic event; TIA, transient ischemic attack; NIHSS, National Institutes of Health Stroke Scale; DWI-ASPECTS, diffusion-weighted imaging Alberta Stroke Program Early CT score; mRS, modified Rankin Scale; ECST, European Carotid Surgery Trial; CaW, carotid web.
Table 3.
| Characteristic | No recurrence (n=73) | Ipsilateral recurrence (n=19) | P |
|---|---|---|---|
| Age at first-ever CIE (yr) | 49.3±9.6 (26–72) | 49.1±10.6 (36–71) | 0.640 |
| Age at inclusion (yr) | 49.9±9.7 (27–73) | 49.7±11.1 (36–72) | 0.680 |
| First-ever CIE to last visit (mo) | 50.1±28.7 (0.1–127) | 66.4±46.6 (6–179) | 0.270 |
| Study enrollment to last visit (mo) | 49.9±28.4 (0.1–127) | 54.5±34 (6–135) | 0.750 |
| Male sex | 27 (37.0) | 13 (68.4) | 0.020 |
| Vascular risk factor | 32 (43.8) | 8 (42.1) | 0.990 |
| Arterial hypertension | 16 (21.9) | 3 (15.8) | 0.780 |
| Diabetes | 3 (4.1) | 0 (0) | 0.860 |
| Hyperlipidemia | 5 (6.8) | 4 (2.1) | 0.150 |
| Smoking | 14 (19.2) | 5 (2.6) | 0.710 |
| TIA as index CIE | 11 (15.1) | 2 (10.5) | 0.890 |
| Admission NIHSS | 8±7.7 (0–27) | 6.5±6.2 (0–19) | 0.570 |
| Admission DWI-ASPECTS* | 7.2±2.6 (0–10) | 7.4±1.7 (5–10) | 0.940 |
| Vessel occlusion | 38 (52.1) | 13 (68.4) | 0.300 |
| Silent cerebral infarction on first imaging | 2 (2.7) | 5 (26.3) | 0.003 |
| mRS score 0–2 at 3 months | 54 (74.0) | 16 (84.2) | 0.520 |
| mRS score 0–2 at last follow-up visit | 66 (90.4) | 19 (100) | 0.350 |
| ECST stenosis (%) | 36±14 (10–90) | 38±13 (15–63) | 0.370 |
| Presence of contralateral CaW | 34 (46.6) | 8 (42.1) | 0.920 |
| Carotid surgery or stenting | 16 (21.9) | 7 (36.8)† | 0.290 |
Values are presented as mean±standard deviation (range) or number (%).
CIE, cerebral ischemic event; TIA, transient ischemic attack; NIHSS, National Institutes of Health Stroke Scale; DWI-ASPECTS, diffusion-weighted imaging Alberta Stroke Program Early CT score; mRS, modified Rankin Scale; ECST, European Carotid Surgery Trial; CaW, Carotid web.
Table 4.
| Characteristic |
Unadjusted |
Adjusted |
||
|---|---|---|---|---|
| HR (95% CI) | P | HR (95% CI) | P | |
| Age at first-ever CIE (yr) | 0.99 (0.94–1.04) | 0.650 | - | - |
| Age at inclusion (yr) | 0.99 (0.95–1.04) | 0.720 | - | - |
| First-ever CIE to last visit (mo) | 1.00 (0.99–1.01) | 0.910 | - | - |
| Study enrollment to last visit (mo) | 0.99 (0.98–1.01) | 0.490 | - | - |
| Male sex | 2.75 (1.03–7.33) | 0.040 | 2.27 (0.83–6.16) | 0.110 |
| Vascular risk factor | 0.82 (0.34–2.09) | 0.710 | - | - |
| Arterial hypertension | 1.67 (0.48–5.81) | 0.410 | - | - |
| Diabetes | 1.60 (0.21–12.13) | 0.640 | - | - |
| Hyperlipidemia | 2.60 (0.84–7.98) | 0.090 | - | - |
| Smoking | 1.13 (0.40–3.16) | 0.820 | - | - |
| TIA as index CIE | 0.60 (0.14–2.63) | 0.500 | - | - |
| Admission NIHSS | 1.00 (0.93–1.06) | 0.950 | - | - |
| Admission DWI-ASPECTS* | 1.01 (0.83–1.22) | 0.930 | - | - |
| Vessel occlusion | 2.19 (0.82–5.85) | 0.120 | - | - |
| Silent cerebral infarction on first imaging | 8.44 (2.94–24.24) | <0.001 | 6.99 (2.40–20.40) | 0.004 |
| ECST stenosis (%) | 5.71 (0.37–86.90) | 0.210 | - | - |
| Presence of contralateral CaW | 0.64 (0.25–1.64) | 0.350 | - | - |


 PDF
PDF Citation
 Print
Print


 XML Download