Introduction
Methods
Patients
Table 1.
Image analysis
Statistical analysis
Results
Table 2.
| Characteristic | All patients (n=311) | IA tPA (n=194) | IA UK (n=117) | P |
|---|---|---|---|---|
| Age (yr) | 74 (62.7–81.0) | 75.0 (65.0–82.0) | 70.8 (58.6–78.4) | 0.019 |
| Female sex | 137 (44.1) | 91 (46.9) | 46 (39.3) | 0.197 |
| Pre-stroke independence* | 283 (91.3) | 0.219 | ||
| Risk factors | ||||
| Atrial fibrillation† | 144 (47.2) | 97 (50.0) | 47 (32.6) | 0.233 |
| Arterial hypertension | 230 (74.0) | 144 (74.2) | 86 (73.5) | 0.895 |
| Diabetes‡ | 73 (23.6) | 57 (29.4) | 16 (13.9) | 0.002§ |
| Coronary artery diseasell | 110 (36.4) | 85 (45.9) | 25 (21.4) | <0.001§ |
| Smoking | 92 (29.6) | 63 (32.5) | 29 (31.5) | 0.160 |
| Antiplatelets¶ | 0.088 | |||
| None | 220 (71.4) | 146 (75.6) | 74 (64.3) | |
| Aspirin | 79 (25.6) | 43 (22.3) | 36 (31.3) | |
| Aspirin+clopidogrel/prasugrel | 9 (2.9) | 4 (2.1) | 5 (4.3) | |
| Oral anticoagulation‡ | 0.049** | |||
| None | 259 (83.8) | 155 (80.3) | 104 (89.7) | |
| Vitamin K antagonists | 25 (8.1) | 17 (8.8) | 8 (6.9) | |
| Direct oral anticoagulants | 25 (8.1) | 21(10.9) | 4 (3.5) | |
| Witnessed symptom-onset | 258 (83.0) | 168 (86.6) | 90 (76.9) | |
| Symptom-onset/last-seen well to admission (min)†† | 80 (56–150) | 75 (50–137) | 83 (65–160) | 0.027** |
| Admission National Institute of Health Stroke Scale | 14 (9–19) | 15 (10–18) | 13 (8–19) | 0.374 |
| Admission Imaging | <0.001§ | |||
| CT | 186 (59.8) | 148 (76.3) | 38 (32.5) | |
| MRI | 125 (40.2) | 46 (23.7) | 79 (67.5) | |
| Alberta Stroke Program Early CT Score (ASPECTS)‡ | 9 (7–10) | 9 (8–10) | 7 (6–9) | <0.001§ |
| ASPECTS based on non-contrast CT | 9 (8–10) | 10 (9–10) | 8 (6–9) | <0.001§ |
| ASPECTS based on MRI (diffusion-weighted imaging) | 7 (6–9) | 8 (7–9) | 7 (5–8) | 0.098 |
| Occlusion site | 0.648 | |||
| Intracranial ICA | 64 (20.6) | 38 (19.6) | 26 (22.2) | |
| First segment of the middle cerebral artery | 170 (54.7) | 110 (56.7) | 60 (51.3) | |
| Second segment of the middle cerebral artery | 77 (24.8) | 46 (23.7) | 31 (26.5) | |
| Intravenous tissue plasminogen activator | 156 (50.2) | 107 (55.2) | 49 (41.9) | 0.026** |
| Indication for IA fibrinolytics | <0.001§ | |||
| Rescue thromoblysis in cerebral infarction 0-2b reperfusion | 250 (80.4) | 168 (86.6) | 82 (70.1) | |
| Treatment of emboli to new territory | 12 (3.9) | 4 (2.1) | 8 (6.8) | |
| Other/individual operator decision | 49 (15.8) | 22 (11.3) | 27 (23.1) | |
| Symptom-onset/last-seen well to IA fibrinolytics (min)‡‡ | 256 (206–320) | 240 (189–318) | 275 (230–324) | 0.012** |
| Groin puncture to IA fibrinolytics (min)‡ | 55 (38–88) | 48 (30–75) | 69 (48–102) | <0.001§ |
| Symptom-onset/last-seen well to reperfusion/symptom-onset/last-seen well to final angiography run (min)§§ | 268 (213–350) | 248 (200–315) | 206 (250–381) | <0.001§ |
| Final TICI score | 0.028** | |||
| 0 | 9 (2.9) | 2 (1.0) | 7 (6.0) | |
| 1 | 15 (4.8) | 7 (3.6) | 8 (6.8) | |
| 2a | 47 (15.1) | 26 (13.4) | 21 (17.9) | |
| 2b | 185 (59.5) | 125 (64.4) | 60 (51.3) | |
| 3 | 55 (17.7) | 34 (17.5) | 21 (17.9) |
Safety evaluation
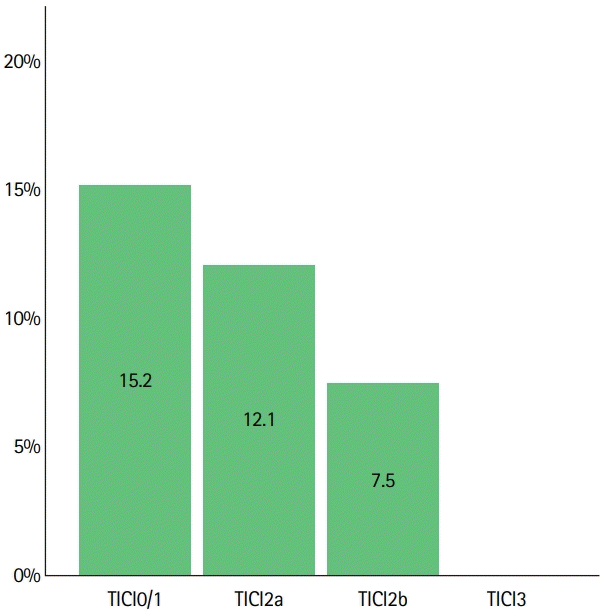
Figure 1.

Angiographic efficacy
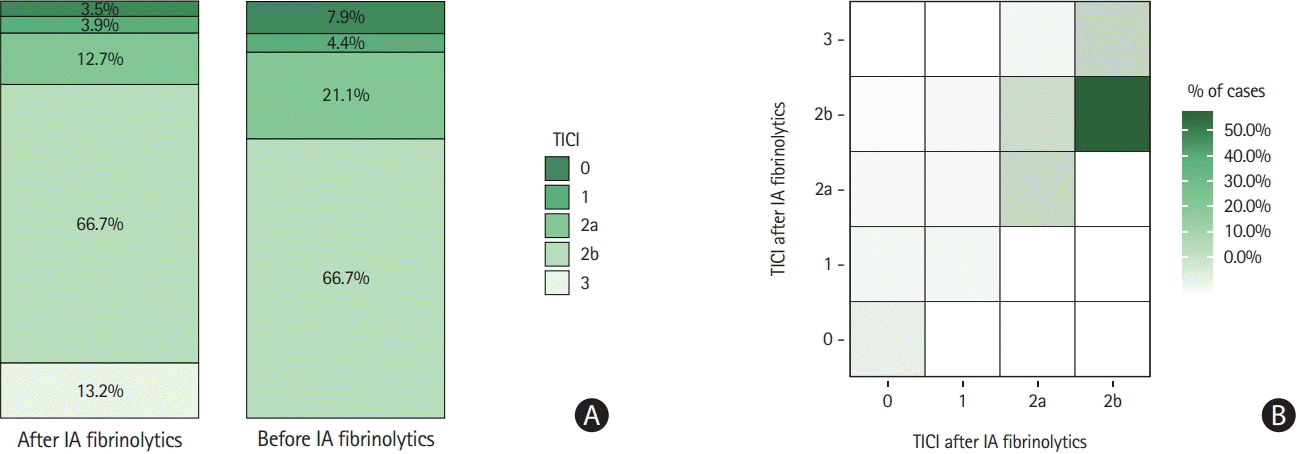
Figure 2.

Functional outcome
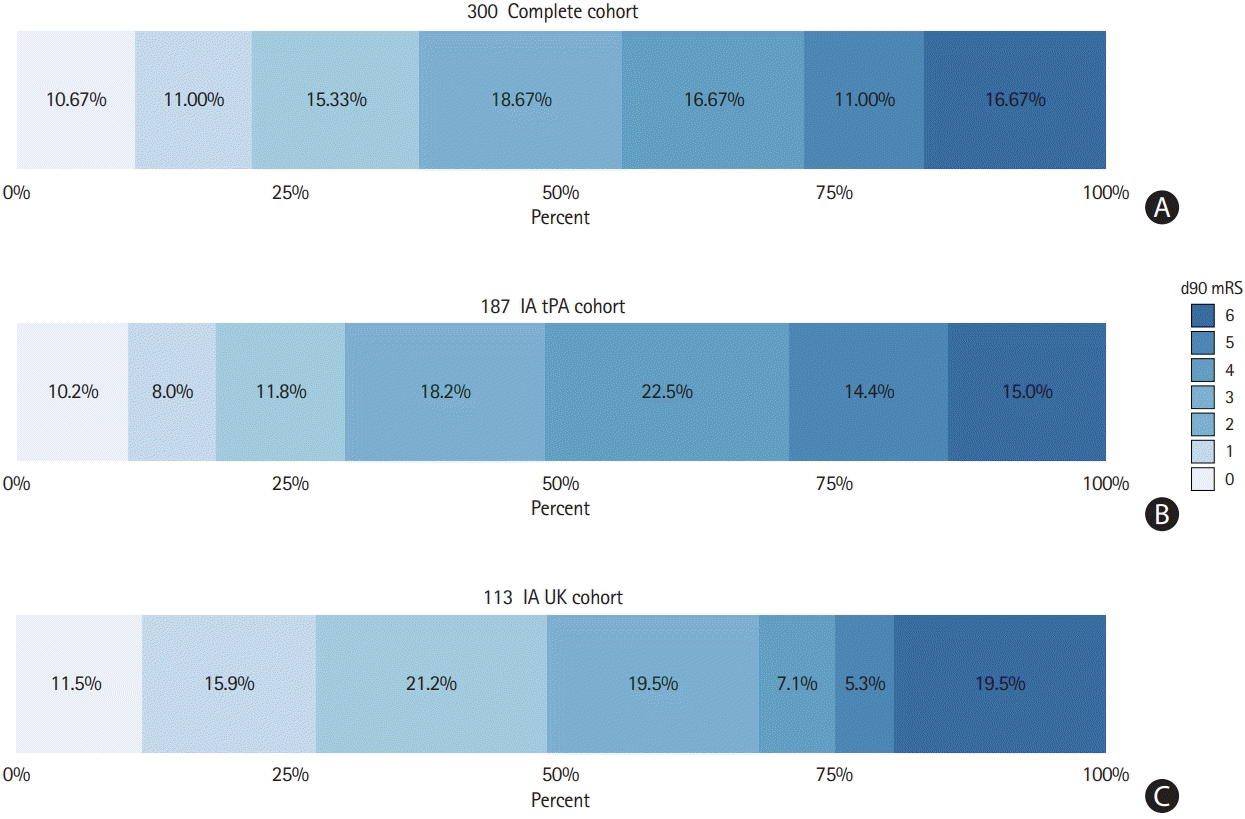
Figure 3.

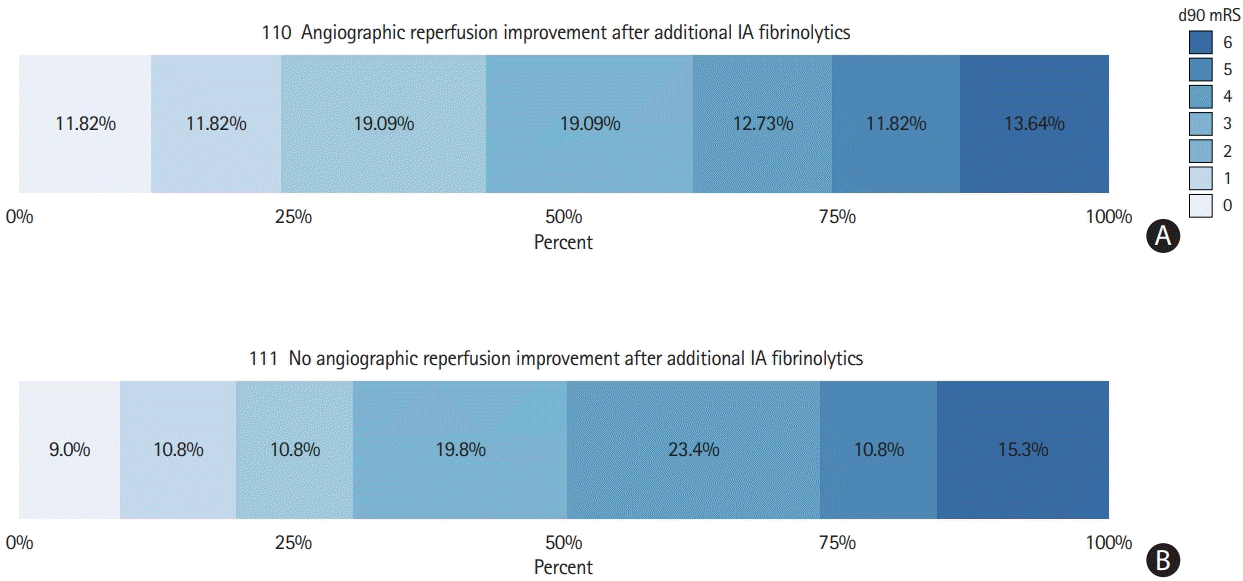
Figure 4.

Table 3.
| TICI before IA fibrinolytics |
mRS |
OR | ||
|---|---|---|---|---|
| >2 | ≤2 | |||
| 0 | ARI– | 8 (100) | 0 (0) | |
| ARI+ | 6 (66.7) | 3 (33.3) | ||
| Total (TICI0) | 14 (82.4) | 3 (17.6) | 1.50 (0.95-2.38) | |
| 1 | ARI– | 3 (75) | 1 (25) | |
| ARI+ | 4 (66.7) | 2 (33.3) | ||
| Total (TICI1) | 7 (70) | 3 (30) | 1.50 (0.09–25.39) | |
| 2a | ARI– | 14 (77.8) | 4 (22.2) | |
| ARI+ | 17 (63.0) | 10 (37.0) | ||
| Total (TICI2a) | 31 (68.9) | 14 (31.1) | 2.06 (0.53–8.00) | |
| 2b | ARI– | 52 (64.2) | 29 (35.8) | |
| ARI+ | 36 (52.9) | 32 (47.1) | ||
| Total (TICI2b) | 88 (59.1) | 61 (40.9) | 1.59 (0.83–3.08) | |
| All TICI | ARI– | 77 (69.4) | 34 (30.6) | |
| ARI+ | 63 (57.3) | 47 (42.7) | ||
| Total (all TICI) | 140 (63.3) | 81 (36.7) | cOR 1.83 (1.04–3.22)* | |
Values are presented as number (%). Calculated using Mantel-Haenszel statistics. P for heterogeneity of OR, 0.54 (Breslow-Day test). 95% Confidence intervals of OR were calculated using Woolf's approximation.
TICI, thrombolysis in cerebral infarction; IA, intra-arterial; mRS modified Rankin Scale; OR, odds ratio; ARI–/+, angiographic reperfusion improvement; cOR, common odds ratio.


 PDF
PDF Citation
 Print
Print


 XML Download