Journal List > Korean J Crit Care Med > v.29(4) > 1153887

Kim, Cho, Lim, Kim, Yang, and Lee: Change in Red Cell Distribution Width as Predictor of Death and Neurologic Outcome in Patients Treated with Therapeutic Hypothermia after Out-of-Hospital Cardiac Arrest

Abstract

Background

The prognostic significance of change in red cell distribution width (RDW) during hospital stays in patients treated with therapeutic hypothermia (TH) after out-of-hospital cardiac arrest (OHCA) was investigated.

Methods

Patients treated with TH after OHCA between January 2009 and August 2013 were reviewed. Patients with return of spontaneous circulation (ROSC) were assessed according to Utstein Style. Hematologic variables including RDW, hematocrit, white blood cell count, and platelets were also obtained. RDW changes during the 72 hours after ROSC were categorized into five groups as follows: Group 1 (−0.8–0.1%), Group 2 (0.2–0.3%), Group 3 (0.4–0.5%), Group 4 (0.6–0.8%), and Group 5 (>0.8%).

Results

A total of 218 patients were enrolled in the study. RDW changes during the 72 hours after ROSC in Group 4 (HR 3.56, 95% CI 1.25–10.20) and Group 5 (HR 5.07, 95% CI 1.73–14.89) were associated with a statistically significant difference in one-month mortality. RDW changes were associated with statistically significant differences in neurologic outcome at 6 months after ROSC (Group 3 [HR 2.45, 95% CI 1.17–5.14], Group 4 [HR 2.79, 95% CI 1.33–5.84], Group 5 [HR 3.50, 95% CI 1.35–7.41]). Other significant variables were location of arrest, cause of arrest, serum albumin, and advanced cardiac life support time.

Conclusions

RDW change during the 72 hours after ROSC is a predictor of mortality and neurologic outcome in patients treated with TH after OHCA.

Introduction

The number of people who suffer cardiac arrest (CA) outside a hospital has increased recently. In 2012, there were 359,400 out-of-hospital cardiac arrests (OHCA) in the U.S, and only 9.5% of these patients survived.[1] It was also reported that only 7–10% of OHCA patients regained normal brain function[2,3] and that more than 90% ended up developing neurological impairment or dying.[4] Even patients who achieve return of spontaneous circulation (ROSC) may experience post-cardiac arrest syndrome, which is a pathophysiological process that affects multiple organs.[5] While poor outcomes after CA pose a significant challenge, many studies have explored variables associated with mortality rate and neurological outcome after ROSC.[610]
The red cell distribution width (RDW) measures the variation of red blood cell size and is included in a complete blood count (CBC) laboratory test. RDW is useful in differentiating type of anemia[11,12] and is considered a strong prognostic marker for death caused by various diseases, including cardiovascular disease and inflammation. A high RDW value is also characteristic of CA, indicating a generally deteriorated systemic condition. Several previous studies have suggested that RDW is a prognostic marker for early death in trauma patients and OHCA patients;[13,14] however, there is not enough evidence to support their claims, and studies investigating the association of RDW with neurological outcome are very rare. The aim of this study was to explore the association of changes in RDW with one-month mortality rate and neurological outcome at 6 months after ROSC in OHCA patients treated with therapeutic hypothermia (TH).

Materials and Methods

1) Subjects

This study was performed at a tertiary university hospital in Korea with 90,000 emergency department visits per year and nearly 100 intensive care unit beds. This study was conducted on patients who underwent TH after ROSC among those admitted to the emergency department due to CA from January 2009 to August 2013 (56 months). Of those treated with TH, survivors of CA for at least 24 hours were included, while pregnant women, children under 15 years, and patients whose families did not consent to treatment were excluded.

2) Methods

Patient information was collected using an in-hospital cardiac arrest registry based on Utstein style. All subjects had a complete blood count (CBC) drawn in the emergency department. RDW was routinely measured in subjects as part of the CBC at 24, 48, and 72 hours from ROSC, and the levels of electrolyte and pro-brain type natriuretic peptide (pro-BNP) and other components of blood were also measured. When subjects had indications for receiving TH after ROSC, informed consent was collected, and TH was performed according to the American heart association (AHA) guidelines and an in-hospital TH protocol. Subjects with ROSC were rapidly cooled to 33°C or 34°C using surface or endovascular techniques, and then their body temperature was maintained at these target temperatures for 24 hours before rewarming began at a rate of 0.2 to 0.3°C per hour.

3) Subject variables

We analyzed demographic characteristics of subjects, location of CA, witness status, initial cardiac rhythm, subsequent cardiac rhythm, causes of CA, acute physiology and chronic health evaluation II (APACHE II) score, and RDW at baseline, 24, 48, and 72 hours after ROSC. Changes in RDW values for 72 hours were defined as explanatory variables.

4) Mortality and neurological outcome

We examined mortality within one month and neurological outcome at 6 months after ROSC. As shown in previous studies, the primary endpoint was early mortality, which was defined as death within one month in this study. Neurological outcome at 6 months was used as the secondary endpoint due to its reported usefulness in predicting long-term clinical outcomes. Cerebral performance category (CPC) score was used to assess neurological outcome on a 5-point scale: CPC 1 means good cerebral performance; 2 means moderate cerebral disability with independence in daily life; 3 means severe cerebral disability, conscious but dependent due to unstable cerebral function; 4 means coma or persistent vegetative state; and 5 means death. CPC 1–2 is classified as “good neurological outcome,” and CPC 3–5 is classified as “poor neurological outcome.”

5) Statistical analysis

All statistical analysis was performed using SPSS Statistics 18 (IBM corp., Inc., Chicago, IL, USA). Chi-square test was used for categorical variables, and Mann-Whitney U test was used for continuous variables that were not normally distributed. Cox proportional hazards regression model was used for multivariate analysis of mortality and neurological outcome, and the model was retrospectively adjusted. All tests for statistical significance were conducted by computing a 95% two-sided confidence interval.

Results

1) Characteristics of subjects

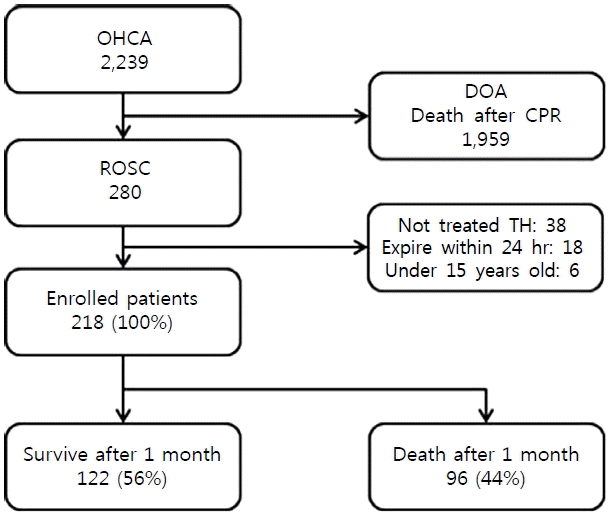
A total of 2,239 patients presented with OHCA from January 2009 to August 2013. Of those, 260 achieved ROSC. Patients were excluded if they did not undergo TH, if they died within 24 hours, or if they were under the age of 15 years. The remaining 218 subjects were analyzed (Fig. 1).
There were 149 men (68.3%) and 69 women (31.7%) with a median age of 51.5 years. Only 72 of 218 (33.0%) subjects received bystander cardiopulmonary resuscitation (CPR). Baseline RDW values were median 13.0% with interquartile range (IQR) 12.5–13.5%. Changes in RDW during the first 72 hours after ROC were median 0.4% with IQR 0.2–0.7%. Of the 218 subjects, 122 (56%) survived one month, 96 (44%) died, 60 (27.5%) had a CPC score of 1 or 2 at 6 months, and 155 (72%) had a CPC score of 3 or 4 (Table 1).
Variables significantly associated with one-month mortality included baseline electrocardiography (ECG) results, causes of CA, CA-basic life support (BLS) time, and CA-advanced cardiac life support (ACLS) time. In addition, baseline RDW value, change in RDW during the first 72 hours, albumin, S100, and APACHE II score were significantly associated with early mortality. Variables that were significantly associated with neurological outcome at 6 months included baseline ECG results, causes of CA, CA-BLS time, CA-ACLS time, age, and sex. According to CBC results, baseline RDW, change in RDW during the first 72 hours, hemoglobin, albumin, S100, and APACHE-II score were also significantly associated with neurological outcome (Table 2).

2) Analysis of change in red cell distribution width

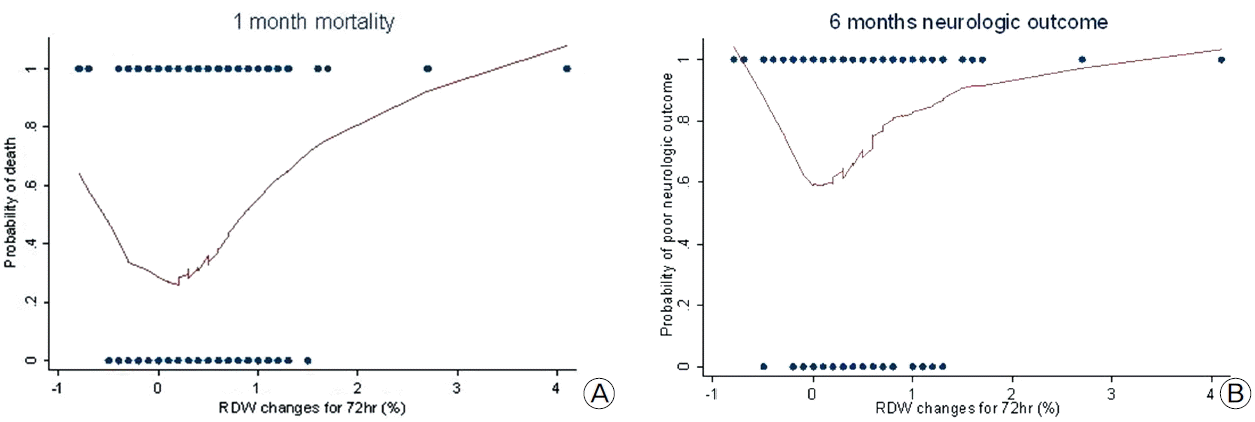
The relationship between RDW change and mortality and neurological outcome is U-shaped (Fig. 2). The bidirectional effects of RDW were divided into quintiles: quintile 1 represents −0.8–0.1% RDW change, quintile 2 represents 0.2–0.3% RDW increase, quintile 3 represents 0.4–0.5% RDW increase, quintile 4 represents 0.6–0.8% RDW increase, and quintile 5 represents more than 0.8% RDW increase. Because mortality rate was lower in quintile 2, statistical analysis was performed on the basis of quintile 2.

3) Multivariate analysis using Cox’s regression model

Multivariable Cox proportional hazards analysis was performed to assess the association between RDW change in 72 hours and one-month mortality rate. As a result, RDW change was statistically significant in quintile 4 (Hazard ratio [HR] 5.46, 95% confidence interval [CI] 1.54–19.40) and quintile 5 (HR 6.99, 95% CI 1.92–25.47). CA of non-cardiac origin, albumin, and CA-ACLS time were also statistically significant (Table 3).
The association of RDW change with neurological outcome at 6 months was statistically significant in quintile 3 (HR 2.45, 95% CI 1.17–5.14), quintile 4 (HR 2.79, 95% CI 1.33–5.84), and quintile 5 (HR 3.50, 95% CI 1.35–7.41). CA of non-cardiac origin, albumin, and CA–ACLS time also affected neurological outcome (Table 4).
These top three quintiles also showed a significant relationship with neurological outcome at one month: quintile 3 (HR 2.47 and 95% CI 1.19–5.15), quintile 4 (HR 2.93 and 95% CI 1.41–6.11), and quintile 5 (HR 3.53 and 95% CI 1.66–7.52).
Quintile 1, which contained negative changes in RDW, had no statistically significant effect on either mortality or neurological outcome.

Discussion

This study ascertains the efficacy of RDW change during the first 72 hours after ROSC as a predictor of mortality within one month and neurological outcome at 6 months. Currently, there is no mechanism that clearly explains the association between RDW change and mortality and neurological outcome. Some previous studies have described baseline RDW values as prognostic markers of early mortality in patients with critical illness, trauma, and OHCA. In other words, RDW level is likely to reflect the overall condition after CA and therefore is predictive of outcomes. In a previous study assessing the relationship between baseline RDW and mortality within one month in OHCA patients, the highest quartile showed a significant difference with HR 1.95 (95% CI 1.05–3.60, p = 0.034), compared with the lowest quartile.[14] Although the connection with neurological outcome was not discussed in that study, this study identified the association of RDW with neurological outcome by analyzing the impacts of baseline RDW and changes in RDW during 72 hours. No significant impact was found in the former, whereas a statistically significant impact was found in the latter.
Several studies have addressed the role of RDW changes in predicting outcomes. One of them reported that RDW was significantly increased by 0.58 at 72 hours after bacteremia, compared with baseline values (p = 0.01).[15] Another study reported that RDW changes during 72 hours were significantly meaningful factors in predicting mortality at 28 days in septic patients.[16] Thus, the effect of RDW changes during 72 hours appears to be consistent across studies. This study, however, found no significant impact of RDW changes during the first 24 and 48 hours.
Several studies addressed the effectiveness of RDW as a prognostic marker in patients with critical illness. RDW was significantly effective in the prediction of mortality at 30 days in patients with community-acquired pneumonia.[17] RDW was reported as a strong independent prognostic marker of death from all causes in patients who underwent coronary angiogram (HR 2.69, 95% CI 1.50–4.84, p < 0.01).[18] RDW was the second most effective variable in predicting survival rate within one year (next to NT-pro-BNP) in patients with renal failure.[19] Finally, the highest quartile of RDW was significantly associated with mortality from all causes in one population.[20]
Most studies were focused on the association between baseline RDW and mortality. This study, however, included neurological outcome at 6 months and looked at changes in RDW over time, making its results worthwhile.
This study has the following limitations. First, patients at a university hospital are not a random sample from the population of OHCA patients, and the results cannot be generalized to the larger population. Second, the sample size is not large enough to ensure statistical significance. Third, therapeutic hypothermia was one of the most important inclusion criteria in this study; therefore, it does not include any clinical data on patients who did not undergo TH. Even so, TH is widely used around the world to assure a more favorable outcome for patients with post-cardiac arrest syndrome. Any valid way to predict outcomes in patients after TH is useful. Finally, because RDW changes were assessed for up to 72 hours after ROSC, there is no data and discussion on further changes in RDW after 72 hours.
Changes in RDW during the first 72 hours after ROSC were useful for predicting mortality within one month and neurological outcome at 6 months in OHCA patients. It is clinically worthwhile to demonstrate the prognostic ability of the cost-effective CBC in predicting early mortality and long-term neurological outcomes. Further prospective multicenter studies are needed to confirm this finding.

Notes

No potential conflict of interest relevant to this article was reported.

References

1). Go AS, Mozaffarian D, Roger VL, Benjamin EJ, Berry JD, Borden WB, et al. Heart disease and stroke statistics--2013 update: a report from the American heart association. Circulation. 2013; 127:e1–240.
2). Pell JP, Sirel JM, Marsden AK, Ford I, Walker NL, Cobbe SM. Presentation, management, and outcome of out of hospital cardiopulmonary arrest: comparison by underlying aetiology. Heart. 2003; 89:839–42.
crossref
3). Atwood C, Eisenberg MS, Herlitz J, Rea TD. Incidence of EMS-treated out-of-hospital cardiac arrest in Europe. Resuscitation. 2005; 67:75–80.
crossref
4). Temple A, Porter R. Predicting neurological outcome and survival after cardiac arrest. Continuing Education in Anaesthesia, Critical Care & Pain. [serial on the internet]. 2012. May. [2012 May 21]. Available from http://ceaccp.oxfordjournals.org/content/early/2012/05/20/bjaceaccp.mks029.full.
crossref
5). Neumar RW, Nolan JP, Adrie C, Aibiki M, Berg RA, Böttige BW, et al. Post-cardiac arrest syndrome: epidemiology, pathophysiology, treatment, and prognostication. A consensus statement from the International liaison committee on resuscitation (American heart association, Australian and New Zealand Council on resuscitation, European resuscitation council, heart and stroke foundation of Canada, InterAmerican heart foundation, resuscitation council of Asia, and the resuscitation council of Southern Africa); the American heart association emergency cardiovascular care committee; the council on cardiovascular surgery and anesthesia; the council on cardiopulmonary, perioperative, and critical care; the council on clinical cardiology; and the stroke council. Circulation. 2008; 118:2452–83.
6). Peberdy MA, Callaway CW, Neumar RW, Geocadin RG, Zimmerman JL, Donnino M, et al. Part 9: post-cardiac arrest care 2010 American heart association guidelines for cardiopulmonary resuscitation and emergency cardiovascular care. Circulation. 2010; 122:S768–86.
7). Sasson C, Rogers MA, Dahl J, Kellermann AL. Predictors of survival from out-of-hospital cardiac arrest: a systematic review and meta-analysis. Circ Cardiovasc Qual Outcomes. 2010; 3:63–81.
8). Fugate JE, Wijdicks EF, Mandrekar J, Claassen DO, Manno EM, White RD, et al. Predictors of neurologic outcome in hypothermia after cardiac arrest. Ann Neurol. 2010; 68:907–14.
crossref
9). Sandroni C, Nolan J, Cavallaro F, Antonelli M. In-hospital cardiac arrest: incidence, prognosis and possible measures to improve survival. Intensive Care Med. 2007; 33:237–45.
crossref
10). Scolletta S, Donadello K, Santonocito C, Franchi F, Taccone FS. Biomarkers as predictors of outcome after cardiac arrest. Expert Rev Clin Pharmacol. 2012; 5:687–99.
crossref
11). Morris M, Davey FR. Basic examination of blood. Clinical diagnosis and management by laboratory methods. 20th ed.Henry JB, editor. Philadelphia: W.B. Saunders Company;2001. p. 544–5.
12). Demir A, Yarali N, Fisgin T, Duru F, Kara A. Most reliable indices in differentiation between thalassemia and trait and iron deficiency anemia. Pediatr Int. 2002; 44:612–6.
13). Majercik S, Fox J, Knight S, Horne BD. Red cell distribution width is predictive of mortality in trauma patients. J Trauma Acute Care Surg. 2013; 74:1021–6.
crossref
14). Kim J, Kim K, Lee JH, Jo YH, Rhee JE, Kim TY, et al. Red blood cell distribution width as an independent predictor of all-cause mortality in out of hospital cardiac arrest. Resuscitation. 2012; 83:1248–52.
crossref
15). Lee JH, Chung HJ, Kim K, Jo YH, Rhee JE, Kim YJ, et al. Red cell distribution width as a prognostic marker in patients with community-acquired pneumonia. Am J Emerg Med. 2013; 31:72–9.
crossref
16). Slaughter E, Mount C, Schofield C. Changes in red blood cell width distribution as a novel biomarker for bacteremia. Crit Care Med. 2013; 41:A259.
17). Kim CH, Park JT, Kim EJ, Han JH, Han JS, Choi JY, et al. An increase in red blood cell distribution width from baseline predicts mortality in patients with severe sepsis or septic shock. Critical Care. [serial on the internet]. 2013; Dec. [2013 Dec 9]. Available from http://ccforum.com/content/17/6/R282.
crossref
18). Cavusoglu E, Chopra V, Gupta A, Battala VR, Poludasu S, Eng C, et al. Relation between red blood cell distribution width (RDW) and all-cause mortality at two years in an unselected population referred for coronary angiography. Int J Cardiol. 2010; 141:141–6.
crossref
19). Al-Najjar Y, Goode KM, Zhang J, Cleland JG, Clark AL. Red cell distribution width: an inexpensive and powerful prognostic marker in heart failure. Eur J Heart Fail. 2009; 11:1155–62.
crossref
20). Chen PC, Sung FC, Chien KL, Hsu HC, Su TC, Lee YT. Red blood cell distribution width and risk of cardiovascular events and mortality in a community cohort in Taiwan. Am J Epidemiol. 2010; 171:214–20.
crossref

Fig. 1.
Study subject flow diagram. There were 2,239 patients admitted for OHCA from January 2009 to August 2013. 280 patients achieved ROSC. 62 patients were excluded because they were not treated with TH, they died within 24 hours, or they were younger than 15 years. A total of 218 patients were included in the final analysis. 122 (56%) patients survived at one month, while 96 (44%) patients died. OHCA: out-of-hospital cardiac arrest; DOA: death on arrival; CPR: cardiopulmonary resuscitation; ROSC: return of spontaneous circulation; TH: therapeutic hypothermia.
kjccm-2014-29-4-313f1.tif
Fig. 2.
Probability of one-month mortality and 6 months neurologic outcome according to RDW changes for 72 hours after ROSC. (A) This graph shows one-month mortality according to RDW changes for 72 hours after ROSC. Increased or decreased RDW changes in both directions seem to increase mortality. (B) This graph shows the 6-month neurologic outcome according to RDW changes for 72 hours after ROSC. Increased or decreased RDW changes in both directions seem to increase incidence of poor neurologic outcome. RDW: red cell distribution width; ROSC: return of spontaneous circulation.
kjccm-2014-29-4-313f2.tif
Table 1.
Baseline characteristics of study population (n = 218)
Variables Median (IQR)
Male sex, n (%) 149 (68.3)
Age, yr (mean ± SD) 51.6 ± 14.9
Location, n (%)
Home 116 (53.2)
Public 96 (44.0)
Other 6 (2.8)
Bystander 72 (33.0)
Shockable rhythm, n (%) 67 (30.7)
Cardiogenic, n (%) 119 (54.6)
Hb, g/dL 14 (12.5–15.4)
Hct, % 41 (36.7–44.6)
WBC, × 103/mm3 12.36 (9.8–16.0)
RDW, % 13 (12.5–13.5)
RDW change during 72 hr, % 0.4 (0.2–0.7)
MCV, fl 91.8 (88.5–95)
MCH, pg 31.4 (30.2–32.5)
Plt, × 103/mm 217 (177.5–253.5)
BUN, mg/dL 15.8 (12.3–20.8)
Cr, mg/dL 1.1 (0.9–1.3)
Alb, g/dL 3.95 (3.6–4.2)
S100 1.29 (0.4–3.2)
lactate 7.95 (5.8–11.2)
Pro-BNP, pg/ml 96.42 (41.47–528.65)
APACHE II 27 (23–31)
BLS time, min 6 (2–10)
ACLS time, min 20 (15–27)
1-month mortality, n (%) 96 (44.0)
6-month CPC, n (%)
Good 60 (27.5)
Poor 158 (72.5)

IQR: interquartile range; Hb: hemoglobin; Hct: hematocrit; WBC: white blood cell; RDW: red cell distribution width; MCV: mean corpuscular volume; fl: femtoliters; pg: picogram; Plt: platelet; BUN: blood urea nitrogen; Cr: creatinine; Alb: albumin; BNP: B-type natriuretic peptide; APACHE: acute physiology and chronic health evaluation; BLS: basic life support; ACLS: advanced cardiac life support; CPC: cerebral performance category.

Table 2.
Variables by mortality at 1 month and neurologic outcome at 6 months after ROSC (N = 218)
Variables 1-month mortality, n (%) 6-month neurologic outcome, n (%)


Survived (n = 122) Death (n = 96) p value Good (n = 60) Poor (n = 158) p value
Male sex 89 (73.0) 60 (62.5) 0.100 49 (81.7) 100 (63.3) 0.009
Age, yr (mean ± SD) 50.3 ± 14.1 53.3 ± 15.7 0.141 47.1 ± 11.7 53.3 ± 15.6 0.007
Location 0.073 0.154
Home 60 (50.8) 54 (56.3) 29 (48.3) 87 (55.1)
Public 59 (48.4) 37 (38.5) 31 (51.7) 65 (41.1)
Other 1 (0.8) 5 (5.2) 0 6 (3.8)
Bystander 46 (37.7) 26 (27.1) 0.098 23 (38.3) 49 (31) 0.305
Shockable rhythm 51 (41.8) 16 (16.7) < 0.001 36 (60) 31 (19.6) <0.001
Cardiogenic 84 (68.9) 35 (36.5) < 0.001 56 (93.3) 63 (39.9) <0.001
BLS time, median (IQR) 6 (1–9) 7 (4–12) 0.080 5 (0–9) 7 (4–12) 0.007
ACLS time, median (IQR) 19 (14–24) 23 (18–30) < 0.001 19 (13–22) 21 (16–29) 0.013
RDW, % 12.9 (12.4–13.4) 13.1 (12.6–13.7) 0.009 12.7 (12.3–13.2) 13.1 (12.6–13.6) <0.001
RDW change during 72 hr, % 0.3 (0.1–0.5) 0.6 (0.2–0.9) 0.002 0.3 (0.1–0.5) 0.4 (0.2–0.8) 0.003
Hb, g/dL 14.3 (13.3–15.8) 13.3 (11.3–15.0) < 0.001 14.9 (13.7–16.4) 13.5 (11.7–15.0) <0.001
Alb, g/dL 4.0 (3.8–4.2) 3.8 (3.4–4.1) < 0.001 4.1 (3.8–4.3) 3.9 (3.5–4.2) 0.002
S100 1.1 (0.4–2.3) 1.7 (0.6–5.4) 0.018 0.8 (0.3–1.8) 1.5 (0.6–4.0) 0.001
APACHE II 26 (23–29) 29 (26–33) < 0.001 26 (22–29) 28 (24–32) 0.003

ROSC: return of spontaneous circulation; SD: standard deviation; BLS: basic life support; IQR: interquartile range; ACLS: advanced cardiac life support; RDW: red cell distribution width; Hb: hemoglobin; Alb: albumin; APACHE: acute physiology and chronic health evaluation.

Table 3.
Multivariate cox proportional regression model of the association between predictor variables and mortality in PCAS patients at 1 month after ROSC
Unadjusted hazard ratio (95% CI) Adjusted hazard ratio (95% CI)
RDW changes
Group 1 (−0.8–0.1) 1.82 (0.77–4.29) 3.62 (0.99–13.15)
Group 2 (0.2–0.3) Ref. Ref.
Group 3 (0.4–0.5) 1.73 (0.71–4.22) 3.48 (0.90–13.55)
Group 4 (0.6–0.8) 3.33 (1.45–7.67) 5.46 (1.54–19.40)
Group 5 (> 0.8) 4.45 (1.95–10.19) 6.99 (1.92–25.47)
Age 1.01 (0.99–1.02) -
Female 1.49 (0.97–2.30) -
Rhythm
Shockable Ref. -
Non-shockable 2.71 (1.53–4.81) -
Location
Home Ref. Ref.
Public 0.78 (0.50–1.22) 0.79 (0.42–1.47)
Other 2.59 (1.03–6.52) 6.03 (1.90–19.14)
Bystander
Bystander Ref. -
No-bystander 1.31 (0.82–2.08) -
Cause
Cardiac Ref. Ref.
Non-cardiac 2.80 (1.79–4.37) 3.01 (1.58–5.73)
Hb 0.86 (0.79–0.93) -
Alb 0.46 (0.31–0.68) 0.52 (0.29–0.94)
S100 1.05 (1.04–1.09) 1.02 (0.99–1.05)
BLS time 1.02 (1.00–1.04) 0.97 (0.93–1.01)
ACLS time 1.03 (1.01–1.04) 1.04 (1.01–1.06)
APACHE II 1.06 (1.03–1.09) 1.02 (0.78–1.07)

PCAS: post-cardiac arrest syndrome; ROSC: return of spontaneous circulation; RDW: red cell distribution width; Hb: hemoglobin; Alb: albumin; BLS: basic life support; ACLS: advanced cardiac life support; APACHE: acute physiology and chronic health evaluation.

Table 4.
Multivariate cox proportional regression model of the association between predictor variables and neurologic outcome in PCAS patients at 6 months after ROSC
Unadjusted hazard ratio (95% CI) Adjusted hazard ratio (95% CI)
RDW changes
Group 1 (−0.8–0.1) 1.38 (0.79–2.44) 2.01 (0.98–4.15)
Group 2 (0.2–0.3) Ref. Ref.
Group 3 (0.4–0.5) 1.75 (0.99–3.05) 2.45 (1.17–5.14)
Group 4 (0.6–0.8) 2.20 (1.24–3.90) 2.79 (1.33–5.84)
Group 5 (>0.8) 2.86 (1.61–5.06) 3.50 (1.35–7.41)
Age 1.01 (1.00–1.02) 1.01 (0.99–1.02)
Female 1.54 (1.11–2.15) -
Rhythm
Shockable Ref. -
Non-shockable 2.54 (1.69–3.82) -
Location
Home Ref. Ref.
Public 0.81 (0.58–1.13) 0.81 (0.52–1.28)
Other 2.37 (1.03–5.45) 5.75 (2.15–15.42)
Bystander
Bystander Ref. -
No-bystander 1.20 (0.85–1.69) -
Cause
Cardiac Ref. Ref.
Non-cardiac 2.86 (2.05–4.00) 2.85 (1.85–4.41)
Hb 0.87 (0.82–0.93) -
Alb 0.54 (040–0.74) 0.64 (0.41–0.99)
S100 1.04 (1.00–1.07) 1.02 (0.99–1.05)
BLS time 1.02 (1.00–1.03) 0.97 (0.94–1.01)
ACLS time 1.02 (1.00–1.03) 1.03 (1.01–1.06)
APACHE II 1.05 (1.03–1.07) 1.02 (0.99–1.05)

PCAS: post-cardiac arrest syndrome; ROSC: return of spontaneous circulation; RDW: red cell distribution width; Hb: hemoglobin; Alb: albumin; BLS: basic life support; ACLS: advanced cardiac life support; APACHE: acute physiology and chronic health evaluation.

TOOLS
Similar articles