

 PDF
PDF Citation
 Print
Print


Introduction
Materials and Methods
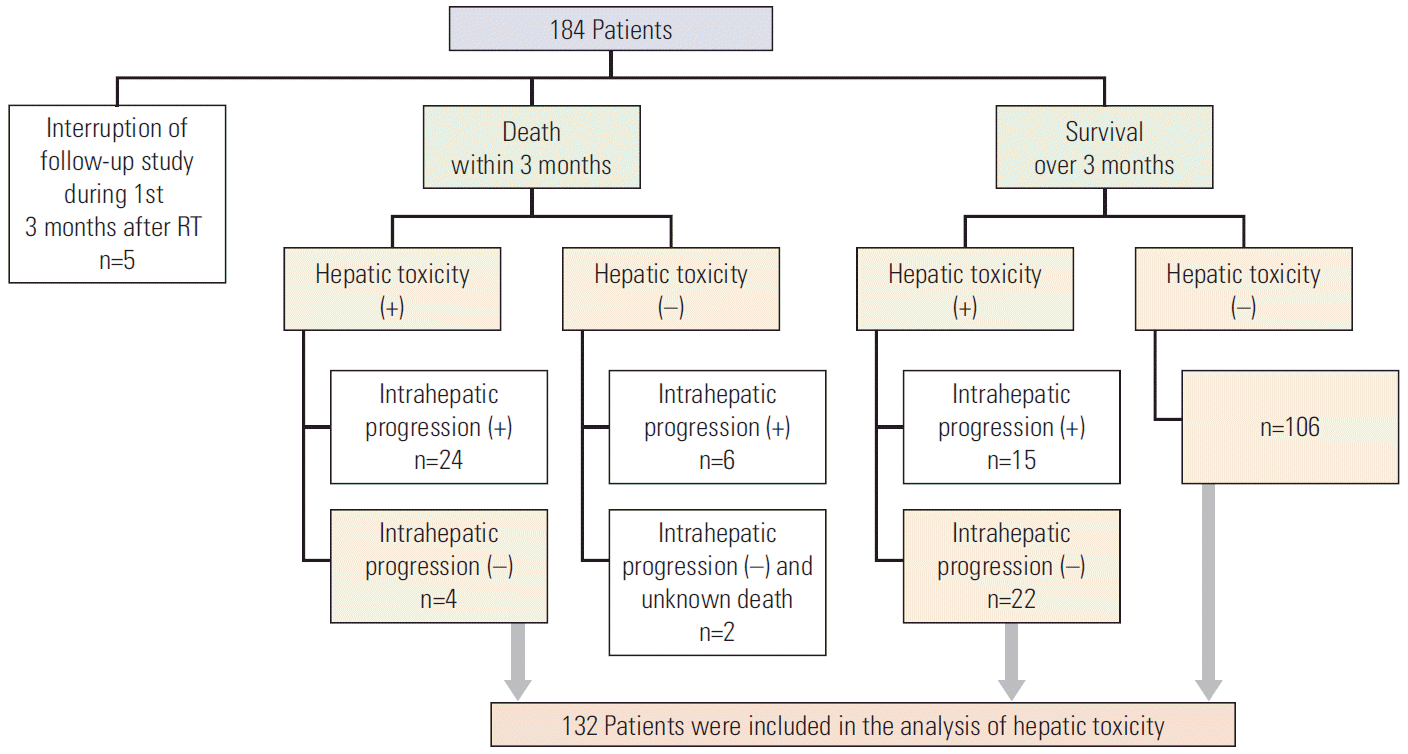
1. Patient selection
2. Evaluation of hepatic toxicity
3. Statistics
Results
1. Patients’ characteristics
Table 1.
| Characteristic | No. of patients (%) |
|---|---|
| Age, median (range, yr) | 58 (39-85) |
| Sex | |
| Male | 158 (85.9) |
| Female | 26 (14.1) |
| ECOG score | |
| 0 | 54 (29.3) |
| 1 | 80 (43.5) |
| 2 | 50 (27.2) |
| Hepatitis | |
| No | 11 (6.0) |
| HBV | 135 (73.4) |
| HCV | 25 (13.6) |
| Alcoholic | 13 (7.0) |
| Initial CP score | |
| 7 | 114 (62.0) |
| 8 | 57 (31.0) |
| 9 | 13 (7.0) |
| Tumor size, median (range, cm) | 5.4 (1-21) |
| No. of tumors | |
| 1 | 83 (45.1) |
| 2-3 | 54 (29.4) |
| 4-9 | 23 (12.5) |
| ≥ 10 | 24 (13.0) |
| Tumor location | |
| One lobe | 131 (71.2) |
| Both lobes | 53 (28.8) |
| Bile duct invasion | |
| No | 150 (81.5) |
| Yes | 34 (18.5) |
| PVTT | |
| No | 62 (33.7) |
| Yes | 122 (66.3) |
| Main PVTT | 54 (44.3) |
| Branched PVTT | 68 (55.7) |
| mUICC_T | |
| 1 | 10 (5.4) |
| 2 | 21 (11.4) |
| 3 | 61 (33.2) |
| 4 | 92 (50.0) |
| mUICC_N | |
| 0 | 158 (85.9) |
| 1 | 26 (14.1) |
| Previous liver-directed therapy | |
| No | 79 (42.9) |
| Yes | 105 (57.1) |
| Combined treatment | |
| No | 70 (38.0) |
| Yes | 114 (62.0) |
| Fraction size, median (range, Gy) | 2.5 (1.5-5) |
| BED, median (range, Gy10) | 56.0 (40.4-89.6) |
| RT completion | |
| Yes | 179 (97.3) |
| No | 5 (2.7)a) |
| AFP, median (range, IU/mL) | 242.7 (0.7-1136990) |
| Additional treatment | |
| No | 95 (51.6) |
| Yes | 89 (48.4) |
ECOG, Eastern Cooperative Oncology Group; HBV, hepatitis B virus; HCV, hepatitis C virus; CP, Child-Pugh; PVTT, portal vein tumor thrombosis; mUICC, the modified International Union Against Cancer stage; T, tumor; N, lymph nodes; BED, biologically effective dose when the α/β ratio was assumed to be 10 Gy; AFP, α-fetoprotein.
![]()
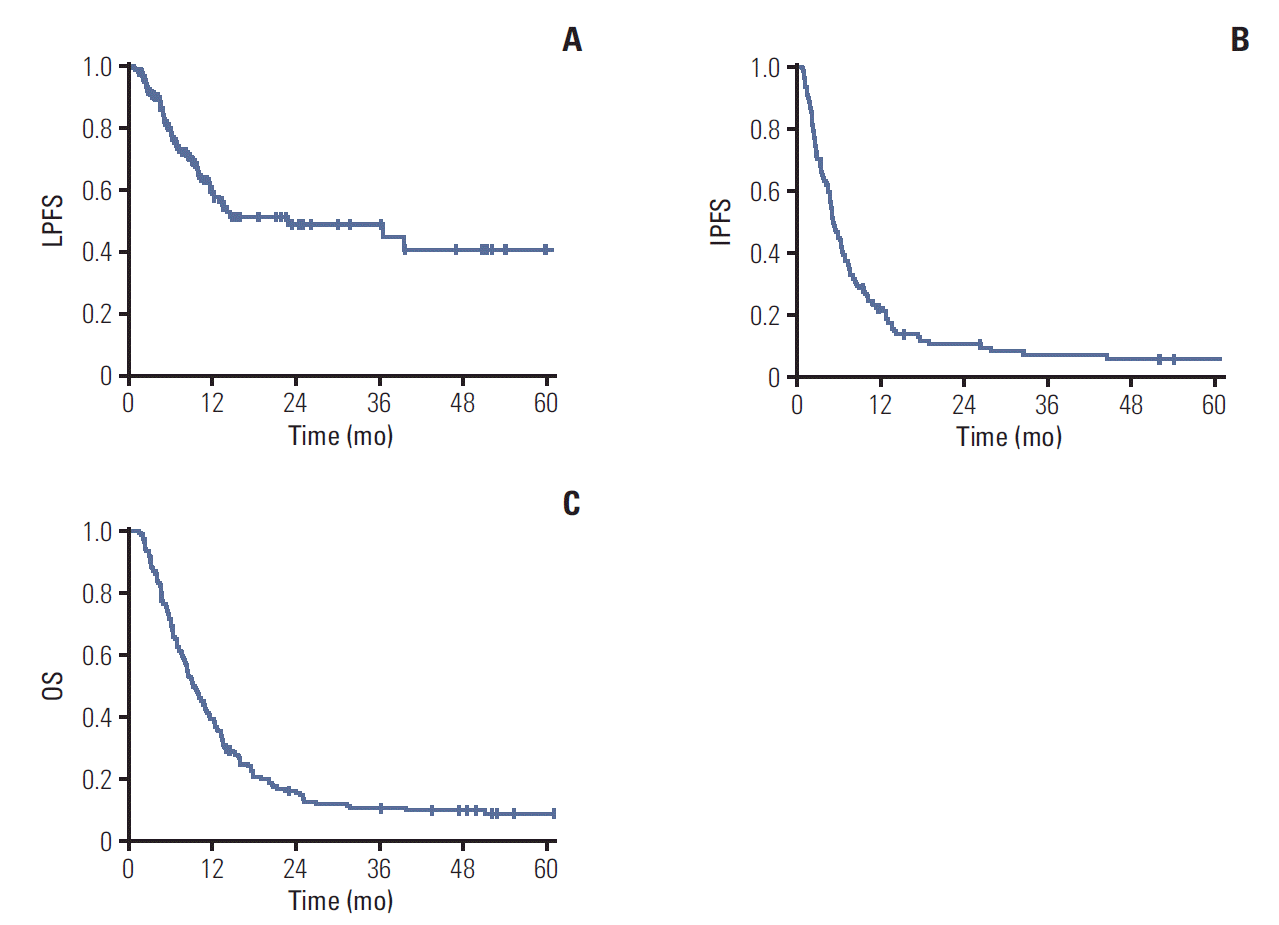
2. Outcomes
Fig. 2.
![]()
Fig. 3.
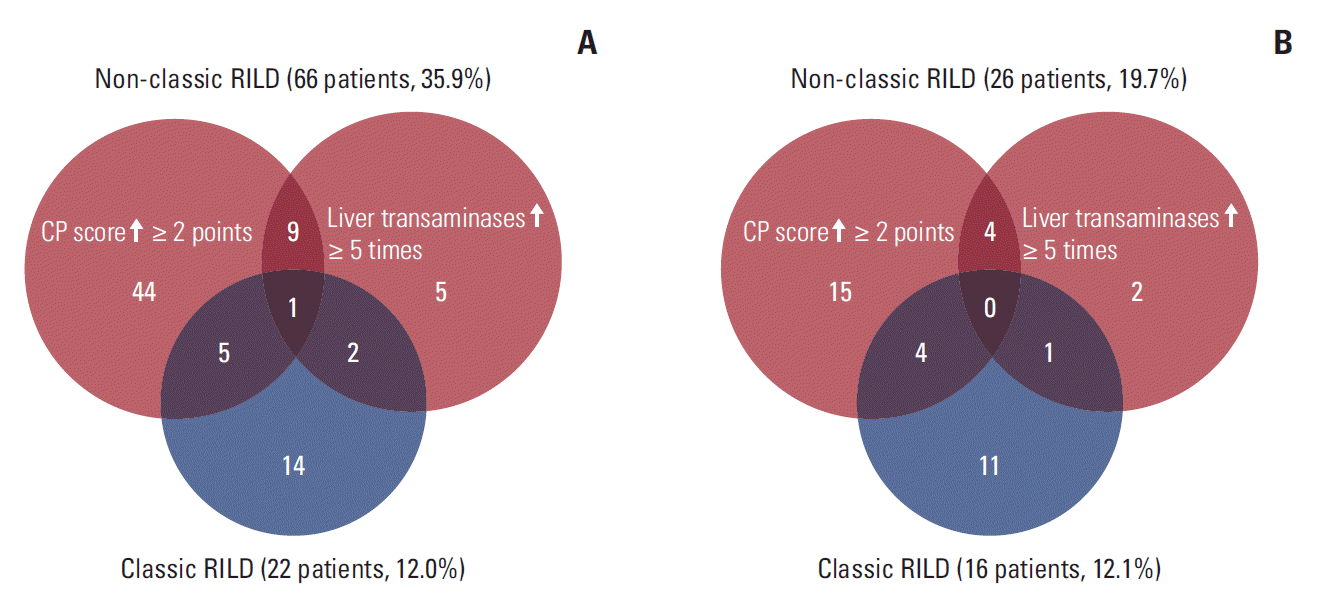
![]()
Table 2.
| Factor | No. of patients | 1-Year OS (%) | Median OS (mo) | UVA p-value | MVA HR (95% CI) | MVA p-value |
|---|---|---|---|---|---|---|
| Age (yr) | ||||||
| ≤ 60 | 107 | 30.8 | 8.3 | 0.154 | 0.722 | 0.104 |
| > 60 | 77 | 51.3 | 12.2 | (0.487-1.069) | ||
| Sex | ||||||
| Male | 158 | 35.8 | 9.1 | 0.055 | 1.174 | 0.622 |
| Female | 26 | 60.6 | 13.4 | (0.621-2.219) | ||
| ECOG score | ||||||
| 0-1 | 134 | 40.2 | 9.4 | 0.817 | - | - |
| 2 | 50 | 37.2 | 9.7 | |||
| Hepatitis | ||||||
| No | 10 | 57.1 | 20.7 | 0.020 | Reference | 0.011 |
| HBV/HCV | 160 | 40.0 | 9.5 | 1.970 (0.829-4.683) | 0.125 | |
| Alcoholic | 14 | 19.0 | 5.3 | 4.559 (1.570-13.235) | 0.005 | |
| Initial CP score | ||||||
| 7 | 114 | 43.2 | 10.7 | 0.381 | - | - |
| 8 | 57 | 35.5 | 9.1 | |||
| 9 | 13 | 23.1 | 5.6 | |||
| Tumor size (cm) | ||||||
| ≤ 5 | 85 | 48.7 | 11.1 | 0.019 | - | - |
| > 5 | 99 | 31.4 | 8.0 | |||
| No. of tumors | ||||||
| 1-3 | 137 | 43.6 | 10.1 | 0.014 | - | - |
| ≥ 4 | 47 | 26.7 | 8.0 | |||
| Tumor location | ||||||
| One lobe | 131 | 42.1 | 10.1 | 0.052 | - | - |
| Both lobes | 53 | 32.6 | 8.2 | |||
| PVTT | ||||||
| No | 62 | 55.1 | 13.2 | < 0.001 | 1.022 | 0.928 |
| Yes | 122 | 31.6 | 8.0 | (0.636-1.643) | ||
| mUICC_T | ||||||
| 1, 2 | 31 | 72.7 | 24.1 | < 0.001 | 3.277 | 0.002 |
| 3, 4 | 153 | 32.5 | 8.3 | (1.546-6.944) | ||
| mUICC_N | ||||||
| 0 | 158 | 41.8 | 10.0 | 0.031 | 1.355 | 0.242 |
| 1 | 26 | 22.8 | 6.4 | (0.815-2.254) | ||
| Initial AFP (IU/mL) | ||||||
| ≤ 200 | 87 | 47.1 | 11.1 | 0.003 | 1.875 | 0.005 |
| > 200 | 92 | 29.2 | 8.0 | (1.207-2.911) | ||
| RT aima) | ||||||
| Curative | 99 | 43.2 | 10.1 | 0.044 | 0.876 | 0.486 |
| Palliative | 85 | 34.8 | 8.3 | (0.604-1.271) | ||
| BED (Gy10) | ||||||
| ≤ 53 | 75 | 31.4 | 8.3 | 0.029 | 0.946 | 0.760 |
| > 53 | 109 | 45.1 | 10.1 | (0.664-1.349) | ||
| AFP responseb) | ||||||
| Yes | 79 | 44.4 | 9.8 | 0.012 | 0.593 | 0.013 |
| No | 81 | 24.2 | 6.6 | (0.393-0.894) | ||
| Classic RILD | ||||||
| No | 162 | 41.2 | 9.7 | 0.582 | - | - |
| Yes | 22 | 27.3 | 7.7 | |||
| Non-classic RILD | ||||||
| No | 118 | 51.3 | 12.2 | < 0.001 | 2.674 | < 0.001 |
| Yes | 66 | 17.2 | 5.1 | (1.826-3.916) | ||
| Additional treatment | ||||||
| No | 95 | 27.0 | 7.0 | 0.001 | 2.159 | < 0.001 |
| Yes | 89 | 51.7 | 12.2 | (1.479-3.152) |
OS, overall survival; UVA, univariate analysis; MVA, multivariate analysis; HR, hazard ratio; CI, confidence interval; ECOG, Eastern Cooperative Oncology Group; HBV, hepatitis B virus; HCV, hepatitis C virus; CP, Child-Pugh; PVTT, portal vein tumor thrombosis; mUICC, the modified International Union Against Cancer stage; T, tumor; N, lymph nodes; AFP, α-fetoprotein; RT, radiotherapy; BED, biologically effective dose when the α/β ratio was assumed to be 10 Gy; RILD, radiation-induced liver disease.
![]()
3. Predictors for non-classic RILD
Table 3.
| Parameter | Mean±standard deviation | p-value | ROC AUC |
|---|---|---|---|
| GTV (mL) | 287.7±585.7 | 0.211 | 0.666 |
| TLV (mL) | 1,555.8±758.7 | 0.311 | 0.571 |
| NLV (mL) | 1,184.4±442.2 | 0.013 | 0.694 |
| DTLV_mean EQD28 (Gy)a) | 18.1±8.8 | 0.041 | 0.593 |
| TLV5Gy EQD28 (%)b) | 71.8±17.3 | 0.120 | 0.582 |
| TLV10Gy EQD28 (%) | 58.9±18.3 | 0.082 | 0.607 |
| TLV15Gy EQD28 (%) | 50.0±18.9 | 0.023 | 0.644 |
| TLV20Gy EQD28 (%) | 43.2±19.6 | 0.019 | 0.648 |
| TLV25Gy EQD28 (%) | 37.6±19.6 | 0.051 | 0.618 |
| TLV30Gy EQD28 (%) | 32.7±19.9 | 0.051 | 0.594 |
| TLV35Gy EQD28 (%) | 28.5±19.3 | 0.039 | 0.595 |
| TLV40Gy EQD28 (%) | 21.8±19.5 | 0.003 | 0.635 |
| DNLV_mean EQD28 (Gy) | 13.9±5.4 | 0.794 | 0.508 |
| NLV5Gy EQD28 (%)c) | 68.7±17.4 | 0.203 | 0.582 |
| NLV10Gy EQD28 (%) | 53.0±16.2 | 0.373 | 0.560 |
| NLV15Gy EQD28 (%) | 42.0±15.2 | 0.190 | 0.592 |
| NLV20Gy EQD28 (%) | 34.1±14.4 | 0.143 | 0.606 |
| NLV25Gy EQD28 (%) | 27.7±13.4 | 0.495 | 0.551 |
| NLV30Gy EQD28 (%) | 22.4±12.4 | 0.470 | 0.551 |
| NLV35Gy EQD28 (%) | 17.9±11.3 | 0.205 | 0.577 |
| NLV40Gy EQD28 (%) | 12.1±10.8 | 0.057 | 0.591 |
ROC, receiver operator characteristics; AUC, area under the curve; GTV, gross tumor volume; TLV, total liver volume; NLV, normal liver volume, which was defined as the total liver volume minus GTV in seven institutions and as the TLV minus the planning target volume in six institutions; EQD2, equivalent dose of 2 Gy per fraction.
![]()
 XML Download