Introduction
Materials and Methods
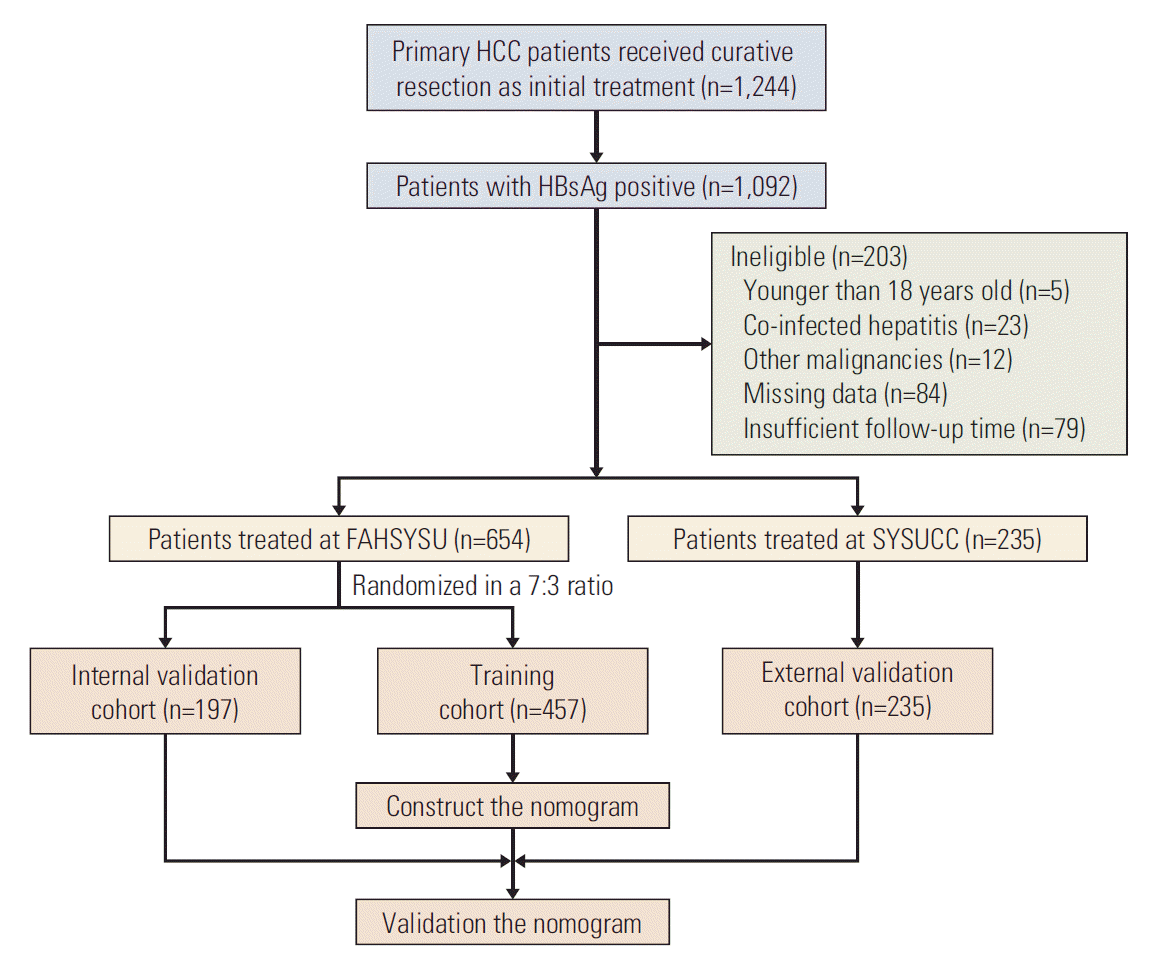
1. Study population
2. Data collection
3. Formulas of inflammation-related markers
4. Hepatic resection
5. Follow-ups
6. Statistical analysis
Results
1. Baseline characteristics
Table 1.
| Variable | Total (n=889) | Training cohort (n=457) | Internal cohort (n=197) | p-valuea) | External cohort (n=235) | p-valueb) |
|---|---|---|---|---|---|---|
| Age (yr) | 50.4 (42.9-59.0) | 51.5 (43.3-58.7) | 49.0 (42.4-58.6) | 0.291 | 50.2 (42.4-59.7) | 0.799 |
| Sex, female/male | 98/791 (11.0/89.0) | 55/402 (12.0/88.0) | 25/172 (12.7/87.3) | 0.814 | 18/217 (7.7/92.3) | 0.076 |
| Leukocyte (×109/L) | 6.1 (4.9-7.5) | 6.2 (5.0-7.6) | 6.2 (5.0-7.8) | 0.706 | 5.9 (4.8-7.1) | 0.095 |
| Neutrophil ratio | 0.6 (0.5-0.6) | 0.6 (0.5-0.6) | 0.6 (0.5-0.7) | 0.605 | 0.6 (0.5-0.6) | 0.543 |
| Monocyte ratio | 0.1 (0.1-0.1) | 0.1 (0.1-0.1) | 0.1 (0.1-0.1) | 0.841 | 0.1 (0.1-0.1) | < 0.001 |
| Lymphocyte ratio | 0.3 (0.2-0.4) | 0.3 (0.2-0.4) | 0.3 (0.2-0.3) | 0.372 | 0.3 (0.2-0.4) | 0.107 |
| Haemoglobin (≤ 128 g/L/> 128 g/L) | 184/705 (20.7/79.3) | 107/350 (23.4/76.6) | 44/153 (22.3/77.7) | 0.764 | 33/202 (14.0/86.0) | 0.004 |
| Platelet (×109/L) | 181.0 (135.0-225.0) | 186.0 (142.0-230.0) | 191.0 (150.0-235.0) | 0.367 | 161.6 (122.4-201.9) | < 0.001 |
| Albumin (g/L) | 40.2 (37.2-42.9) | 39.8 (36.7-42.1) | 40.0 (37.0-42.4) | 0.388 | 41.9 (38.9-44.0) | < 0.001 |
| AST (U/L) | 39.0 (29.0-60.0) | 39.0 (29.0-63.0) | 42.0 (32.0-62.0) | 0.154 | 37.5 (27.8-51.4) | 0.045 |
| ALT (U/L) | 39.0 (27.3-58.0) | 38.0 (26.0-56.0) | 42.0 (31.0-65.0) | 0.024 | 40.4 (27.6-57.9) | 0.345 |
| GGT (U/L) | 68.3 (41.0-129.0) | 71.0 (43.0-134.0) | 81.0 (46.0-172.0) | 0.155 | 52.4 (34.7-88.5) | < 0.001 |
| TBIL (> 12.5 μmol/L/≤ 12.5 μmol/L) | 522/367 (58.7/41.3) | 270/187 (59.1/40.9) | 119/78 (60.4/39.6) | 0.751 | 133/102 (56.6/43.4) | 0.530 |
| PT (> 12.8 sec/≤ 12.8 sec) | 330/559 (37.1/62.9) | 198/259 (43.3/56.7) | 91/106 (46.2/53.8) | 0.498 | 41/194 (17.4/82.6) | < 0.001 |
| INR (> 1.08/≤ 1.08) | 403/486 (45.3/54.7) | 222/235 (48.6/51.4) | 103/94 (52.3/47.7) | 0.384 | 78/157 (33.2/66.8) | < 0.001 |
| Alpha-fetoprotein (μg/L)c) | ||||||
| ≤ 20 | 267 (30.0) | 136 (29.8) | 52 (26.4) | 0.654 | 79 (33.6) | 0.297 |
| 20-200 | 212 (23.8) | 104 (22.8) | 49 (24.9) | 59 (25.1) | ||
| > 200 | 410 (46.1) | 217 (47.5) | 96 (48.7) | 97 (41.3) | ||
| Performance status (0/≥ 1) | 849/40 (95.5/4.5) | 431/26 (94.3/5.7) | 185/12 (93.9/6.1) | 0.840 | 233/2 (99.1/0.9) | 0.002 |
| Child-Pugh score (A/B) | 853/36 (96.0/4.0) | 427/30 (93.4/6.6) | 190/7 (96.4/3.6) | 0.057 | 233/2 (99.1/0.9) | 0.001 |
| BCLC stagec) | ||||||
| 0/A | 539 (60.6) | 240 (52.5) | 101 (51.3) | 0.658 | 198 (84.3) | < 0.001 |
| B | 91 (10.2) | 55 (12.0) | 20 (10.2) | 16 (6.8) | ||
| C | 259 (29.1) | 162 (35.4) | 76 (38.6) | 21 (8.9) | ||
| Tumor number | ||||||
| 1 | 682 (76.7) | 335 (73.3) | 145 (73.6) | 0.728 | 202 (86.0) | 0.001 |
| 2-3 | 117 (13.2) | 69 (15.1) | 26 (13.2) | 22 (9.4) | ||
| > 3 | 90 (10.1) | 53 (11.6) | 26 (13.2) | 11 (4.7) | ||
| Tumor diameter (≤ 5 cm/> 5 cm) | 383/506 (43.1/56.9) | 177/280 (38.7/61.3) | 77/120 (39.1/60.9) | 0.932 | 129/106 (54.9/45.1) | < 0.001 |
| Tumor differentiation (I-II/III-IV) | 736/153 (82.8/17.2) | 368/89 (80.5/19.5) | 163/34 (82.7/17.3) | 0.506 | 205/30 (87.2/12.8) | 0.027 |
| Cirrhosis (yes/no) | 586/303 (65.9/34.1) | 280/177 (61.3/38.7) | 122/75 (61.9/38.1) | 0.874 | 184/51 (78.3/21.7) | < 0.001 |
| Satellite lesions (yes/no) | 148/741 (16.6/83.4) | 90/367 (19.7/80.3) | 45/152 (22.8/77.2) | 0.361 | 13/222 (5.5/94.5) | < 0.001 |
| Microvascular invasion (yes/no) | 378/511 (42.5/57.5) | 180/277 (39.4/60.6) | 80/117 (40.6/59.4) | 0.056 | 102/133 (43.4/56.6) | 0.308 |
| Macrovascular invasion (yes/no) | 224/665 (25.2/74.8) | 137/320 (30.0/70.0) | 66/131 (33.5/66.5) | 0.371 | 21/214 (8.9/91.1) | < 0.001 |
| Tumor capsulec) | ||||||
| Complete | 646 (72.7) | 381 (83.4) | 152 (77.2) | 0.129 | 113 (48.1) | < 0.001 |
| Incomplete | 167 (18.8) | 68 (14.9) | 42 (21.3) | 57 (24.3) | ||
| Absence | 76 (8.5) | 8 (1.8) | 3 (1.5) | 65 (27.7) | ||
| Resection margin (> 1 cm /≤ 1 cm) | 731/158 (82.2/17.8) | 363/94 (79.4/20.6) | 152/45 (77.2/22.8) | 0.050 | 216/19 (91.9/8.1) | < 0.001 |
| NLR (≤ 1.91/> 1.91) | 409/480 (46.0/54.0) | 206/251 (45.1/54.9) | 84/113 (42.6/57.4) | 0.565 | 119/116 (50.6/49.4) | 0.165 |
| PLR (≤ 108.56/> 108.56) | 520/369 (58.5/41.5) | 254/203 (55.6/44.4) | 106/91 (53.8/46.2) | 0.676 | 160/75 (68.1/31.9) | 0.001 |
| LMR (≤ 3.79/> 3.79) | 477/412 (53.7/46.3) | 261/196 (57.1/42.9) | 116/81 (58.9/41.1) | 0.674 | 100/135 (42.6/57.4) | < 0.001 |
| GPR (≤ 0.94/> 0.94) | 491/398 (55.2/44.8) | 250/207 (54.7/45.3) | 101/96 (51.3/48.7) | 0.419 | 140/95 (59.6/40.4) | 0.221 |
| SII (≤ 202.14/> 202.14) | 213/676 (24.0/76.0) | 110/347 (24.1/75.9) | 35/162 (17.8/82.2) | 0.075 | 68/167 (28.9/71.1) | 0.165 |
| PNI (≤ 48.69/> 48.69) | 406/483 (45.7/54.3) | 233/224 (51.0/49.0) | 91/106 (46.2/53.8) | 0.261 | 82/153 (34.9/65.1) | < 0.001 |
| APRI (≤ 0.24/> 0.24) | 444/445 (49.9/50.1) | 233/224 (51.0/49.0) | 98/99 (49.7/50.3) | 0.771 | 113/122 (48.1/51.9) | 0.470 |
| ANRI (≤ 12.82/> 12.82) | 480/409 (54.0/46.0) | 240/217 (52.5/47.5) | 107/90 (54.3/45.7) | 0.672 | 133/102 (56.6/43.4) | 0.308 |
| ALRI (≤ 24.41/> 24.41) | 467/422 (52.5/47.5) | 242/215 (53.0/47.0) | 94/103 (47.7/52.3) | 0.219 | 131/104 (55.7/44.3) | 0.486 |
Values are presented as median (interquartile range) or number (%). AST, aspartate aminotransferase; ALT, alanine aminotransferase; GGT, gamma-glutamyl transpeptidase; TBIL, total bilirubin; PT, prothrombin time; INR, international normalized ratio; BCLC, Barcelona Clinic Liver Cancer; NLR, neutrophil to lymphocyte ratio; PLR, platelet to lymphocyte ratio; LMR, lymphocyte to monocyte ratio; GPR, GGT to platelet ratio; SII, systemic immune-inflammation index; PNI, prognostic nutritional index; APRI, AST to platelet ratio index; ANRI, AST to neutrophil ratio index; ALRI, AST to lymphocyte ratio index.


 PDF
PDF Citation
 Print
Print


 XML Download