Abstract
Purpose
The purpose of this study was to investigate the prognostic significance of total metabolic tumor volume (TMTV) and total lesion glycolysis (TLG) in patients with follicular lymphoma (FL) at baseline and mid-treatment with 18F-fluorodeoxyglucose positron emission tomography-computed tomography (PET-CT) scans.
Methods
The study analyzed data from 48 patients with FL who were treated in Jiangsu Province Hospital and reviewed their baseline PET-CT scans. TMTV and TLG were computed by using the absolute value of 2.0, 2.5, and 3.0 thresholding method, respectively.
Results
Median age was 53 years, 75.0% of patients had stage III to IV disease, 43.8% had a Follicular Lymphoma International Prognostic Index 1 (FLIPI1) score of 3 to 5 and 20.8% had a FLIPI2 score of 3 to 5. Receiver operating characteristic (ROC) curve analysis showed the optimal cut-off values for TMTV3.0 and TLG3.0 were 476.4 (sensitivity, 85.7%; specificity, 78.0%; area under the curve [AUC], 0.760; p=0.003) and 2,676.9 (sensitivity, 71.4%; specificity, 78.0%; AUC, 0.760; p=0.003). On multivariable analysis, TMTV3.0 and TLG3.0 were independent predictors of both progression-free survival (PFS) (hazard ratio [HR], 5.406; 95% confidence interval [CI], 1.326 to 22.040; p=0.019 and HR, 6.502; 95% CI, 1.079 to 39.182; p=0.042) and overall survival (OS) (HR, 4.111; 95% CI, 1.125 to 15.027; p=0.033 and HR, 5.885; 95% CI, 1.014 to 34.148; p=0.049). ROC curve analysis showed the optimal cut-off values for ΔTMTV3.0 and ΔTLG3.0 were 66.3% (sensitivity, 85.7%; specificity, 63.4%; AUC, 0.774; p < 0.001) and 64.5% (sensitivity, 85.7%; specificity, 65.9%; AUC, 0.777; p < 0.001).
Follicular lymphoma (FL) is the second most common lymphoma subtype in Europe and United States and the third most frequent non-Hodgkin’s lymphoma subtype after diffuse large B-cell lymphoma (DLBCL) and extranodal NK/T cell lymphoma (ENKTCL) in Aisa [1-5]. Although the using of rituximab combined with chemotherapy improves outcome of patients with FL, 20% of patients treated with immunochemotherapy still have disease progression within short time and 50% of them would die within 5 years [6-8]. The Follicular Lymphoma International Prognostic Index (FLIPI1 and FLIPI2) [9,10] and conventional computed tomo-graphy (CT) cannot identify them easily and quickly. 18F-fluorodeoxyglucose (FDG) positron emission tomography computed tomography scan (PET-CT) not only showed the anatomic location of the lesion but also reflected the level of metabolism. It made the staging, evaluating response and surveillance more accurate. Furthermore, the prognostic value of PET-CT parameter of maximum standardized uptake value (SUVmax) has been validated in DLBCL and Hodgkin’s lymphoma (HL) [11,12].
Recently studies have shown that total metabolic tumor volume (TMTV) and total lesion glycolysis (TLG) may be useful quantitative parameters for the assessment of treatment response in HL, DLBCL, ENKTL, and peripheral T-cell lymphoma [13-19]. Furthermore, date form Meignan et al. [20] also shown that baseline TMTV has strong independent predictive value for high-tumor-burden FL patients. However, the prognostic value of baseline TMTV and TLG using different absolute value thresholding method has not validated in patients form other cohort such as in Asian population and the prognostic value of interim TMTV and TLG has not yet been established in FL patients.
In this study, we attempted to determine whether PET parameters (TMTV and TLG) measured on pretreatment and interim PET-CT using the absolute value of 2.0, 2.5, and 3.0 thresholding method respectively, can predict prognosis in patients with FL in Asia.
Between August 2009 and June 2016, 48 consecutive subjects with newly-diagnosed FL had a pretreatment 18F-FDG PET-CT scan at our center. Diagnosis was based on the World Health Organization lymphoma classification [20,21]. Among these 48 patients, there are 22 patients had a 18F-FDG PET-CT scan for response assessment after 3-4 cycles of treatments. The scores of FLIPI1 and FLIPI2 and the times of progression-free survival (PFS) and overall survival (OS) were calculated according to revised response criteria for malignant lymphoma [22,23]. Treatment options were recommended according to National Comprehensive Cancer Network (NCCN).
PET-CT studies were obtained on the following PET-CT devices: Gemini TF64 (Philips, Best, Netherlands), Gemini GXL (Philips, Eindhoven, Netherlands), Gemini TF16 (Philips, Eindhoven, Netherlands), Discovery LS (GE Healthcare, Milwaukee, WI), and Biograph TP16 (Siemens, Erlangen, Germany). Subjects with fasting serum glucose < 7.0 mmol/L received 18F-FDG 3.70-5.55 MBq/kg intrave-nously for > 6 hours. After 60-minute whole-body PET-CT imaging was performed with a whole-body CT scan (120 KV and 140 mA) and a whole-body PET (in 3-dimensional mode, 120 sec/bed position). Acquisition of CT, PET, and PET-CT fusion images including cross-section, sagittal-section and coronal-section used CT-based attenuation correction in reconstruction image by an iterative method.
PET-CT studies were obtained on the following PET-CT devices: Gemini TF64 (Philips, Best, Netherlands), Gemini GXL (Philips, Eindhoven, Netherlands), Gemini TF16 (Philips, Eindhoven, Netherlands), Discovery LS (GE Healthcare, Milwaukee, WI), and Biograph TP16 (Siemens, Erlangen, Germany). Subjects with fasting serum glucose < 7.0 mmol/L received 18F-FDG 3.70-5.55 MBq/kg intrave-nously for > 6 hours. After 60-minute whole-body PET-CT imaging was performed with a whole-body CT scan (120 KV and 140 mA) and a whole-body PET (in 3-dimensional mode, 120s/bed position). Acquisition of CT, PET, and PET-CT fusion images including cross-section, sagittal-section and coronal-section used CT-based attenuation correction in reconstruction image by an iterative method.All scans were re-examined by two experienced radiologists who were unaware of both clinical and radiological findings of FL. Lesion sites were determined according to visual assessment with PET images scaled to color table and a fixed SUV by two experienced nuclear medicine physicians [24]. The workstation automatically calculated SUVmax with drawing the region of interest along the edge of the enrichment spot. The absolute value of 2.0, 2.5, and 3.0 threshold methods were used for the metabolic tumor volume (MTVL) /glycolysis of any local lesion (LGL) computations through the MEDEX software. They were recorded as MTVL2.0/LGL2.0, MTVL2.5/LGL2.5, and MTVL3.0/LGL3.0, respectively. TMTV2.0/TLG2.0, TMTV2.5/TLG2.5, and TMT-V3.0/TLG3.0 were obtained by summing MTVL2.0/LGL2.0, MTVL2.5/LGL2.5, and MTVL3.0/LGL3.0 of all local lesions respectively. Bone marrow (BM) and spleen with diffuse uptake were generally excluded in the lesions unless there was focal uptake. Spleen was also considered as involved if there was diffuse uptake increased more than 150% of the liver background.
For interim scans, we recorded the changes in TMTV and TLG, which were defined as ΔTMTV3.0 and ΔTLG3.0 and ΔTMTV3.0 and ΔTLG3.0 were calculated as
We used the Epidata 3.10 to establish datasets and verify validity of data-entry twice. The discriminative ability of the PET-CT parameters (SUVmax, TMTV, and TLG) was determined according to the time-dependent receiver operating characteristic (ROC) curves and the corresponding area under the curve (AUC) were calculated to assess the predictive accuracy of the model [25]. The difference of AUCs was tested by a non-parametric approach developed by DeLong et al. [26]. Survival curves were constructed by the Kaplan-Meier method. Log-rank test was used to compare survival time of different groups categorized by the selected best predictive model. Prognostic significances of PET parameter and clinical variables were assessed by univariate analyses. Variables with significant associations were included in multivariate Cox proportional hazards regression analyses. All the statistical analyses used STATA statistical software (ver. 11.1, StataCorp., College Station, TX) and R software (ver. 3.2.1, The R Foundation for Statistical Computing, Vienna, Austria). Two-sided p ≤ 0.05 was considered significant.
The study was approved by the Ethics Committee of the First Affiliated Hospital of Nanjing Medical University and done according to the guidelines of Nanjing Medical University. Subjects provided informed consent in accordance with requirements of the Declaration of Helsinki. Subjects provided informed consent in accordance with requirements of the Declaration of Helsinki.
Clinical variables are outlined in Table 1. Thirty-seven subjects were male. Median age was 53 years (range, 30 to 83 years). Thirty-six (75.0%) were Ann Arbor stage III/IV and 31 subjects were grade 1-2. There were 23 patients with BM involvements. Twenty-one patients (43.8%) were estimated as FLIPI1 score of 3-5 while 10 patients (20.8%) were FLIPI2 score of 3-5. Three patients received radiotherapy only, five patients didn’t receive treatment due to no indications, 38 patients received immunochemotherapy with rituximab, cyclophosphamide, epirubicin, vindesine, and prednisone (R-CHOP), two patients received rituximab alone. Median follow-up is 35 months (range, 16 to 98 months).
Baseline characteristics of the 48 FL patients
Median value of baseline SUVmax, TMTV2.0, TMTV2.5, TMTV3.0, TLG2.0, TLG2.5, and TLG3.0 were shown in Table 2. We evaluated the predictive accuracy of these models in time-dependent ROC curves which showed optimal cut-off values for SUVmax, TMTV2.0, TMTV2.5, TMTV3.0, TLG2.0, TLG2.5, and TLG3.0 of 7.0 (sensitivity, 85.7%; specificity, 46.3%; AUC, 0.650; p=0.141), 505.5 (sensitivity, 85.7%; specificity, 63.4%; AUC, 0.774; p < 0.001), 391.2 (sensitivity, 85.7%; specificity, 65.9%; AUC, 0.777; p < 0.001), 476.4 (sensitivity, 85.7%; specificity, 78.0%; AUC, 0.760; p=0.003), 3,259.7 (sensitivity, 71.4%; specificity, 75.6%; AUC, 0.763; p=0.002), 3,080.0 (sensitivity, 71.4%; specificity, 78.0%; AUC, 0.770; p=0.001), and 2,676.9 (sensitivity, 71.4%; specificity, 78.0%; AUC, 0.760; p=0.003).
Quantity and optimal cut-off value for OS of PET-CT parameters of PET-CT of 48 patients with FL
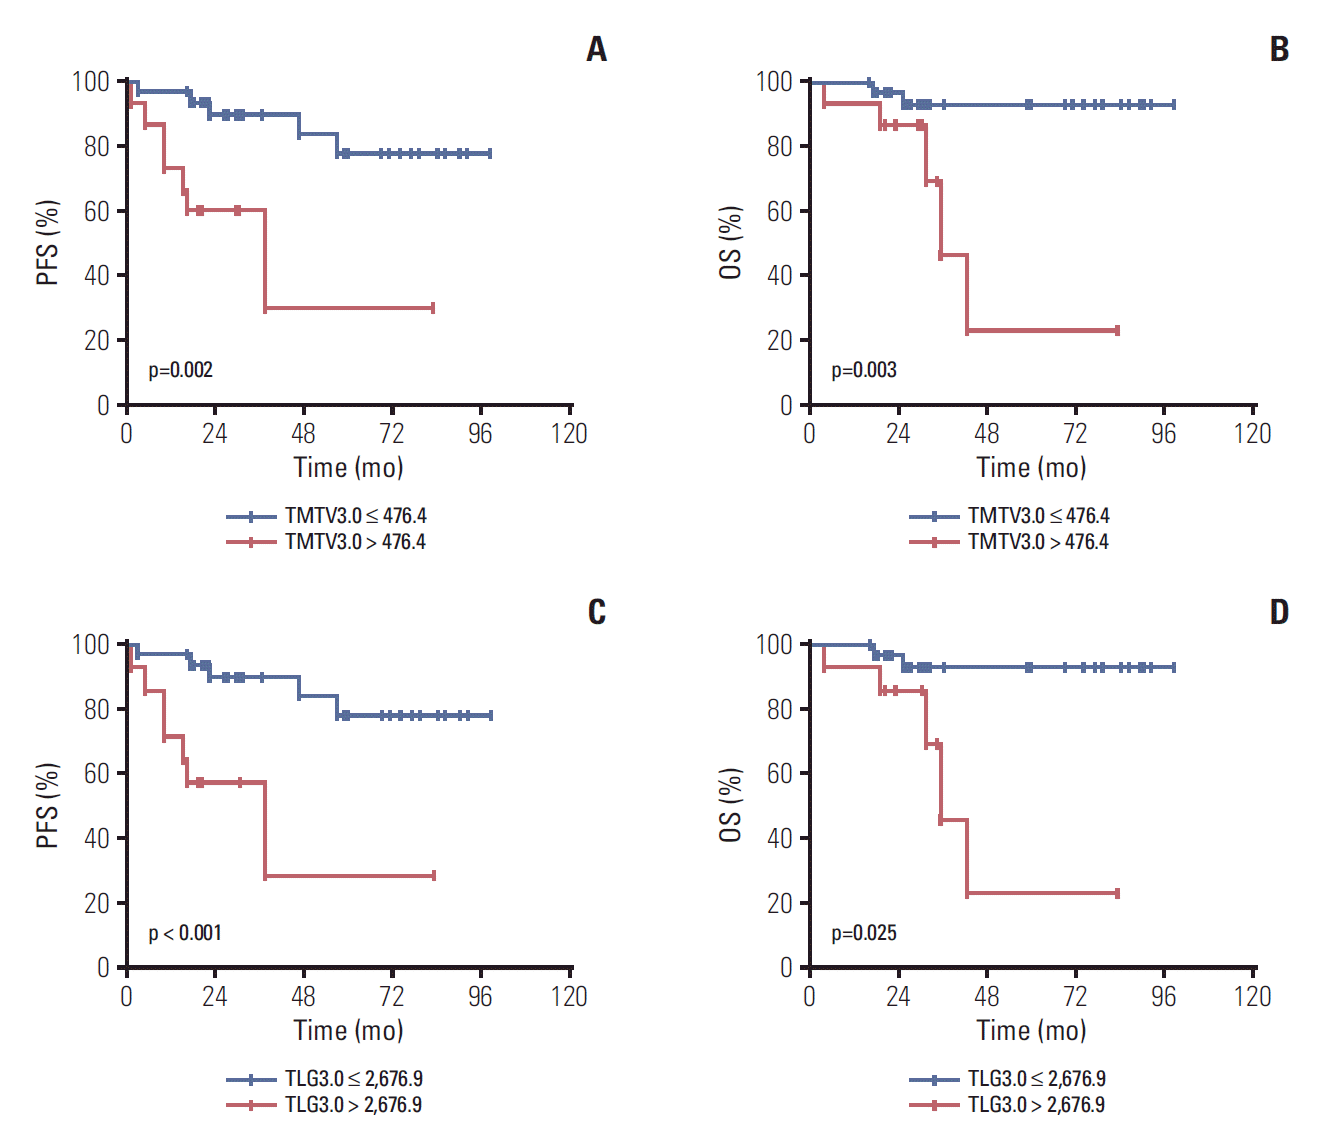
Pair-wise comparisons of ROC curves in the models are also conducted. There were no significant differences among TMTV2.0, 2.5, and 3.0 (p > 0.05) and also no significant differences were observed among TLG2.0, 2.5, and 3.0 (p > 0.05). Taking sensitivity, specificity and AUC into consideration, we selected TMTV3.0 and TLG3.0 for further analyses. Kaplan-Meier PFS and OS cures for the TMTV3.0 (476.4) and TLG3.0 (2,676.9) using the optimal cut-off value are shown in Fig. 1.
By univariate analysis (Table 3), we found that BM involvement, FLIPI2 score of 3-5, TLG3.0 > 2,676.9 and TMTV3.0 > 476.4 were both significantly associated with inferior PFS and OS in our cohort. Furthermore, we found that the two PET-CT parameters of TLG3.0 > 2,676.9 and TMTV3.0 > 476.4 were significantly related to each other (r=0.952, p < 0.001). Therefore, the two PET-CT parameters were entered into multivariate analysis with other clinical variables respectively (Table 4). And we found that both TLG3.0 > 2,676.9 and TMTV3.0 > 476.4 were significantly related to PFS (hazard ratio [HR], 6.502; 95% confidence interval [CI], 1.079 to 39.182; p=0.042 and HR, 5.406; 95% CI, 1.326 to 22.040; p=0.019) and OS (HR, 5.885; 95% CI, 1.014 to 34.148; p=0.049 and HR, 4.111; 95% CI, 1.125 to 15.027; p=0.033).
Univariate analysis for PFS and OS
Multivariate analysis of TLG and TMTV after adjusting for FLIPI score
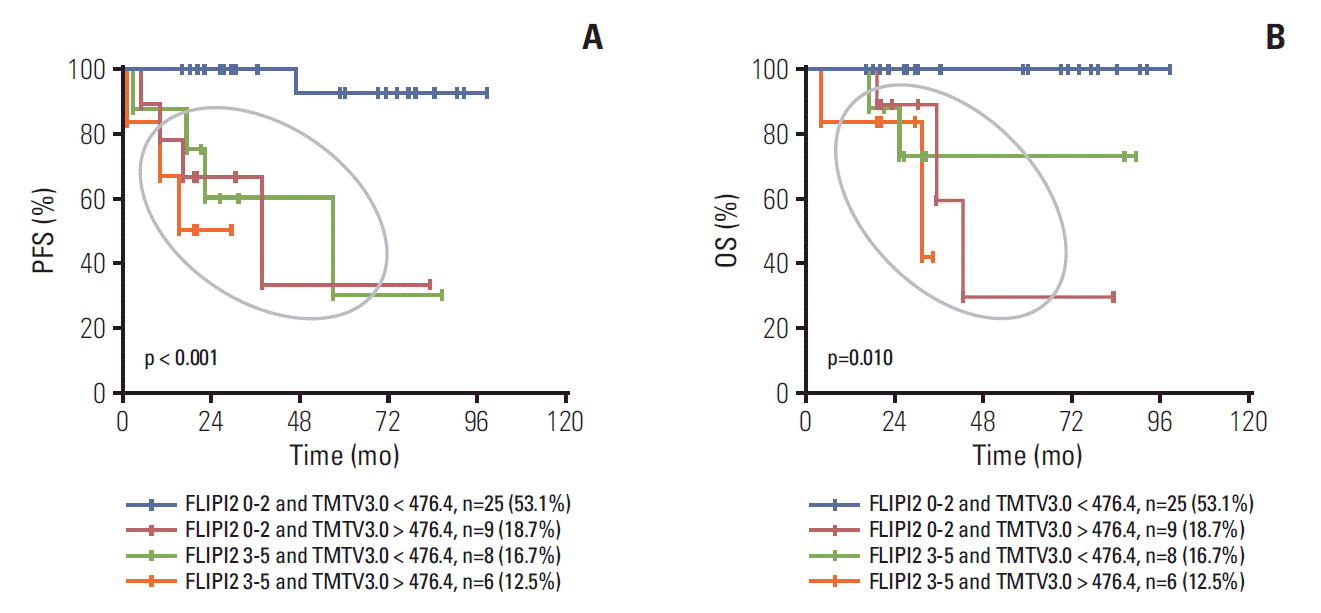
To further analyze the prognosis of TMTV3.0 combined with conventional prognosis indices of FLIPI2, patients can divide into four subgroups: (1) FLIPI2 0-2 and TMTV3.0 < 476.4 group: 25 patients (53.1%); (2) FLIPI2 0-2 and TMTV3.0 > 476.4 group: nine patients (18.7%); (3) FLIPI2 3-5 and TMTV3.0 < 476.4 group: eight patients (16.7%); (4) FLIPI2 3-5 and TMTV3.0 > 476.4 group: six patients (12.5%) (S1 Table). We found that patients with both FLIPI2 0-2 and TMTV3.0 < 476.4 has the superior PFS (p < 0.001) and OS (p=0.010) then other three groups while no significant differences of PFS and OS were observed among the other three groups (Fig. 2).
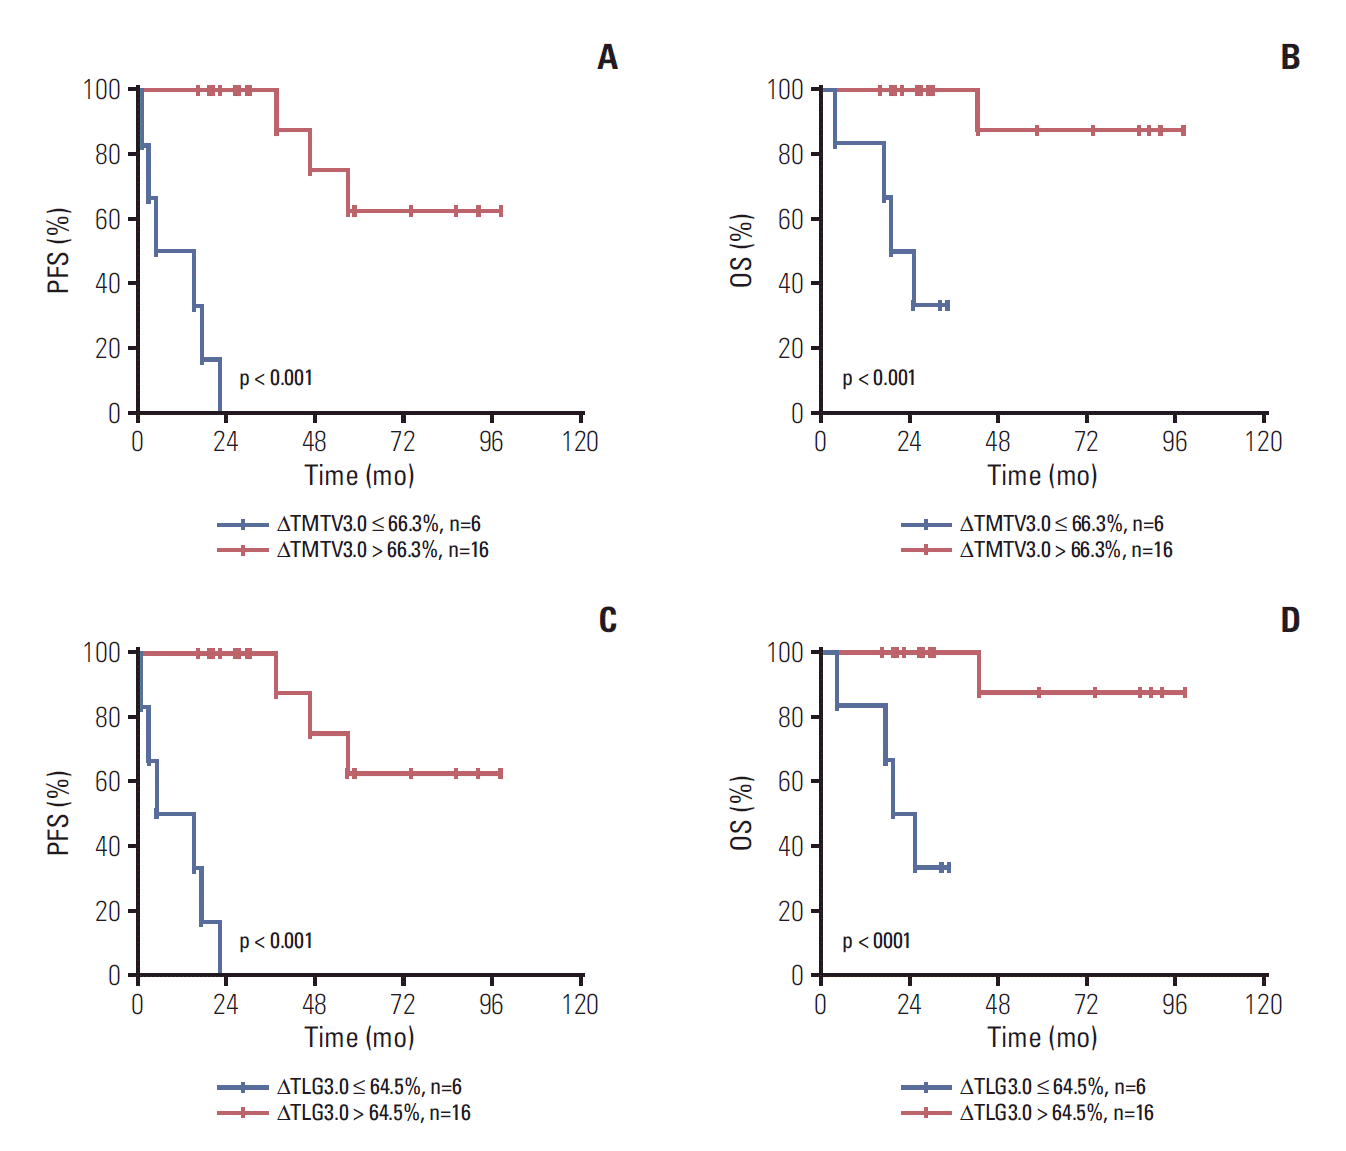
Twenty-two patients underwent 18F-FDG PET-CT scans after 3-4 cycles of immunochemotherapy. The changes between baseline parameter and interim PET-CT parameters (defined as ΔTMTV3.0 and ΔTLG3.0) of every patient were calculated. We evaluated the predictive accuracy of ΔTMTV3.0 and ΔTLG3.0 in time-dependent ROC curves which showed optimal cut-off values for ΔTMTV3.0 and ΔTLG3.0 of 66.3% (sensitivity, 85.7%; specificity, 63.4%; AUC, 0.774; p < 0.001) and 64.5% (sensitivity, 85.7%; specificity, 65.9%; AUC, 0.777; p < 0.001). Kaplan-Meier PFS and OS cures for the ΔTMTV3.0 (66.3%) and ΔTLG3.0 (64.5%) using the optimal cut-off value are shown in Fig. 3.
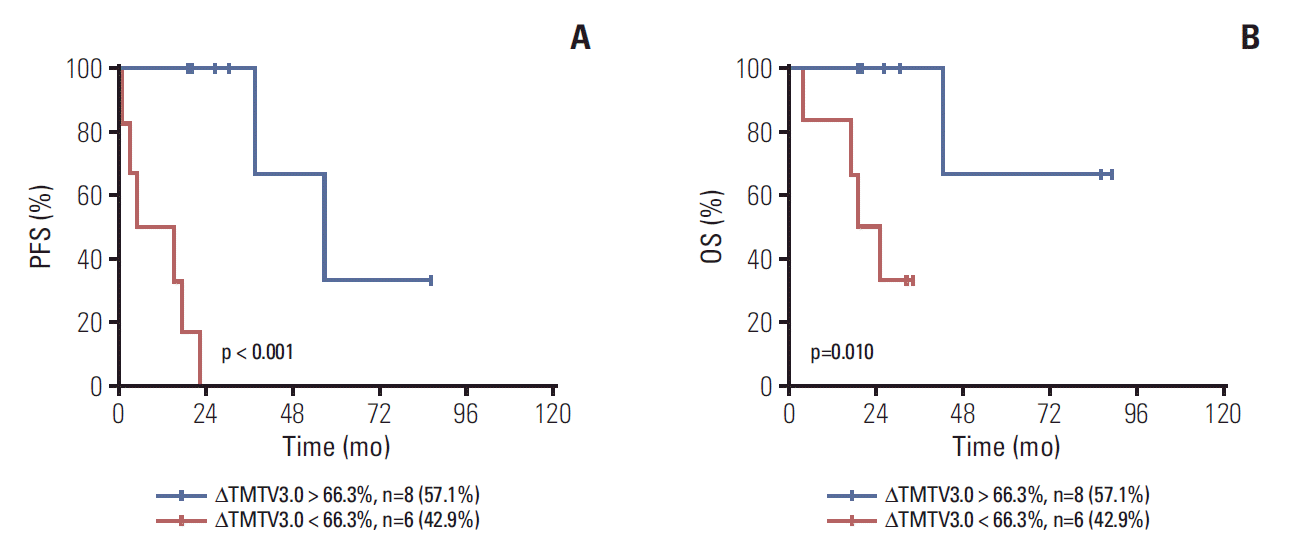
Among the 24 patients with interim PET-CT scan, we found that patients (n=10) with baseline TMTV3.0 < 476.4 and FLIPI2 0-2 were all with ΔTMTV3.0 > 66.3% while there were only six patients with ΔTMTV3.0 > 66.3% out of the 14 patients with either TMTV3.0 > 476.4 or FLIPI2 3-5 (S2 Table). Furthermore, for these patients with either TMTV3.0 > 476.4 or FLIPI2 3-5, patients with ΔTMTV3.0 > 66.3% had superior PFS and OS (Fig. 4).
The prognostic value of PET-CT parameters (SUVmax, TMTV, and TLG) has been investigated in different various subtypes of lymphoma, such as HL, DLBCL, and ENKTCL [12-17,24,27]. Recently, a pooled analysis of 185 patients with high-tumor-burden FL reported that baseline TMTV was independent predictor of PFS. It could identify patients with high risk of early progression and help to guide clinicians to adjust treatments [20]. In the present study, we also investigated the prognostic value of TMTV and TLG at pretreatment and mid-treatment using different absolute threshold in our cohort. We found that both baseline TMTV3.0 and TLG3.0 were independent risk factors of PFS and OS for patients with FL. Furthermore, patients with ΔTMTV3.0 > 66.3% and ΔTLG3.0 > 64.5% have superior PFS and OS for the 24 patients whose interim PET-CT scans were available.
Similar to the report by Meignan et al. [20], we also found that not only baseline TMTV3.0, but also TLG3.0 which were not evaluated in other study, were independent risk factors for FL patients. Further analysis showed that the PET-CT parameter of TMTV3.0 can add the risk-stratification capacity of FLIPI2. For patients with FLIPI 0-2, there were nearly 20% patients with higher TMTV3.0. Actually, these patients might have inferior survivals instead of superior survivals if according to the risk-stratification of FLIPI2 only. Therefore, from our data, we can conclude that patients with any one of the two risk factors (FLIPI2 3-5 or TMTV3.0 > 476.4) had inferior survivals.
In some cases, TMTV was measured by applying a fixed 41% SUVmax threshold to every lymphoma lesion [14,20]. Considering the SUVmax of inert lymphomas generally is smaller, it is easy to include some reactive lymph nodes and/or some inflammatory lesions into tumor lesions by 41% SUVmax threshold. In this paper TMTV and TLG are computed using absolute values (2.0, 2.5, and 3.0) as the threshold [28,29]. Actually, ROC curves showed that there were no differences among the three absolute values for TMTV and TLG. Larger cohorts should be included to compare the prognostic value of TMTV and TLG in different absolute threshold.
Furthermore, the prognostic value of TMTV and TLG at mid-treatment was first to be evaluated in the present study. We found that ΔTMTV3.0 using a cut-off of 66.3% and ΔTLG3.0 using a cut-off of 64.5% had predictive value in predicting outcome after four cycles of therapy in FL patients. That is to say patients who were with higher TMTV3.0 and TLG3.0 at baseline can also achieve superior outcomes if ΔTMTV3.0 > 66.3% and ΔTLG3.0 > 64.5% after four cycles of immunechemotherapy. Therefore, more intensive immunechemotherapy might be considered for these patients in our clinical practice. Because our patients who were available for PET-CT assessment at mid-treatment were small, our conclusion should be tested in other datesets.
In conclusion, baseline TMTV and TLG are independent predictors of PFS and OS for patients with FL. Also, mid-treatment TMTV and TLG are valuable tools for early treatment response assessment in FL patients. Further larger prospective studies are worth performing to validate our conclusions.
Electronic Supplementary Material
Supplementary materials are available at Cancer Research and Treatment website (https://www.e-crt.org).
S1 Table.
The distribution of 48 FL patients according to baseline TMTV status and FLIPI2 score
S2 Table.
The distribution of 24 FL patients according to interim TMTV status and FLIPI2 score
ACKNOWLEDGMENTS
This study was supported by National Natural Science Foundation of China (81370657, 81470328, 81500125, 81522001, 81570141), Project of National Key Clinical Specialty, the National Science & Technology Pillar Program (2014BAI09B12), and a project funded by Jiangsu Provincial Special Program of Medical Science (BL2014-086) and National Science and Technology Major Project (2017ZX-09304032).
References
1. Smith A, Crouch S, Lax S, Li J, Painter D, Howell D, et al. Lymphoma incidence, survival and prevalence 2004-2014: sub-type analyses from the UK's Haematological Malignancy Research Network. Br J Cancer. 2015; 112:1575–84.

2. The World Health Organization classification of malignant lymphomas in japan: incidence of recently recognized entities. Lymphoma Study Group of Japanese Pathologists. Pathol Int. 2000; 50:696–702.
3. Chen CY, Yao M, Tang JL, Tsay W, Wang CC, Chou WC, et al. Chromosomal abnormalities of 200 Chinese patients with non-Hodgkin's lymphoma in Taiwan: with special reference to T-cell lymphoma. Ann Oncol. 2004; 15:1091–6.

4. Au WY, Ma SY, Chim CS, Choy C, Loong F, Lie AK, et al. Clinicopathologic features and treatment outcome of mature T-cell and natural killer-cell lymphomas diagnosed according to the World Health Organization classification scheme: a single center experience of 10 years. Ann Oncol. 2005; 16:206–14.

5. Takeuchi M, Sato Y, Yoshino T. The frequency of malignant lymphoma subtypes based on World Health Organization (WHO) classification. Nihon Rinsho. 2014; 72:436–40.
6. Federico M, Luminari S, Dondi A, Tucci A, Vitolo U, Rigacci L, et al. R-CVP versus R-CHOP versus R-FM for the initial treatment of patients with advanced-stage follicular lymphoma: results of the FOLL05 trial conducted by the Fondazione Italiana Linfomi. J Clin Oncol. 2013; 31:1506–13.

7. Casulo C, Day B, Dawson KL, Zhou X, Flowers CR, Farber CM, et al. Disease characteristics, treatment patterns, and outcomes of follicular lymphoma in patients 40 years of age and younger: an analysis from the National Lymphocare Study-dagger. Ann Oncol. 2015; 26:2311–7.
8. Casulo C, Byrtek M, Dawson KL, Zhou X, Farber CM, Flowers CR, et al. Early relapse of follicular lymphoma after rituximab plus cyclophosphamide, doxorubicin, vincristine, and prednisone defines patients at high risk for death: an analysis from the National LymphoCare Study. J Clin Oncol. 2015; 33:2516–22.

9. Solal-Celigny P, Roy P, Colombat P, White J, Armitage JO, Arranz-Saez R, et al. Follicular lymphoma international prognostic index. Blood. 2004; 104:1258–65.

10. Federico M, Bellei M, Marcheselli L, Luminari S, LopezGuillermo A, Vitolo U, et al. Follicular lymphoma international prognostic index 2: a new prognostic index for follicular lymphoma developed by the international follicular lymphoma prognostic factor project. J Clin Oncol. 2009; 27:4555–62.

11. Cheson BD, Fisher RI, Barrington SF, Cavalli F, Schwartz LH, Zucca E, et al. Recommendations for initial evaluation, staging, and response assessment of Hodgkin and non-Hodgkin lymphoma: the Lugano classification. J Clin Oncol. 2014; 32:3059–68.

12. Barrington SF, Mikhaeel NG, Kostakoglu L, Meignan M, Hutchings M, Mueller SP, et al. Role of imaging in the staging and response assessment of lymphoma: consensus of the International Conference on Malignant Lymphomas Imaging Working Group. J Clin Oncol. 2014; 32:3048–58.

13. Esfahani SA, Heidari P, Halpern EF, Hochberg EP, Palmer EL, Mahmood U. Baseline total lesion glycolysis measured with (18)F-FDG PET/CT as a predictor of progression-free survival in diffuse large B-cell lymphoma: a pilot study. Am J Nucl Med Mol Imaging. 2013; 3:272–81.
14. Meignan M, Sasanelli M, Casasnovas RO, Luminari S, Fioroni F, Coriani C, et al. Metabolic tumour volumes measured at staging in lymphoma: methodological evaluation on phantom experiments and patients. Eur J Nucl Med Mol Imaging. 2014; 41:1113–22.

15. Sasanelli M, Meignan M, Haioun C, Berriolo-Riedinger A, Casasnovas RO, Biggi A, et al. Pretherapy metabolic tumour volume is an independent predictor of outcome in patients with diffuse large B-cell lymphoma. Eur J Nucl Med Mol Imaging. 2014; 41:2017–22.

16. Cottereau AS, Lanic H, Mareschal S, Meignan M, Vera P, Tilly H, et al. Molecular profile and FDG-PET/CT total metabolic tumor volume improve risk classification at diagnosis for patients with diffuse large B-cell lymphoma. Clin Cancer Res. 2016; 22:3801–9.

17. Cottereau AS, Hapdey S, Chartier L, Modzelewski R, Casasnovas O, Itti E, et al. Baseline total metabolic tumor volume measured with fixed or different adaptive thresholding methods equally predicts outcome in peripheral T cell lymphoma. J Nucl Med. 2017; 58:276–81.

18. Cheson BD, Kostakoglu L. FDG-PET for early response assessment in lymphomas: part 1-Hodgkin lymphoma. Oncology (Williston Park). 2017; 31:45–9.
19. Cheson BD, Kostakoglu L. FDG-PET for early response assessment in lymphomas: part 2-diffuse large B-cell lymphoma, use of quantitative PET evaluation. Oncology (Williston Park). 2017; 31:71–6.
20. Meignan M, Cottereau AS, Versari A, Chartier L, Dupuis J, Boussetta S, et al. Baseline metabolic tumor volume predicts outcome in high-tumor-burden follicular lymphoma: a pooled analysis of three multicenter studies. J Clin Oncol. 2016; 34:3618–26.

21. Sabattini E, Bacci F, Sagramoso C, Pileri SA. WHO classification of tumours of haematopoietic and lymphoid tissues in 2008: an overview. Pathologica. 2010; 102:83–7.
22. Tohda S. Overview of lymphoid neoplasms in the fourth edition of the WHO classification. Rinsho Byori. 2012; 60:560–4.
23. Cheson BD, Pfistner B, Juweid ME, Gascoyne RD, Specht L, Horning SJ, et al. Revised response criteria for malignant lymphoma. J Clin Oncol. 2007; 25:579–86.

24. Juweid ME, Stroobants S, Hoekstra OS, Mottaghy FM, Dietlein M, Guermazi A, et al. Use of positron emission tomography for response assessment of lymphoma: consensus of the Imaging Subcommittee of International Harmonization Project in Lymphoma. J Clin Oncol. 2007; 25:571–8.

25. Heagerty PJ, Lumley T, Pepe MS. Time-dependent ROC curves for censored survival data and a diagnostic marker. Biometrics. 2000; 56:337–44.

26. DeLong ER, DeLong DM, Clarke-Pearson DL. Comparing the areas under two or more correlated receiver operating characteristic curves: a nonparametric approach. Biometrics. 1988; 44:837–45.

27. Kim CY, Hong CM, Kim DH, Son SH, Jeong SY, Lee SW, et al. Prognostic value of whole-body metabolic tumour volume and total lesion glycolysis measured on 18F-FDG PET/CT in patients with extranodal NK/T-cell lymphoma. Eur J Nucl Med Mol Imaging. 2013; 40:1321–9.


 PDF
PDF Citation
 Print
Print


 XML Download