Introduction
Materials and Methods
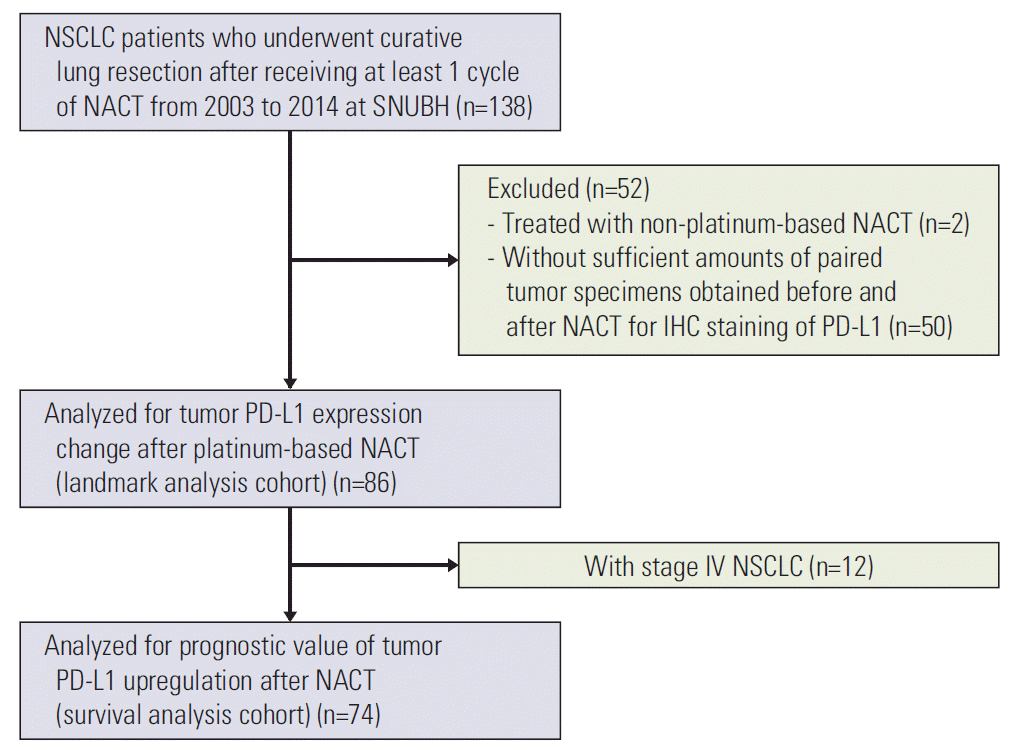
1. Patient eligibility and data collection
2. Immunohistochemical staining for PD-L1
3. Statistical analysis
4. Ethical statement
Results
1. Patient characteristics
Table 1.
| Characteristic | Landmark analysis cohort (n=86) | Survival analysis cohort (n=74) |
|---|---|---|
| Age at surgery (yr) | 62 (37-79) | 62 (37-79) |
| Sex | ||
| Male | 70 (81.4) | 63 (85.1) |
| Female | 16 (18.6) | 11 (14.9) |
| Smoking history | ||
| Never-smoker | 11 (12.8) | 7 (9.5) |
| Current or former smoker | 75 (87.2) | 67 (90.5) |
| Histologic diagnosis | ||
| Adenocarcinoma | 27 (31.4) | 17 (23.0) |
| Squamous cell carcinoma | 53 (61.6) | 51 (68.9) |
| Othersa) | 6 (7.0) | 6 (8.1) |
| Pretreatment clinical stage | ||
| I-II | 22 (25.6) | 22 (29.7) |
| IIIA | 40 (46.5) | 40 (54.1) |
| IIIB | 12 (14.0) | 12 (16.2) |
| IV | 12 (14.0)b) | 0 |
| Pathologic T category | ||
| ypT1-2 | 57 (66.3) | 48 (64.9) |
| ypT3-4 | 29 (33.7) | 26 (35.1) |
| Pathologic N category | ||
| ypN0 | 24 (27.9) | 23 (31.1) |
| ypN1-3 | 62 (72.1) | 51 (68.9) |
| Neoadjuvant treatment category | ||
| NACT only | 81 (94.2) | 70 (94.6) |
| Chemoradiation (sequential or concurrent) | 5 (5.8) | 4 (5.4) |
| NACT regimen | ||
| Gemcitabine plus platinum | 58 (67.4) | 52 (70.3) |
| Taxane plus platinum | 24 (27.9) | 21 (28.4) |
| Othersc) | 4 (4.7) | 1 (1.4) |
| Best objective response to NACT | ||
| PR | 45 (52.3) | 42 (56.8) |
| SD | 41 (47.7) | 32 (43.2) |
Values are presented as median (range) or number (%). NACT, neoadjuvant chemotherapy; PR, partial response; SD, stable disease.
a) Other histologic subtypes include large cell carcinoma (n=3), adenosquamous carcinoma (n=1), pleomorphic carcinoma (n=1), and sarcomatoid carcinoma (n=1),
2. Change in tumor PD-L1 expression following platinumbased NACT
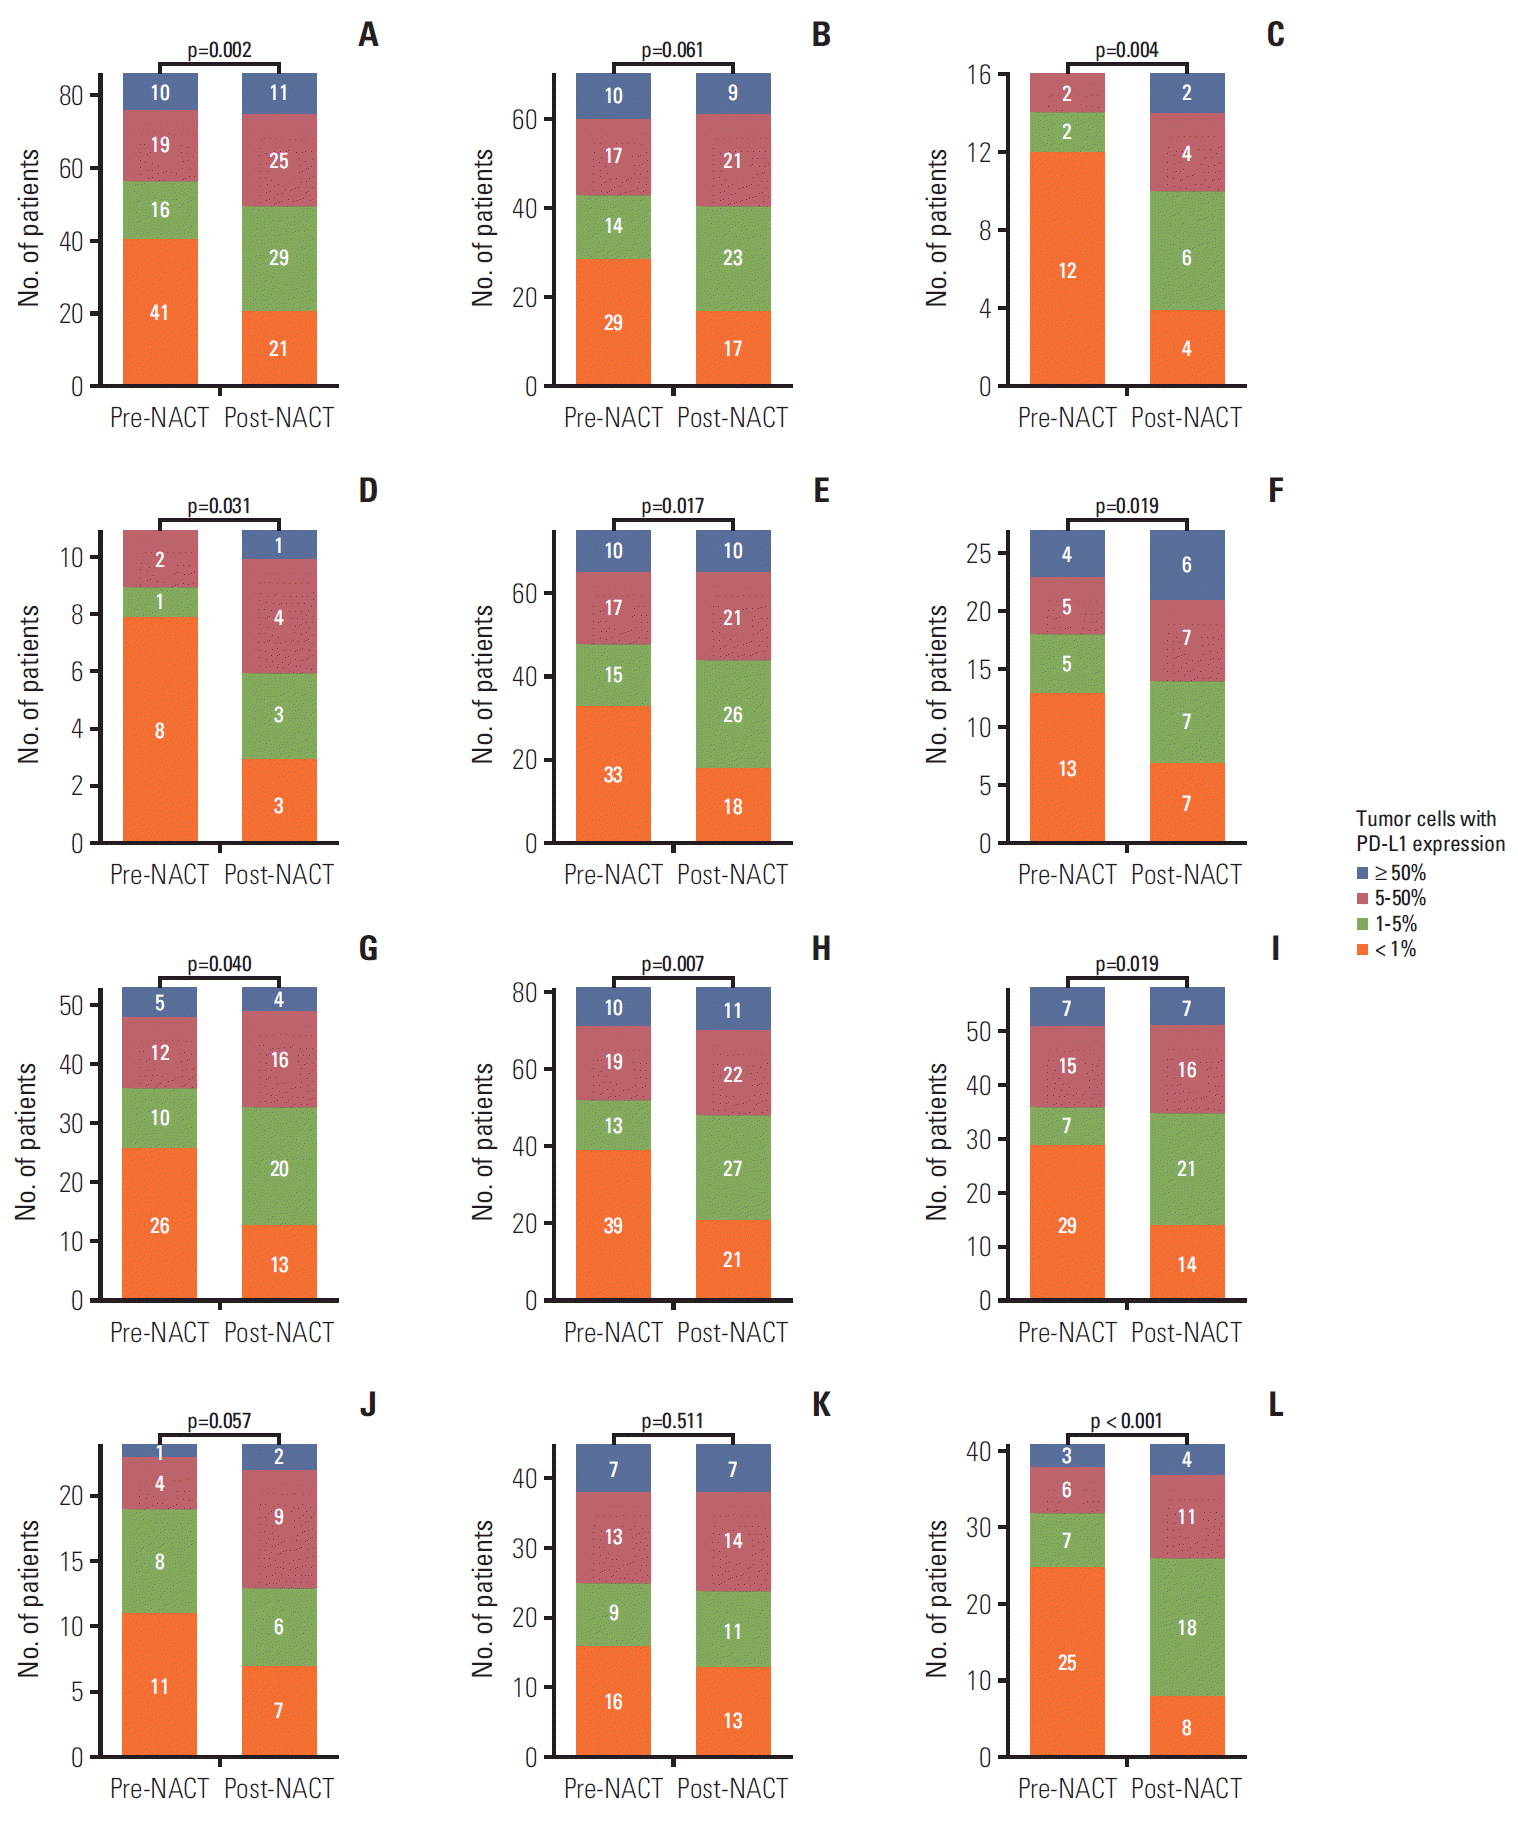 | Fig. 2.Distribution of programmed death ligand 1 (PD-L1) tumor proportion score before and after neoadjuvant chemotherapy (NACT) in the landmark analysis cohort (A). Subgroup analyses of males (B), females (C), never-smokers (D), current or former smokers (E), adenocarcinoma (F), squamous cell carcinoma (G), patients who received NACT without radiotherapy (H), gemcitabine-platinum (I), taxane-platinum (J), patients with partial response to NACT (K), and patients with stable disease (L). Numbers in bar plots indicate the number of patients included in each PD-L1 tumor proportion score category. |
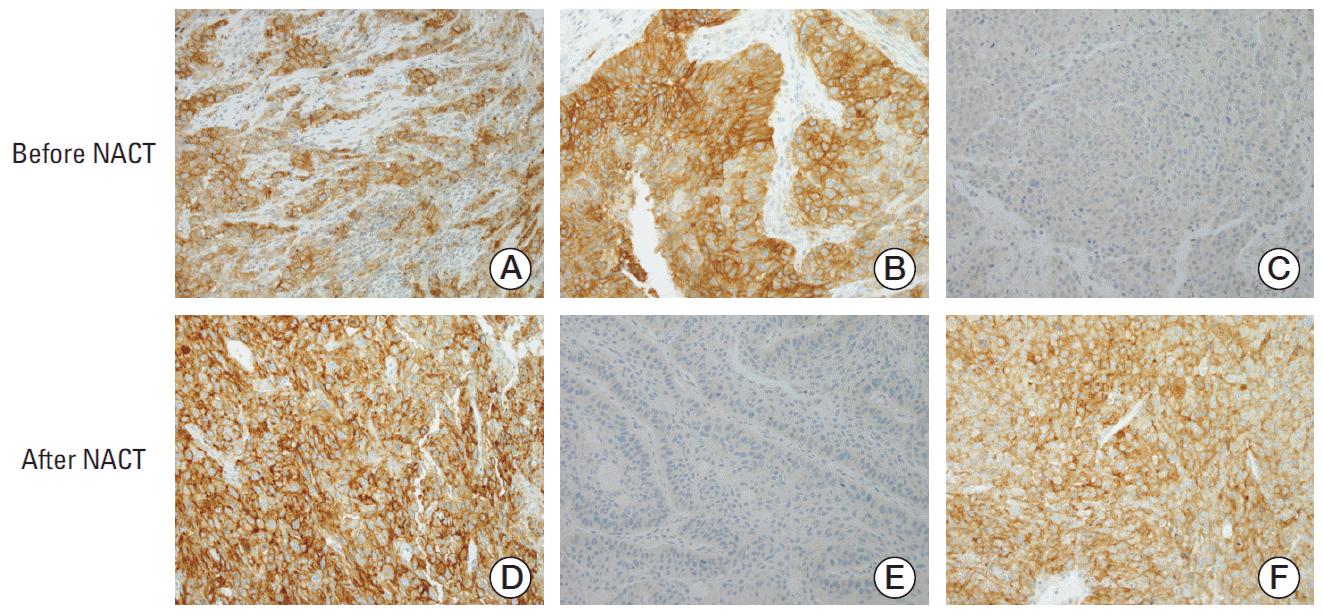 | Fig. 3.Representative immunohistochemical staining patterns of programmed death ligand 1 (PD-L1) in tumor specimens. (A, D) PD-L1 tumor proportion score ≥ 50% before (A) and after (D) neoadjuvant chemotherapy (NACT). (B, E) PD-L1 tumor proportion score ≥ 50% before (B) and < 1% after (E) NACT. (C, F) PD-L1 tumor proportion score < 1% before (C) and ≥ 50% after (F) NACT (A-F, ×200). |
Table 2.
3. Prognostic impact of tumor PD-L1 upregulation following platinum-based NACT
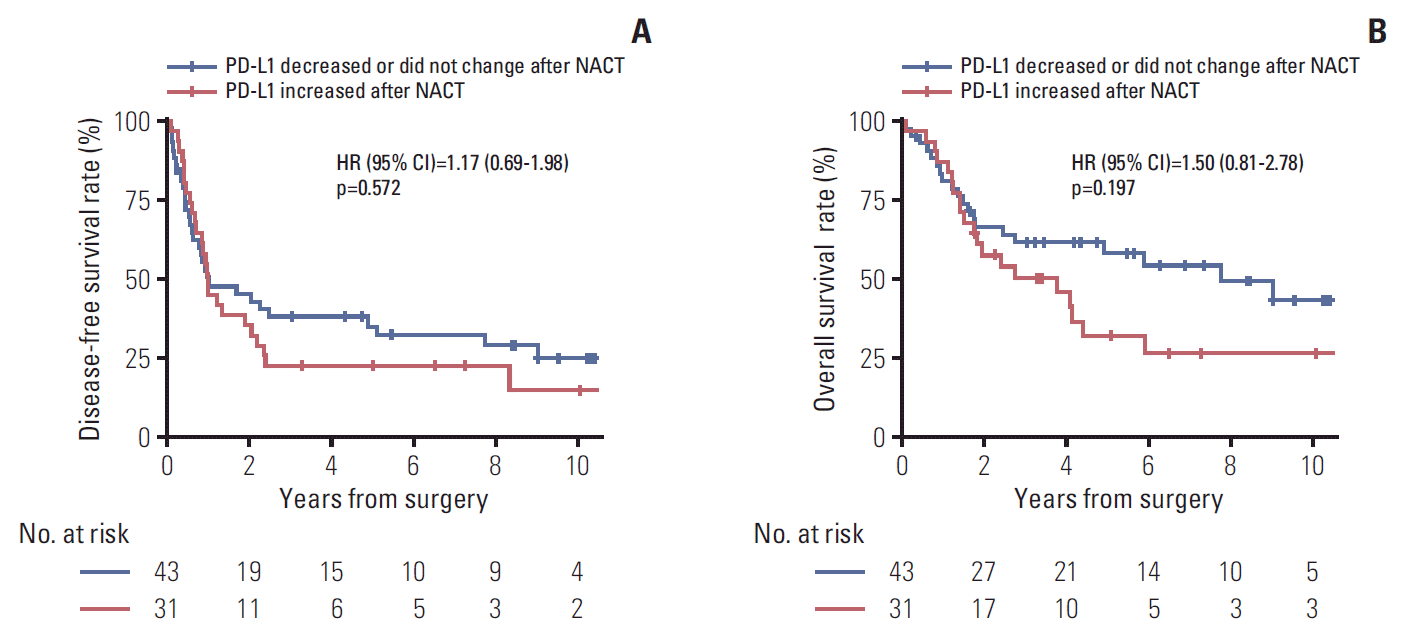 | Fig. 4.Disease-free survival (A) and overall survival (B) according to the direction of change in programmed death ligand 1 (PD-L1) tumor proportion score following platinum-based neoadjuvant chemotherapy (NACT). HR, hazard ratio; CI, confidence interval. |
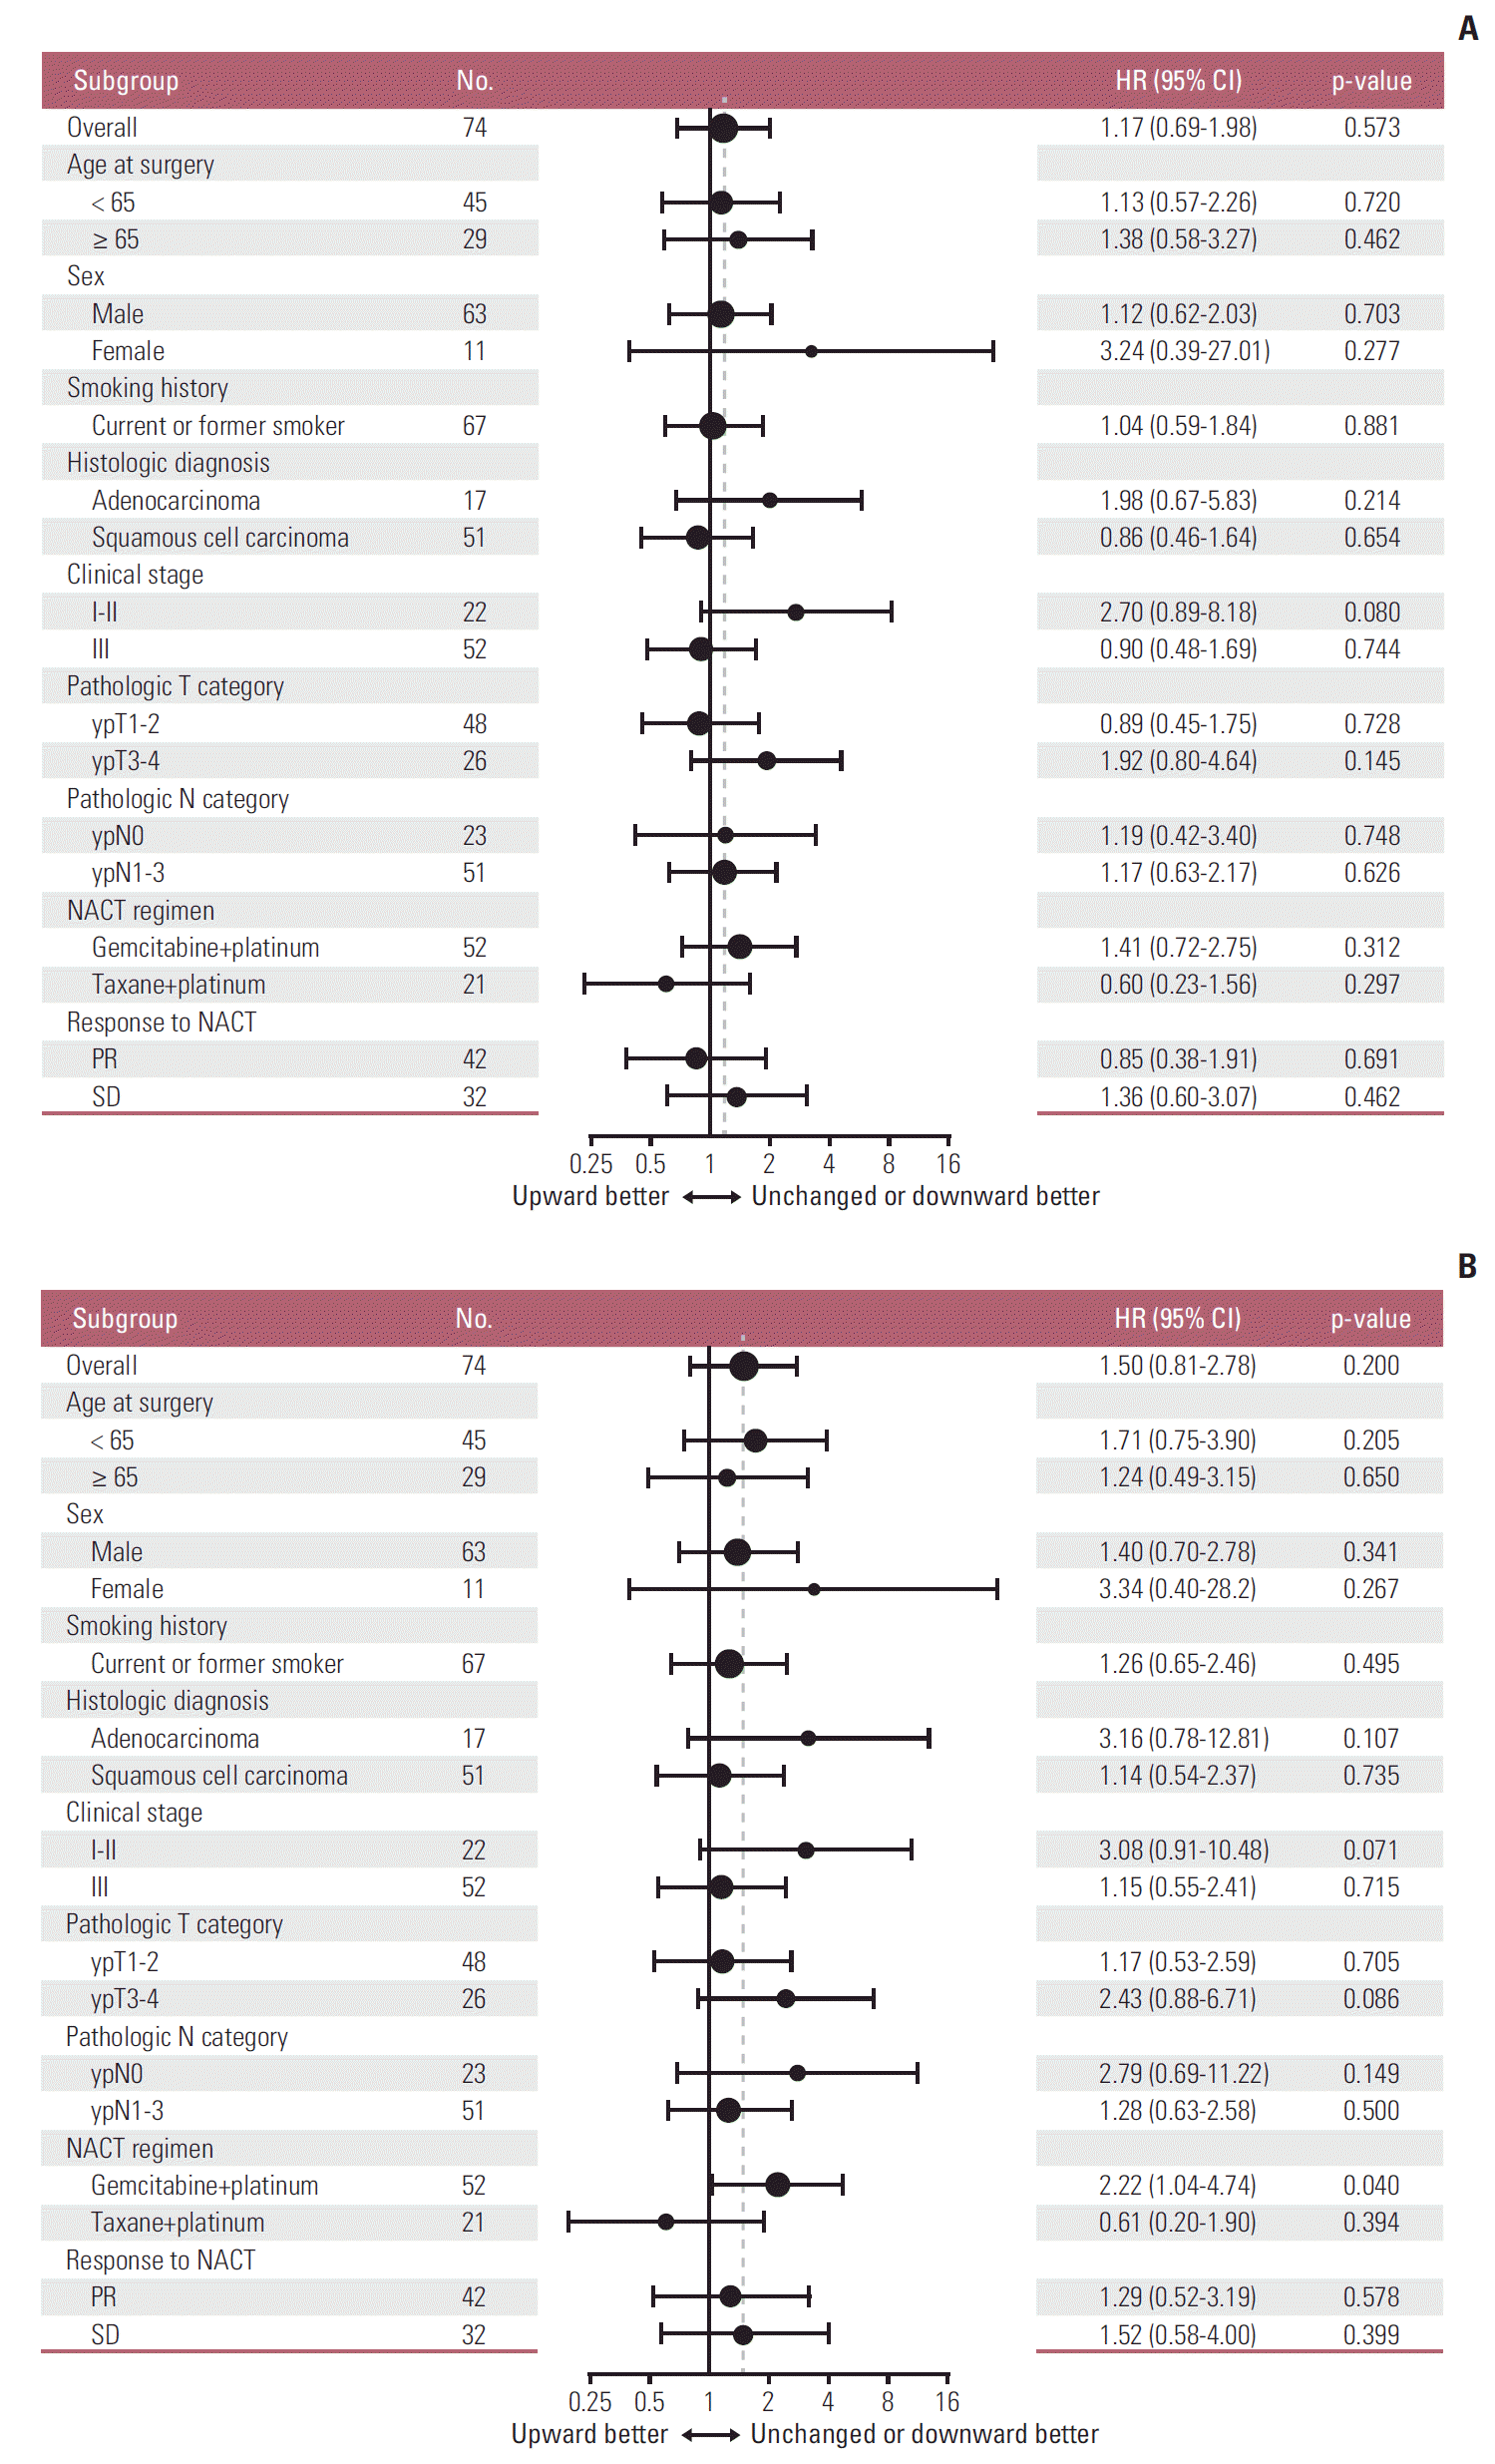 | Fig. 5.Subgroup analyses of the prognostic value of increased (versus unchanged or decreased) programmed death ligand 1 tumor proportion score following platinum-based neoadjuvant chemotherapy (NACT) for disease-free survival (A) and overall survival (B). Note that subgroups with less than 10 patients are omitted. The vertical dashed line indicates the hazard ratio (HR) for all patients in the survival analysis cohort. CI, confidence interval; PR, partial response; SD, stable disease. |
Table 3.
| Model |
Disease-free survival |
Overall survival |
||
|---|---|---|---|---|
| HR (95% CI) | p-value | HR (95% CI) | p-value | |
| Model 1a) | 1.17 (0.67-2.03) | 0.578 | 1.69 (0.89-3.22) | 0.111 |
| Model 2b) | 1.32 (0.73-2.39) | 0.366 | 1.60 (0.80-3.18) | 0.182 |
| Model 3c) | 0.89 (0.46-1.70) | 0.718 | 1.53 (0.69-3.38) | 0.290 |
PD-L1, programmed death ligand 1; NACT, neoadjuvant chemotherapy; HR, hazard ratio; CI, confidence interval.
a) Model 1 is adjusted for age (≥ 65 vs. < 65), pretreatment clinical stage (I-II vs. III), and pathologic N category (ypN0 vs. ypN1 vs. ypN2 vs. ypN3),


 PDF
PDF Citation
 Print
Print


 XML Download