Journal List > Cancer Res Treat > v.51(3) > 1153763

Li, Kim, Park, Lee, Kim, Lee, Kim, Kim, Kim, and Nam: Genetic Profiles Associated with Chemoresistance in Patient-Derived Xenograft Models of Ovarian Cancer

Abstract

Purpose

Recurrence and chemoresistance (CR) are the leading causes of death in patients with high-grade serous carcinoma (HGSC) of the ovary. The aim of this study was to identify genetic changes associated with CR mechanisms using a patient-derived xenograft (PDX) mouse model and genetic sequencing.

Materials and Methods

To generate a CR HGSC PDX tumor, mice bearing subcutaneously implanted HGSC PDX tumors were treated with paclitaxel and carboplatin. We compared gene expression and mutations between chemosensitive (CS) and CR PDX tumors with whole exome and RNA sequencing and selected candidate genes. Correlations between candidate gene expression and clinicopathological variables were explored using the Cancer Genome Atlas (TCGA) database and the Human Protein Atlas (THPA).

Results

Three CR and four CS HGSC PDX tumor models were successfully established. RNA sequencing analysis of the PDX tumors revealed that 146 genes were significantly up-regulated and 54 genes down-regulated in the CR group compared with the CS group. Whole exome sequencing analysis showed 39 mutation sites were identified which only occurred in CR group. Differential expression of SAP25,HLA-DPA1, AKT3, and PIK3R5 genes and mutation of TMEM205 and POLR2A may have important functions in the progression of ovarian cancer chemoresistance. According to TCGA data analysis, patients with high HLA-DPA1 expression were more resistant to initial chemotherapy (p=0.030; odds ratio, 1.845).

Conclusion

We successfully established CR ovarian cancer PDX mouse models. PDX-based genetic profiling study could be used to select some candidate genes that could be targeted to overcome chemoresistance of ovarian cancer.

Introduction

Targeting chemoresistant (CR) or recurrent cancer has become an important strategy for treatment of high-grade serous carcinoma (HGSC) of the ovary. This is due to the fact that up to 80% of patients with HGSC will eventually experience recurrence or disease progression due to resistance to chemotherapy, even if they were highly responsive to first-line platinum-based chemotherapy and achieved pathologic complete response [1,2]. However, standard second-line chemotherapy for resistant or recurrent HGSC is still controversial. Heterogeneity of genetic mutation is one of major reasons for the chemoresistance of ovarian cancer [3,4]. Recently, personalized precision medicine for various cancers has been widely studied as a potential means of overcoming heterogeneity of cancer. Although some genetic aberrations in CR ovarian cancers have been reported, genetic profiling methods such as the Cancer Genome Atlas (TCGA)’s molecular landscape of cancer have shown that epithelial ovarian cancer is deficient in recurrent actionable mutations [5]. Thus, the development of individualized therapy remains an unmet medical need for patients with resistant HGSC [6].
Patient-derived xenograft (PDX) models, which directly implant fresh human tissue into immune-compromised mice, have increasingly been used in preclinical in vivo study. Many researchers have identified not only that PDX models can recapitulate the genetic, heterogeneous characteristics of the original cancer [7,8] but also that their therapeutic responses are concordant with the source patient experience. PDX models have therefore been used broadly in oncology research as reliable patient “avatars.” In this study, in order to reflect the characteristics of donor tumors more accurately, we generated CR HGSC PDX models by intraperitoneal injection of first-line chemotherapeutic agents of ovarian cancer and selected CR and chemosensitive (CS) cases.
With regard to unraveling the mechanisms underlying chemoresistance, other researchers have demonstrated the genetic alterations that regulate the critical steps of the chemoresistance process. Previous studies have proposed a few genes or pathways associated with chemoresistance using microarrays or copy number variation analysis [9]. However, these genetic changes had been incompletely characterized in terms of first-line (carboplatin, paclitaxel) chemotherapy response, and few studies have used genetic sequencing in order to identify the exact factors correlated with chemoresistance in PDXs. In this study, we performed whole exome sequencing PDX tissues to detect genetic mutation, and RNA sequencing to compare the genetic profiles of CS and CR HGSC PDX tissues. Differently expressed genes (DEGs) were further identified to select candidate genes highly suspected to be associated with chemoresistance and therefore to offer the potential for personalized, targeted treatment options.

Materials and Methods

1. Patients and tissue samples

We enrolled seven patients who had HGSC of the ovary in International Federation of Gynecology and Obstetrics stage III to IV of the disease. Tumor specimens were collected during primary debulking or diagnostic surgery between August 2014 and October 2016. Data on the patients’ clinical characteristics were obtained from chart review. Recurrence was defined as a positive radiological examination with a serum carbohydrate antigen 125 assay of more than 35 U/mL after the completion of first line platinum-based chemotherapy.

2. Establishment of CR PDX model

All of the female BALB/c nude mice used in this study were purchased from Orient Bio (Seongnam, Korea). All animal experiments were approved by the Institutional Animal Care and Use Committee (IACUC) of the Yonsei University College of Medicine. Fresh tumor tissues from consenting patients with primary HGSC of the ovary were collected at the time of debulking or diagnostic surgery at Severance Hospital (passage zero). These tissues (about 5×5×3 mm3) were transplanted subcutaneously into 6-8-week-old nude mice within one hour of removal of tissues. Tumor growth was monitored 2-3 times per week, and tumor volume was calculated by the formula 1/2(width2×length). To establish CR HGSC PDX model, 12 mice were engrafted with PDX tumor of passage 2 or 3 in each PDX model. Paclitaxel and carboplatin combination chemotherapy was initiated when tumor volumes reached around 700 mm3. Engrafted mice were randomly divided into two groups: (1) normal saline (control group); (2) paclitaxel 15 mg/kg and carboplatin 50 mg/kg, every 7 days, four cycles, intraperitoneal injection (T+C group). The PDX models that showed tumor regression by more than 70% in every mice was assigned to a CS group, while consistent growth of tumor in every mice was assigned to a CR group.

3. Nucleic acid isolation

About 3×3×3-mm3 (0.1 g) tissues were used to extract nucleic acid. Extracted DNA was quantified by Quant-iT BR assay kit (Invitrogen, Carlsbad, CA). Total RNAs from independent tissues were isolated using RNeasy Mini Kit (Qiagen, Hilden, Germany). The 10 μL (100 ng/μL) DNA and the 10 μL (250 ng/μL) RNA of each samples were sent to proceed genetic analysis. The quality of RNAs was checked via 28S/18S ratio and RNA integrity number (RIN) value using the Agilent Bioanalyzer 2100 system (Agilent Technologies, Santa Clara, CA). Total RNAs with RIN values greater than 7.0 were taken for subsequent downstream analysis.

4. Whole exome sequencing and analysis

Whole exome-sequencing (WES) capturing sequencing was performed using a 51 Mb SureSelect V5 Kit (Agilent Technologies) according to the manufacturer’s instructions. DNA libraries were constructed according to the protocol provided by the manufacturer, and WES was performed using an Illumina HiSeq2500 platform (Illumina, San Diego, CA) to generate 101bp paired-end reads. To separate human and mouse WES reads, we used BBsplit together with BBmap package (https://sourceforge.net/projects/bbmap/). We used Cutadapt and sickle to remove adapter sequences and low-quality sequence reads. A Burrows-Wheeler aligner [10] was used to align the sequencing reads onto the human reference genome (hg19). We used a Genome Analysis ToolKit [11] for local realignment, score recalibration and filtering sequence data. Somatic genomic variants were identified using MuTect to call somatic point mutations. SnpEff was used to select somatic variants located in coding sequences and predict their functional consequences, such as silent or non-silent variants. The details of WES and alignments were summarized in S1-S5 Tables.

5. RNA sequencing and analysis

mRNA sequencing was performed using a TruSeq RNA Library Prep Kit (Illumina). Whole-transcriptome sequencing was performed using an Illumina HiSeq2500 platform. We used in-house script to trim low quality reads, and we analyzed filtered sequence data using STAR [12] for alignment, Cufflinks v2.2.1 [13] for assembly, and a known set of reference transcripts from Ensembl v72 for expression estimation. To count the DEGs, we used Cuffdiff of Cufflinks package v2.2.1. For functional enrichment analysis, we performed Gene Ontology (http://www.geneontology.org/) and Kyoto Encyclopedia of Genes and Genome (KEGG) pathway analysis (http://www.kegg.jp/).

6. Utilization of TCGA and THPA data

We searched the TCGA database (https://tcga-data.nci.nih.gov/tcga/tcgaDownload.jsp) and collected ovarian cancer patient genetic profiling and clinical data. Kaplan-Meier analysis of the correlation between RNA gene expression levels and overall survival was available in THPA (https://www.proteinatlas.org/). There are no restrictions on the publication and use of these data.

7. Histopathology and immunohistochemistry

Hematoxylin and eosin (H&E) staining of formalin-fixed tumor tissues from patient and PDX tissues were performed. Immunohistochemistry (IHC) staining was performed on 4-μm sections prepared from harvested PDX tumor tissue. Slides were incubated with antibodies against AKT3 (1:500, ab152157, Abcam, Cambridge, UK), PIK3R5 (1:150, NBP2-46413, Novus, Littleton, CO), HLA-DPA1 (1:500, NBP2-16851, Novus), and SAP25 (1:50, NBP2-32365, Novus), after which slides were treated with 3,3'-diaminobenzidine (Dako, Glustrup, Denmark). Staining intensity of the cells was scored at four fields from each sample at 400× magnification by three examiners. It was scored as 0 (negative staining), 1 (week staining), 2 (intermediate staining), and 3 (strong staining).

8. Quantitative real-time polymerase chain reaction

Total RNAs was extracted using a TruSeq RNA Library Prep Kit (Illumina). RNA was converted to cDNA using a reverse transcription reagent kit (Bioline, London, UK) and amplified using SensiFAST SYBR Hi ROX Mix (Bioline). ABI StepOnePlus Real Time PCR System (Applied Biosystems, Foster City, CA) was used to conduct quantitative real-time polymerase chain reaction (qRT-PCR). 18S was the internal standard and relative gene expression was calculated using the 2-ΔΔCT method. CS1 was served as control values. Primers used for each gene were shown in S6 Table.

9. Statistical analysis

Receiver operating characteristic curves were used to identify high and low RNA expression of genes. A chi-square test was used to assess the relationship between RNA expression and patient response to initial chemotherapy. Statistical calculation was performed using SPSS ver. 23.0 (IBM Corp., Armonk, NY). A p-value of < 0.05 was considered statistically significant. Hierarchical clustering of DEGs between CS and CR PDX groups was performed using R studio v 0.99.903 (RStudio Inc., Boston, MA).

10. Ethical statement

This study was approved by the Yonsei University Severance Hospital Institutional Review Board (IRB) in accordance with the Helsinki Declaration (IRB number: 4-2013-0526). All participants provided written informed consent before enrolling in this study.

Results

1. Establishment of CR PDX model from serous ovarian cancer

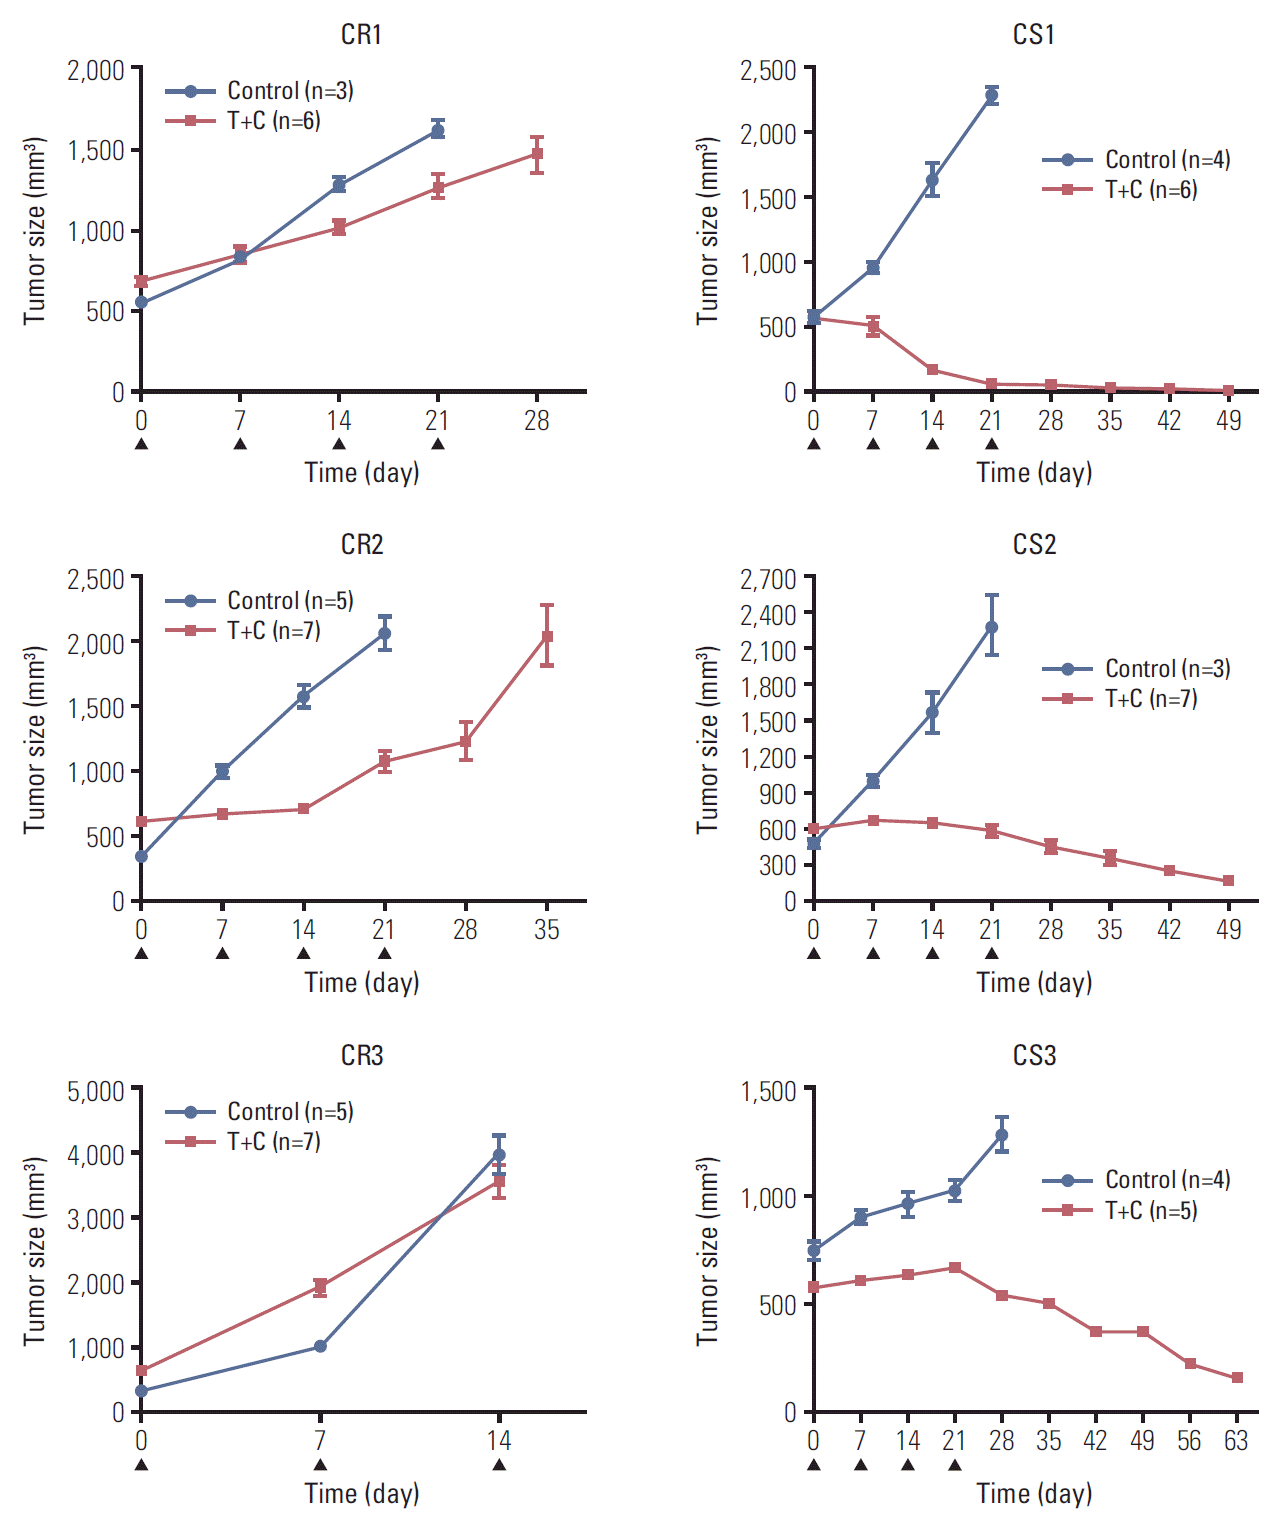
We selected seven HGSC PDXs from our previously established ovarian PDX tumor bank. Four cases were assigned to a CS group and three cases were assigned to a CR group according to the chemoresponse of PDX model (Fig. 1). These seven PDX models and their corresponding patients had similar responses to chemotherapy (S7 Table). We selected three cases of CS (CS1, CS2, and CS3) group and three cases of CR (CR1, CR2, and CR3) group to perform genetic analysis. All the CR3 tumors were harvested 2 weeks after chemo agent injection due to the speed at which the tumors were growing.

2. DEG data and target genes

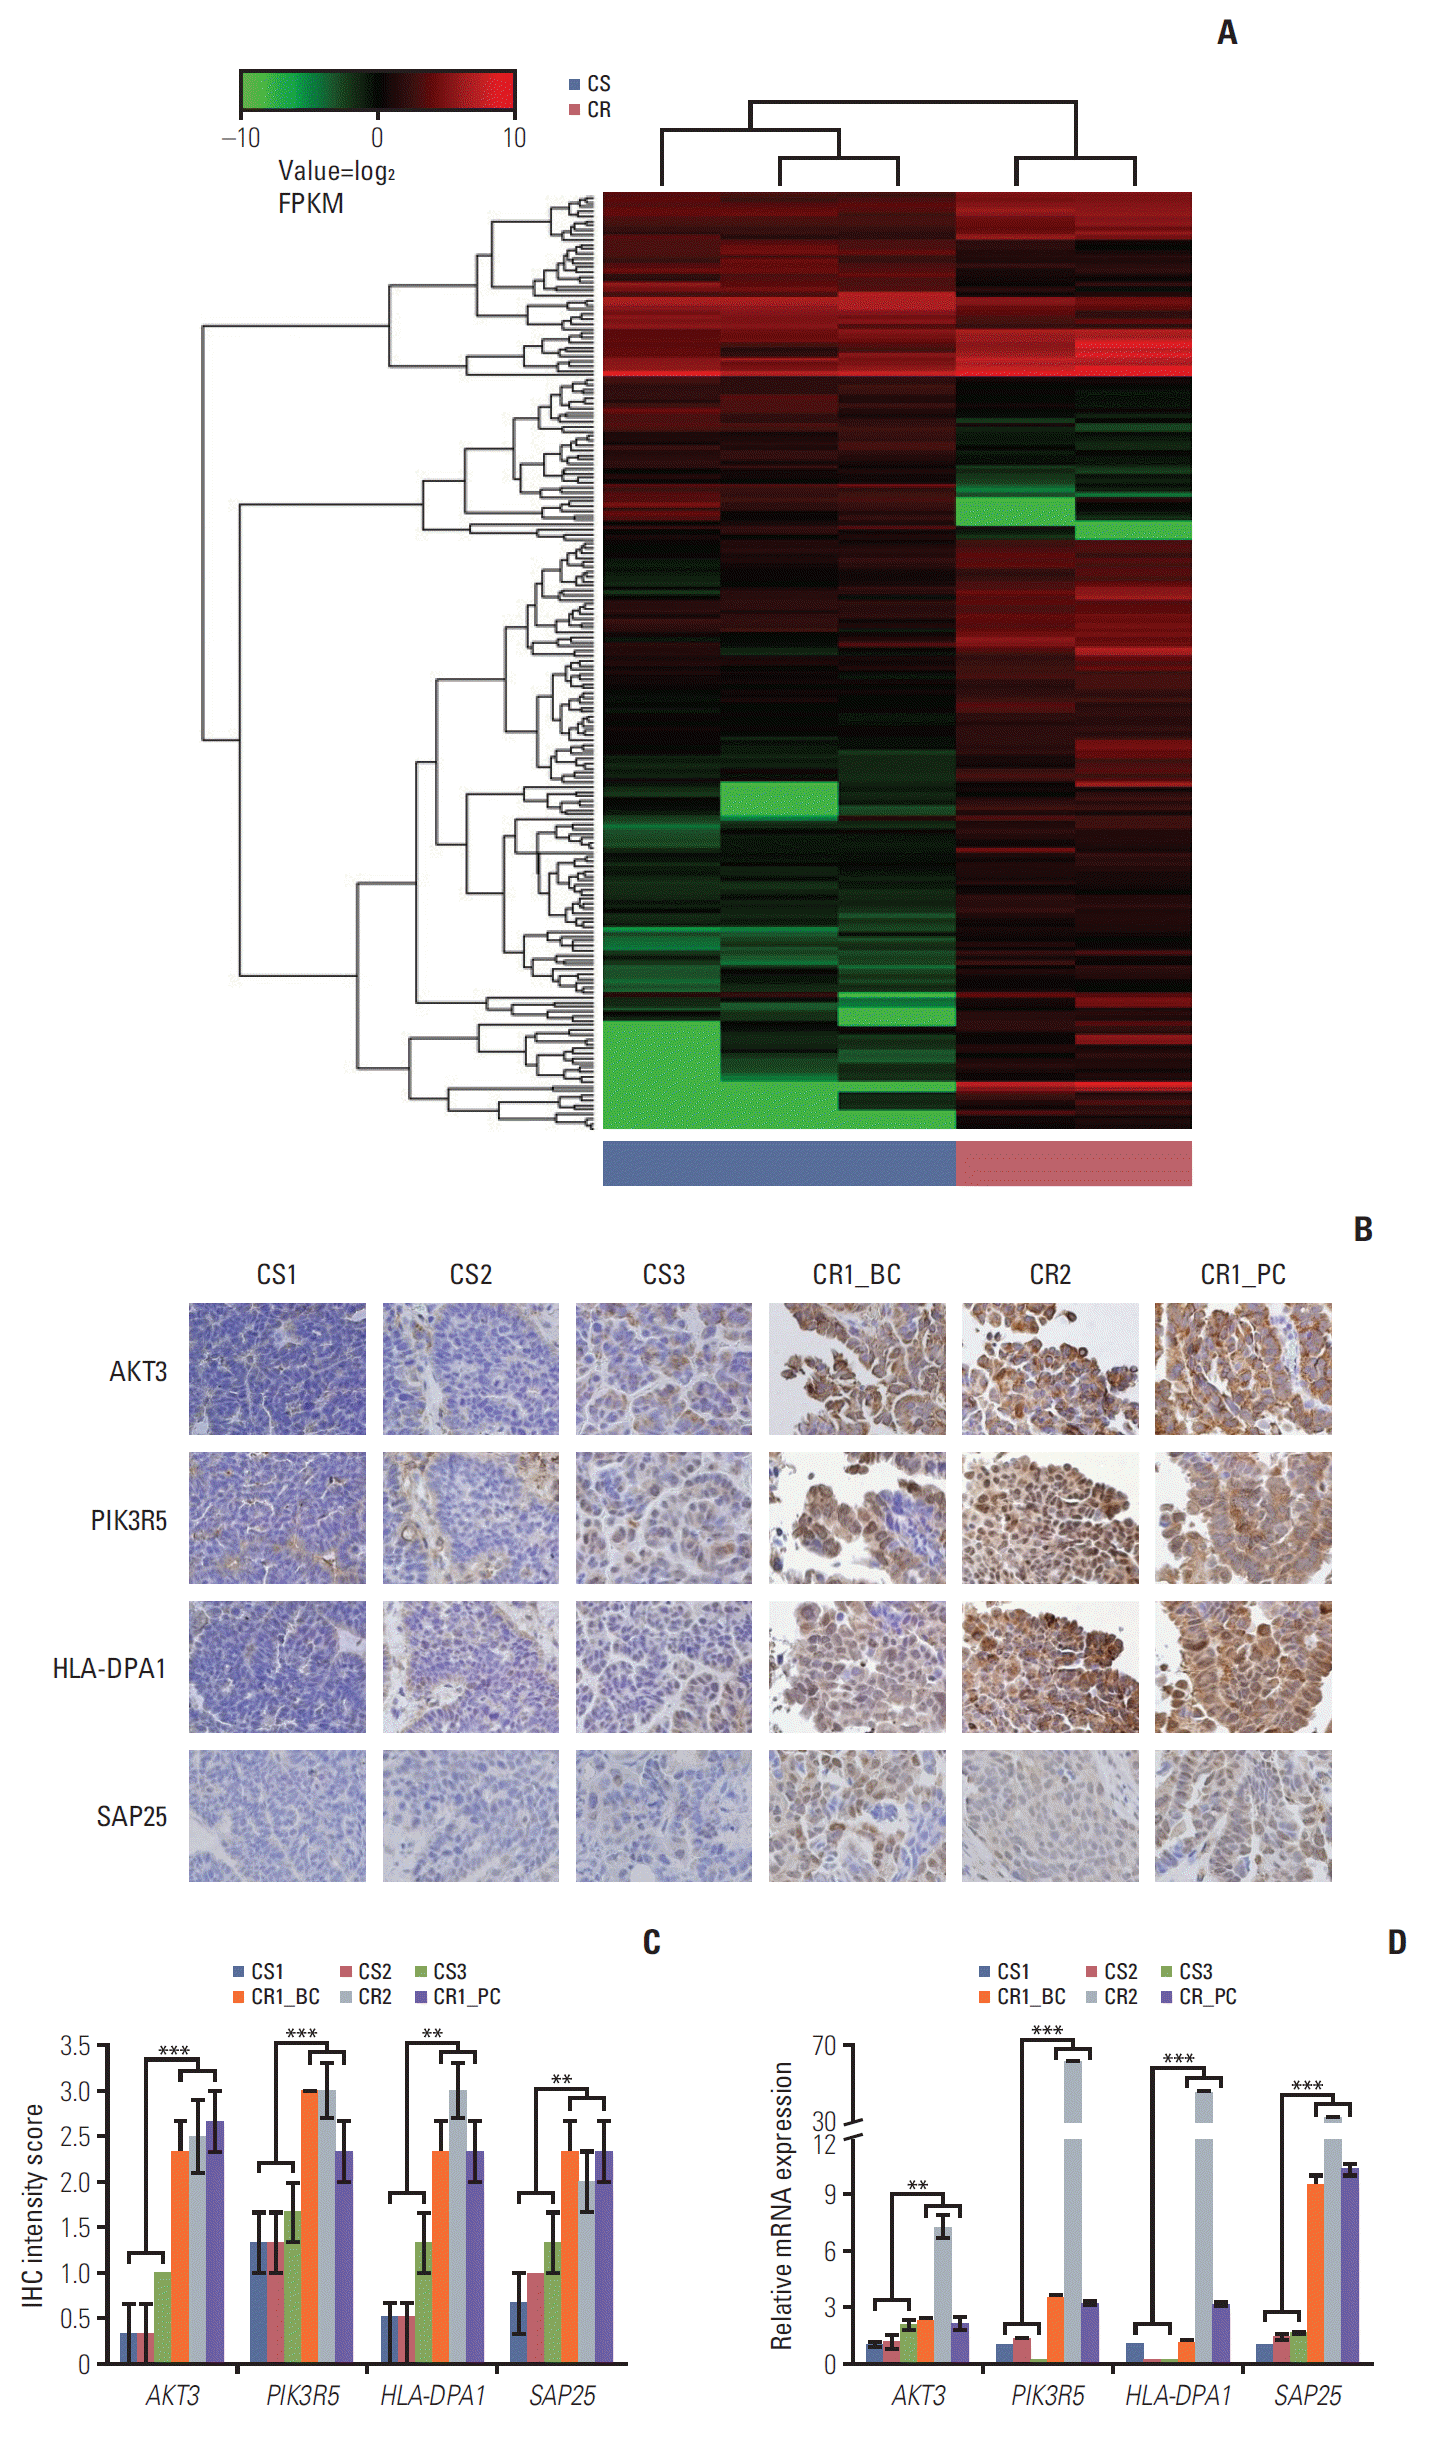
The RNA sequencing was successful in five PDX models and unsuccessful in one model. Sequencing of the CR3 tumor failed because the tissue contained too many mouse genes with a low coverage of human genes. We set cut-off criteria for the purpose of screening out the genes specific for CR patients. As for the up-regulated genes, only those genes with expression levels > 1 fragments per kilobase million (FPKM) and 2.5-fold more expression than opposite groups were selected in this study. Total 200 genes were determined to be differentially expressed between the CS and CR groups of the PDX model, including 146 up-regulated genes and 54 down-regulated genes in the CR group. Of these genes (excepting those genes that were uncharacterized), SAP25 differed most in its expression (S8 Table). Hierarchical clustering of the 200 differentially expressed genes is presented in Fig. 2A. The results of the KEGG pathways analysis showed that complement and coagulation cascades, cell adhesion molecules, and extracellular matrix–receptor inter-action (KEGG p=0.001, p=0.001, and p=0.003, respectively) signal pathways were the most significantly impacted cancer-related pathways in CR groups compared to CS groups. Among the genes involved in these pathways, we found that cell adhesion pathway related HLA-DPA1 gene was the most up-regulated gene (> 88 fold FPKM than CS groups) in the CR group (S8 Table).

3. Whole exome sequencing data analysis

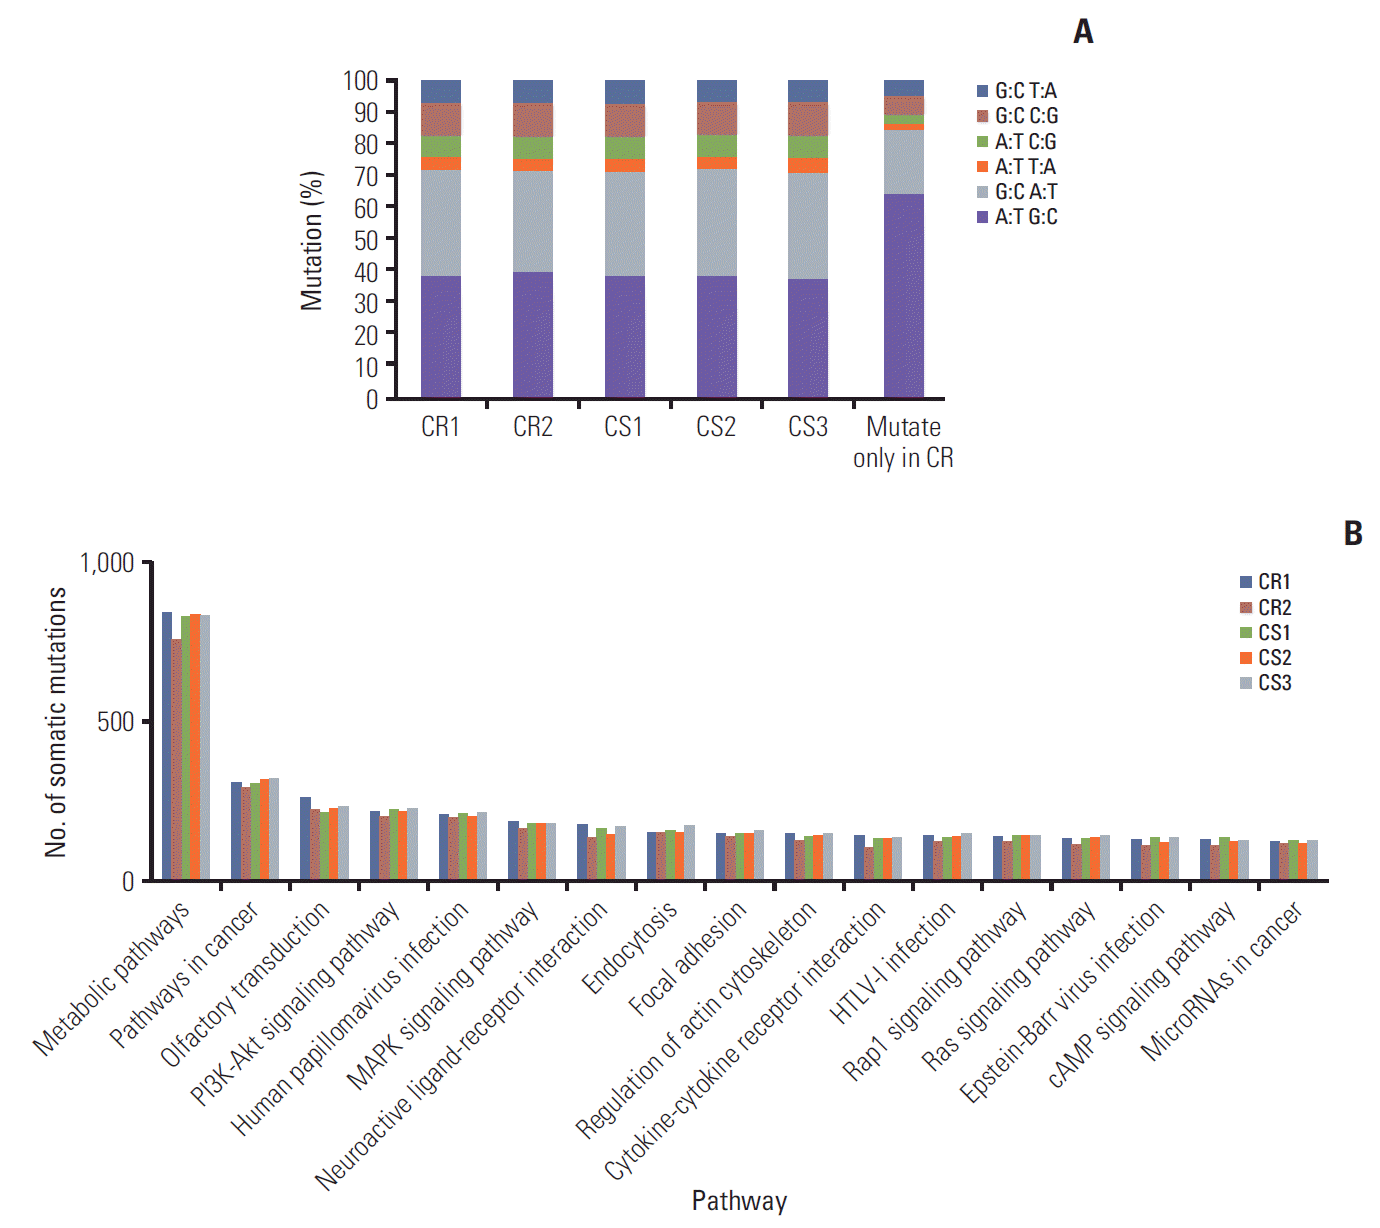
An average of 30,460 and 27,944 somatic mutations were observed in the CS and CR group, respectively, and the average respective sequencing depths were 110 and 115. A to T transversions was the most frequent somatic mutations in each PDX tissues (A to T ratio, 38%-40%). Of the mutations occurred only in CR groups, the A to T ratio increased to 65% (Fig. 3A). A total of 39 mutation sites were identified which only occurred in chemoresistant group (S9 Table). Interestingly, of these mutation genes, the expression level of four insertion genes (CCDC159, POLR2A, SPG7, and TMEM205) increased in CR groups compared with CS groups (Table 1). We could hypothesis that these insertion mutation genes may lead to chemoresistance of ovarian cancer. The phosphoinositide 3-kinase (PI3K)–Akt signaling pathway and the mitogen-activated protein kinase signaling pathway had the greatest number of mutated genes in all PDX models (164-182 and 134-152 mutated genes, respectively) (Fig. 3B). Although there was no difference in the number of mutated genes between the CS and CR group, the results above suggest that the mutated genes in these pathways might have stronger associations with ovarian cancer. Furthermore, we found that the AKT3 and PIK3R5 genes involved in the PI3K-Akt signaling pathway were on the list of 200 selected DEGs.

4. Clinical association of selected genes

Based on WES data and data concerning the top differentially expressed genes, we identified the SAP25, HLA-DPA1, AKT3, and PIK3R5 genes as candidate genes possibly involved in the mechanism underlying chemoresistance. We analyzed the RNA expression of the four candidate genes in 236 ovarian cancer patients from TCGA database and explored their correlations with initial chemotherapy response. Of the 236 ovarian cancer patients, 161 had shown complete remission during chemotherapy, while 75 showed partial remission, progression, or stable disease. According to the expression level of HLA-DPA1, rather than SAP25, AKT3, or PIK3R5, there was a significant difference in patients’ initial chemoresponse (p=0.030; odds ratio, 1.845) (Table 2). Patients with high expression of HLA-DPA1 were more resistant to initial chemotherapy. According to THPA data, patients with low expression of SAP25 had slightly better survival than those with high expression of the gene (p=0.050) (S10 Fig.).

5. Validation of selected genes by IHC and qRT-PCR

Following H&E staining of patient and corresponding PDX tissues, we were able to determine that that patient cancer cell morphology was retained in most of the PDX models (S11 Fig.). We observed many stromal or fibrous cells in both the CR2 and CR3 PDX slides, and this was even more obvious after chemotherapy. To examine the expression of selected genes in PDX tissues, IHC and qRT-PCR were done on CS and CR PDX tissues. As determined by RNA-sequencing, IHC staining showed higher protein expression levels of all four genes in the CR group compared to the CS group (Fig. 2B and C). qRT-PCR analysis also showed that AKT3, PIK3R5, HLA-DPA1, and SAP25 overexpressed in CR groups compared with that in CS groups (Fig. 2D).

Discussion

Platinum-based chemotherapy is still a standard treatment despite the well-known fact that 80% of primary ovarian cancer cases will exhibit chemoresistance and recurrence [2]. Specialized therapy targeting the mechanisms underlying chemoresistance during the early phase of treatment is urgently needed for ovarian cancer patients. Although the TCGA database provided useful genetic data for researchers, ovarian cancer is still deficient in recurrent actionable mutations. Besides, ovarian cancer always requires time to recur, and physicians have not been able to accurately predict chemoresponse accurately during the early phases of treatment, much less get the patient’s resistant sample. In our study, we used PDX to set up a CR model in a short period of time and then executed whole exome sequencing and RNA sequencing DEG analysis with CS and CR cancer tissues harvested from PDX mice in order to identify potential actionable molecular targets related to chemoresistance. The overall workflow of selecting candidate genes is summarized in S12 Fig.
Nevertheless, single gene alterations alone were not able to generate chemoresistance. Alteration of metabolic factors and pathways act in concert to change cancer cell characteristics [14]. In the DEGs of the cell adhesion pathway, major histocompatibility complex (MHC) class II molecule genes (HLA-DOA, HLA-DPA1, and HLA-DRA) were in the list of 200 genes that they significantly up-regulated in CR groups. This suggests that these MHC class II molecules have an important effect on the mechanism underlying cancer chemoresistance. This result was in agreement with other studies, which found that the MHC complex played a main role in ovarian immunology and that both HLA class I and II molecules contributed to resistance to treatment [15,16]. This result was further validated by the TCGA database, which predicted that patients with high expression of HLA-DPA1 would be more CR to initial chemotherapy. Thus, HLA-DPA1 expression could serve as a predictor of initial chemotherapy results and might also be a gene that could be targeted in the treatment of CR cancers.
Additionally, SAP25 was the most differentially expressed between the CS and CR group. This gene was known as a novel component of the mSin3A complex. mSin3A is known to be involved in cell fate, and its core binding proteins (such as SAP25) may also have different effects on cell behavior [17]. Hence, we could hypothesize that SAP25 might have played a role in the mechanisms underlying chemoresistance, but further research would be needed to prove this.
PI3K/AKT signaling pathway has been widely investigated as a treatment target due to the role it plays in regulating cell growth, cell survival, angiogenesis, tumorigenesis, and drug resistance [18]. Dysregulation of this pathway and high frequency aberrations had been observed in several human cancers, including ovarian cancer [19-21]. This was consistent with our WES results. As for PI3K, much preclinical research has supported the use of PI3K inhibitors as anticancer agents and many clinical trials of PI3K inhibitors are being performed by pharmaceutical companies or institutions to further evaluate their effect on CR cancers [22]. AKT3 was significantly up-regulated in our CR group, which suggested the possibility of AKT3 as a target for therapy. Liby et al. [23] demonstrated that blocking AKT3 alone could eliminate vascular endothelial growth factor secretion in ovarian cancer cells and reduce tumor vascularization in PDX models. AKT’s anticancer effect has also been validated in Phase I clinical trials, and other clinical trials investigating small molecule inhibitors of AKT are still ongoing [24].
Determining the WES in ovarian cancer PDX model identified four insertion genes (CCDC159, POLR2A, SPG7, and TMEM205) mutated only in CR groups. Of these genes, TMEM205 was known as associated with cisplatin resistance in lung cancer. The effect of overexpression of TMEM205 in lung cancer on cisplatin resistance has been confirmed and is suggested as a biomarker and target in clinical chemotherapy [25]. Besides, Wang et al. [26] showed that polymorphism of TMEM205 was significantly associated with platinum-based chemotherapy response in lung cancer. They further hypothesize that the location of gene or the variant can regulate the expression of gene. It is consistent with our result that the expression of TMEM205 in TMEM205 insertion variant CR groups was higher (1.7 fold) than that in non-variant CS groups. However, the potential mechanisms of gene expression regulated by mutated genes remains to be further studied [26]. POLR2A encodes largest RNA polymerase II complex and is responsible for cell proliferation including ovarian and colon cancer. Liu et al. [27] demonstrated that suppression of POLR2A could selectively inhibit the tumorigenic potential of colorectal cancer cells [28]. Furthermore, polymorphisms of POLR2A were associated with worse survival outcomes in non-small cell lung cancer [29]. Although little research has been done on the effect of POLR2A insertion variant on tumor chemoresistance, these studies paved the way for a better understanding of the effect of TMEM205 and POLR2A mutation on the gene expression which is correlated with chemoresistance in the cancer.
In summary, we set up a CR PDX model by replicating the exact treatment scheme used on its donor patients. For the purpose of identifying genes that play vital roles in the development of chemoresistance, we integrated WES and DEG analysis to increase accuracy. The result showed that differential expression of SAP25, HLA-DPA1, AKT3, and PIK3R5 genes and mutation of TMEM205 and POLR2A may have important functions in the progression of ovarian cancer chemoresistance. This preliminary PDX-based genetic profiling study could serve as a platform for further research on chemoresistance in ovarian cancer. However, further studies are needed to validate the effectiveness of these selected genes’ inhibitors in ovarian cancer PDX models or in corresponding ovarian cancer patients.

Notes

Conflict of interest relevant to this article was not reported.

ACKNOWLEDGMENTS

This research was supported by a grant from the Korea Health Technology R&D Project through the Korea Health Industry Development Institute funded by the Ministry of Health & Welfare, Republic of Korea (grant number: HI17C0321), by the Basic Science Research Program through the National Research Foundation of Korea (NRF) funded by the Ministry of Education, Science, ICT & Future Planning (2011-0013127, 2014R1A1A2053635, 2014R1A1A1A-05002926, 2015R1A2A2A01008162, 2015R1C1A2A01053516, and 2017R1A2B4005503) and faculty research grant of Yonsei University College of Medicine (6-2018-0053).

References

1. Romero I, Bast RC Jr. Minireview: human ovarian cancer: biology, current management, and paths to personalizing therapy. Endocrinology. 2012; 153:1593–602.
crossref
2. Holmes D. The problem with platinum. Nature. 2015; 527:S218–9.
crossref
3. Tredan O, Galmarini CM, Patel K, Tannock IF. Drug resistance and the solid tumor microenvironment. J Natl Cancer Inst. 2007; 99:1441–54.
crossref
4. Senthebane DA, Rowe A, Thomford NE, Shipanga H, Munro D, Mazeedi MA, et al. The role of tumor microenvironment in chemoresistance: to survive, keep your enemies closer. Int J Mol Sci. 2017; 18:E1586.
crossref
5. Patch AM, Christie EL, Etemadmoghadam D, Garsed DW, George J, Fereday S, et al. Whole-genome characterization of chemoresistant ovarian cancer. Nature. 2015; 521:489–94.
6. Bast RC Jr, Mills GB. Personalizing therapy for ovarian cancer: BRCAness and beyond. J Clin Oncol. 2010; 28:3545–8.
crossref
7. Dobbin ZC, Katre AA, Steg AD, Erickson BK, Shah MM, Alvarez RD, et al. Using heterogeneity of the patient-derived xenograft model to identify the chemoresistant population in ovarian cancer. Oncotarget. 2014; 5:8750–64.
crossref
8. Liu JF, Palakurthi S, Zeng Q, Zhou S, Ivanova E, Huang W, et al. Establishment of patient-derived tumor xenograft models of epithelial ovarian cancer for preclinical evaluation of novel therapeutics. Clin Cancer Res. 2017; 23:1263–73.
crossref
9. Etemadmoghadam D, deFazio A, Beroukhim R, Mermel C, George J, Getz G, et al. Integrated genome-wide DNA copy number and expression analysis identifies distinct mechanisms of primary chemoresistance in ovarian carcinomas. Clin Cancer Res. 2009; 15:1417–27.
crossref
10. Li H, Durbin R. Fast and accurate short read alignment with Burrows-Wheeler transform. Bioinformatics. 2009; 25:1754–60.
crossref
11. McKenna A, Hanna M, Banks E, Sivachenko A, Cibulskis K, Kernytsky A, et al. The Genome Analysis Toolkit: a Map Reduce framework for analyzing next-generation DNA sequencing data. Genome Res. 2010; 20:1297–303.
12. Dobin A, Davis CA, Schlesinger F, Drenkow J, Zaleski C, Jha S, et al. STAR: ultrafast universal RNA-seq aligner. Bioinformatics. 2013; 29:15–21.
crossref
13. Trapnell C, Williams BA, Pertea G, Mortazavi A, Kwan G, van Baren MJ, et al. Transcript assembly and quantification by RNA-Seq reveals unannotated transcripts and isoform switching during cell differentiation. Nat Biotechnol. 2010; 28:511–5.
crossref
14. Rahman M, Hasan MR. Cancer metabolism and drug resistance. Metabolites. 2015; 5:571–600.
crossref
15. Ghazy AA, El-Etreby NM. Relevance of HLA-DP/DQ and ICAM-1 SNPs among ovarian cancer patients. Front Immunol. 2016; 7:202.
crossref
16. Kubler K, Arndt PF, Wardelmann E, Landwehr C, Krebs D, Kuhn W, et al. Genetic alterations of HLA-class II in ovarian cancer. Int J Cancer. 2008; 123:1350–6.
17. Shiio Y, Rose DW, Aur R, Donohoe S, Aebersold R, Eisenman RN. Identification and characterization of SAP25, a novel component of the mSin3 corepressor complex. Mol Cell Biol. 2006; 26:1386–97.
crossref
18. Burris HA 3rd. Overcoming acquired resistance to anticancer therapy: focus on the PI3K/AKT/mTOR pathway. Cancer Chemother Pharmacol. 2013; 71:829–42.
crossref
19. Shaw RJ, Cantley LC. Ras, PI(3)K and mTOR signalling controls tumour cell growth. Nature. 2006; 441:424–30.
crossref
20. Cancer Genome Atlas Research Network. Integrated genomic analyses of ovarian carcinoma. Nature. 2011; 474:609–15.
21. Yuan TL, Cantley LC. PI3K pathway alterations in cancer: variations on a theme. Oncogene. 2008; 27:5497–510.
crossref
22. Massacesi C, Di Tomaso E, Urban P, Germa C, Quadt C, Trandafir L, et al. PI3K inhibitors as new cancer therapeutics: implications for clinical trial design. Onco Targets Ther. 2016; 9:203–10.
crossref
23. Liby TA, Spyropoulos P, Buff Lindner H, Eldridge J, Beeson C, Hsu T, et al. Akt3 controls vascular endothelial growth factor secretion and angiogenesis in ovarian cancer cells. Int J Cancer. 2012; 130:532–43.
crossref
24. Burris HA, Siu LL, Infante JR, Wheler JJ, Kurkjian C, Opalinska J, et al. Safety, pharmacokinetics (PK), pharmacodynamics (PD), and clinical activity of the oral AKT inhibitor GSK2141795 (GSK795) in a phase I first-in-human study. J Clin Oncol. 2011; 29(15 Suppl):3003.
crossref
25. Shen DW, Ma J, Okabe M, Zhang G, Xia D, Gottesman MM. Elevated expression of TMEM205, a hypothetical membrane protein, is associated with cisplatin resistance. J Cell Physiol. 2010; 225:822–8.
crossref
26. Wang Y, Yin JY, Li XP, Chen J, Qian CY, Zheng Y, et al. The association of transporter genes polymorphisms and lung cancer chemotherapy response. PLoS One. 2014; 9:e91967.
crossref
27. Liu Y, Zhang X, Han C, Wan G, Huang X, Ivan C, et al. TP53 loss creates therapeutic vulnerability in colorectal cancer. Nature. 2015; 520:697–701.
28. Francavilla C, Lupia M, Tsafou K, Villa A, Kowalczyk K, Rakownikow Jersie-Christensen R, et al. Phosphoproteomics of primary cells reveals druggable kinase signatures in ovarian cancer. Cell Rep. 2017; 18:3242–56.
crossref
29. Yoo SS, Hong MJ, Lee JH, Choi JE, Lee SY, Lee J, et al. Association between polymorphisms in microRNA target sites and survival in early-stage non-small cell lung cancer. Thorac Cancer. 2017; 8:682–6.
crossref

Fig. 1.
Different chemoresponses in six ovarian patient-derived xenograft models. Three cases (CS1, CS2, and CS3) showed regression of tumor, three cases (CR1, CR2, and CR3) showed consistent growth of tumor. CS, chemosensitive; CR, chemoresistant; T, paclitaxel; C, carboplatin; ▲, chemotherapy injection.
crt-2018-405f1.tif
Fig. 2.
Genetic expression of frequently expressed genes and validation of candidate genes in patient-derived xenograft (PDX). (A) Unsupervised hierarchical clustering analysis using 200 selected genes differentially expressed between chemosensitive (CS) and chemoresistant (CR) groups. FPKM, fragments per kilobase million. (B) Immunohistochemical (IHC) staining of AKT3, PIK3R5, HLA-DPA1, and SAP25 in PDX (×400). Expression levels of AKT3, PIK3R5, HLA-DPA1, and SAP25 were much lower in CS cases than in CR (BC, before chemotherapy; PC, post chemotherapy). (C) IHC staining intensity of AKT3, PIK3R5, HLA-DPA1, and SAP25 in CS and CR group. The protein expression levels of four genes were significantly higher in each CR group in comparison with CS. (D) Quantitative real-time polymerase chain reaction analysis of AKT3, PIK3R5, HLA-DPA1, and SAP25 expression in PDX. The mRNA expression level of four genes were significantly increased in each CR group in comparison with CS group. **p < 0.01, ***p < 0.001.
crt-2018-405f2.tif
Fig. 3.
Somatic mutation in five patient-derived xenograft (PDX) models. (A) The proportion of mutational type in five PDX tissues. (B) Number of mutated genes by pathway. The phosphoinositide 3-kinase (PI3K)-AKT and mitogen-activated protein kinase (MAPK) signaling pathways exhibited relatively more mutated genes than other pathways in all PDXs. CR, chemoresistant; CS, chemosensitive.
crt-2018-405f3.tif
Table 1.
Gene expression level of five insertion variants
Gene name REF ALT Gene expression (FPKM)
CR1 CR2 CS1 CS2 CS3 CR/CS ratio
CCDC159 G GA 62.45 108.96 25.26 25.89 58.52 2.34
INTS4 A AT 18.42 21.28 25.9 24.71 41.81 0.64
POLR2A T TAGA 41.56 17.17 16.16 33.53 29.25 1.15
SPG7 T TATCTC 46.1 68.42 62.55 36.59 41.62 1.22
TMEM205 G GA 251.23 204.28 107.63 120.47 172.26 1.71

REF, reference allele; ALT, alternative allele; FPKM, fragments per kilobase million; CR, chemoresistant; CS, chemosensitive.

Table 2.
Correlation of selected gene expression and initial chemotherapy response in TCGA data
Expression PR, PD, SD Complete remission p-value ORa)
SAP25
 High 31 55 0.286 1.358 (0.773-2.385)
 Low 44 106
HLA-DPA1
 High 44 70 0.030 1.845 (1.059-3.215)
 Low 31 91
AKT3
 High 38 75 0.559 1.178 (0.681-2.038)
 Low 37 86
PIK3R5
 High 35 82 0.542 0.843 (0.487-1.459)
 Low 40 79

TCGA, the Cancer Genome Atlas; PR, partial remission; PD, progression of disease; SD, stable disease; OR, odd ratio.

a) Odds ratio (OR) > 1 indicated more resistant to initial chemotherapy than reference groups.

TOOLS
Similar articles