Journal List > Cancer Res Treat > v.51(1) > 1153695

Shin, Park, Lee, Jeon, Cho, Kang, Park, Park, and Park: Health-Related Quality of Life, Perceived Social Support, and Depression in Disease-Free Survivors Who Underwent Curative Surgery Only for Prostate, Kidney and Bladder Cancer: Comparison among Survivors and with the General Population

Abstract

Purpose

The purpose of this study was to compare health-related quality of life (HRQoL) of disease-free prostate (PC), kidney (KC), and bladder cancer (BC) survivors with that of the general population.

Materials and Methods

Our study included 331 urological cancer (UC) survivors (114 PC, 108 KC, and 109 BC) aged ≥ 50 years disease-free for at least 1 year after surgery. The control group included 1,177 subjects without a history of cancer. The HRQoL was assessed using the European Organization for Research and Treatment of Cancer QLQ-C30, the Duke-UNC Functional Social Support Questionnaire, and the Patient Health Questionnaire-9.

Results

There was no significant difference between the groups in terms of any of the functioning sub-scales and symptoms, except significantly lower social functioning observed in BC survivors than that observed in KC survivors. Although the three groups of UC survivors showed essentially similar functioning sub-scales and symptoms when compared to the general population, PC and BC survivors showed significantly lower social functioning and a lower appetite than that observed in controls. KC survivors showed lower physical functioning, as well as higher pain and dyspnea. Although all three groups of UC survivors reported higher financial difficulties, they also reported higher perceived social support than that reported by the non-cancer control group. No statistically significant difference was observed in terms of depressive symptoms between each group of UC survivors and the general population.

Conclusion

Disease-free survivors of the three major types of UCs showed generally similar HRQoL compared to the general population, as well as compared to each other.

Introduction

Urological cancers (UCs) constitute a significant percentage of newly diagnosed cancer cases and are being detected in increasing numbers in the aging population. Prostate cancer (PC), kidney cancer (KC), and bladder cancer (BC) constitute 4.5%, 2.1%, and 1.8%, respectively, of newly diagnosed cancer cases in Korea [1]. Additionally, the rapidly increasing elderly population in Korea, as well as the adoption of a westernized diet and a growing trend of performing routine health checkups has led to a recent increase in the incidence of PC, KC, and BC with an annual percentage change of 13.6%, 6.0%, and 1.5%, respectively [1].
Notably, survival of patients with UCs has also improved over time owing to early diagnosis and availability of advanced treatment [2-4]. The 5-year relative survival rates for PC, KC, and BC have risen to 99%, 74%, and 79%, respectively, in the United States [3], 84.8%, 56.3%, and 55.5%, respectively, in United Kingdom [4], and 93.3%, 81.3%, and 75.6%, respectively, in Korea [1,2]. Thus, the number of UC survivors has increased, and their health-related qualityof-life (HRQoL) issues have been gaining attention, although this is to a lesser extent than that observed with other cancers such as breast, lung, and colorectal cancers. Moreover, previous quality of life (QoL) studies with respect to UCs have primarily focused on issues that are specific to a particular type of cancer (e.g., voiding and sexual function in PC and BC patients) or a comparison of HRQoL based on the treatment method used in each category of UC patients. Few studies have adequately addressed general HRQoL issues including functioning and symptoms, perceived social support, and depression among UC survivors. Moreover, few studies have analyzed the HRQoL of UC survivors compared to that of the general population.
Understanding the general QoL issues of UC survivors would help clinicians provide comprehensive care to them. In this study, we aimed to assess the general HRQoL among disease-free survivors of surgically treated PC, KC, and BC and to compare these results with the corresponding parameters obtained from the general population that served as controls.

Materials and Methods

1. Cancer survivors

We identified UC survivors who had undergone curative surgery for PC, KC, and BC at four University Hospitals between 2011 and 2013. Inclusion criteria for the study were as follows: (1) patients aged ≥ 50 years, (2) those who were diagnosed with one of the three types of UCs after undergoing curative surgery, and (3) those without any evidence of recurrence for at least 1 year after surgery [5]. Although QoL may decline considerably after active cancer treatment and remain low for a short period thereafter, many side effects are acute and short-lived, and the majority of disease-free cancer survivors report good QoL 1-year post-treatment [5]. A total of 374 patients were selected during their regular visits to their urologists at outpatient clinics between April 2014 and December 2015. Exclusion criteria were (1) patients with other primary cancers (n=17), (2) patients with metastatic disease (n=1), and (3) patients aged < 50 years or those with difficulties in communication due to mental or cognitive impairment (n=25). Thus, our study population comprised 331 UC survivors (114 PC, 108 KC, and 109 BC). None of UC survivors underwent adjuvant or salvage treatment after curative surgery.
To determine the general HRQoL in each UC survivors following various surgical methods that are used in clinical practice, we did not confine our study to any particular type of surgery, if it was performed with curative intent. For example, while all PC survivors had been treated with a radical prostatectomy (RP: 18 open, 92 robot-assisted, and 4 laparoscopic), KC survivors had been treated with a radical nephrectomy (65 patients [60.2%]: 29 open, 3 robot-assisted, and 33 laparoscopic) or a partial nephrectomy (43 patients [39.8%]: 18 open, 17 robot-assisted, and 8 laparoscopic). Among the BC survivors, 68 (62.4%), 23 (21.1%), 15 (13.8%), and three (2.7%) patients, respectively, underwent transurethral resection of bladder tumor, radical cystectomy with ileal conduit, neobladder reconstruction, and cutaneous diversion, respectively. UC survivors who consented to participate in our study were instructed to complete the survey questionnaire, and assistance was provided to them if they had difficulties in understanding the questionnaire items or had visual difficulties.

2. Control subjects

The general population comprised respondents of the nation-wide survey, which was performed between November and December 2012. The survey has been described in detail by previous reports [6,7]. The questionnaire included HRQoL, perceived social support, and depression, as well as sociodemographic and medical information pertaining to the participants. To ensure representativeness of the sample, a stratified probability sampling using a two-stage systematic sampling method was employed—after stratifying the population based on region, we systematically extracted samples based on the population ratio. The sampling error within a 95% confidence interval was ±2.2%. The participants were limited to those who were within an age range of 40-70 years (considering the purpose of the study) and those without a history of cancer. Trained interviewers from a professional research company visited the identified households to check/identify candidates eligible for participation.
Among 4,851 eligible individuals who were contacted, 2,000 individuals without cancer consented to participate in the study and completed the survey questionnaire (response rate, 41.2%). The primary reasons for non-participation were lack of time (54%), concern about privacy (25%), and inconvenience (17%).
For the comparison with the UC survivors (age range 50-96 years based on enrollment) and general population (age range 40-70 years based on inclusion criteria), we limited the age of the study population to 50-70 years. Thus, 1,176 individuals without cancer were included in the comparison. The number of UC survivors who were included in the comparison with control was 63 for PC, 84 for KC, and 69 for BC, respectively.

3. Instruments to measure quality of life

We used three valid and reliable questionnaires—the European Organization for Research and Treatment of Cancer (EORTC QLQ-C30), the Duke-UNC Functional Social Support Questionnaire (FSSQ) and the Patient Health Questionniare-9 (PHQ-9) to assess diverse aspects of general HRQoL among UC survivors.

1) Quality of Life

The EORTC QLQ-C30 is a 30-item questionnaire to assess the HRQoL of cancer patients [8,9] and includes five functional scales (physical, role, emotional, cognitive, and social), three symptom scales (fatigue, nausea and vomiting, and pain), global health status, and six single items (dyspnea, sleep disturbance, appetite loss, constipation and diarrhea, and financial difficulties). Participants responded to items using the 4-point Likert scale with responses varying from 1 (not at all) to 4 (very much), and two items of the global health/QoL scale were assessed using a 7-point Likert scale. The domain scores were calculated based on the EORTC QLQ-C30 scoring manual, and its Korean version was validated [9].

2) Perceived social support

The Duke-UNC FSSQ was used to measure each individual’s perception of the degree and type of social support available/received [10]. The Korean version of the Duke-UNC FSSQ demonstrated high reliability and moderate validity [11]. Eight items from the Duke-UNC FSSQ comprising two sub-scales (Confidant and Affective support) were used to calculate the mean social support score [12]. The Confidant support sub-scale (comprising 5 items) assesses confidant support, i.e., support from those who are identified as a confidant with whom important life matters are discussed and shared. The Affective support sub-scale (comprising 3 items) assesses the general emotional support and care from family and friends. Responses to each question are scored on a 5-point scale, yielding a total score between 8 and 40. Higher scores suggest higher levels of perceived social support.

3) Depressive symptoms

The PHQ-9 is a 9-item self-report questionnaire designed to screen, diagnose, monitor, and assess the severity of depression [13]. The validity of the PHQ-9 is established among the Korean population [14]. For each item, patients rate the severity of their symptoms that are noted over 2 weeks prior to the assessment. The items pertain to a loss of interest, depressed mood, changes in sleep, energy, appetite, or eating habits, feelings of guilt or worthlessness, levels of concentration, feelings of being slowed down or restlessness, and suicidal ideation. Each item is rated on a 4-point Likert scale from 0 (not at all) to 3 (nearly every day).

4. Statistical analysis

The characteristics of UC survivors and the general population have been presented as numbers and means. We performed the analysis in a systematic manner: (1) initially, we analyzed the differences in HRQoL, perceived social support, and depression among the three groups of UC survivors using the analysis of covariance (ANCOVA) after adjusting for age, sex, Surveillance, Epidemiology, and End Results (SEER, https://seer.cancer.gov/) cancer summary stage, time interval since initiation of treatment, education level, employment status, smoking status, and alcohol consumption. (2) Next, survivors with each type of UC were compared with the general population that was studied as the control group using the ANCOVA for all the above-mentioned covariates except the SEER cancer summary stage, and time since initiation of treatment, which were not relevant to the control group. (3) Comparison with non-cancer controls was repeated after categorization of UC survivors into the short-term (1-2 years) and long-term (> 2 years) categories for each type of cancer [15]. All statistical analyses were performed using the STATA ver. 14.0 software (Stata Corp., College Station, TX).

5. Ethics statement

The study protocol was approved by the Institutional Review Board of the Eulji University Hospital (No. 2014-03-002) and the National Cancer Center (IRB No. NCCNCS-12-635). All participants were fully informed as to the purpose of the study and provided written consent.

Results

1. Characteristics of UC survivors and general population non-cancer control

Table 1 summarizes the sociodemographic and medical factors of UC survivors. Mean age was 66.5 years, 86.7% were men, 86.4% were married, and 58.6% reported high school level of educational qualifications or higher. Approximately 50% of the UC survivors reported a household income of ≥ 200 million Korean Won (1 USD=1,150 KRW as of year 2016), and approximately 50% reported being currently employed. We observed that 14.2% reported current smoking and 45.6% reported current alcohol consumption. Most tumors were localized (90.6%). Approximately 50% of UC survivors were at the 1- to 2-year time point after treatment, and only 16.6% were at a time point > 5 years after cancer treatment. Table 2 shows the sociodemographic factors pertaining to UC survivors and general population non-cancer controls, whose age was between 50 and 70 years. The general population group was significantly younger, showed higher educational and income levels and a higher tendency to engage in smoking and drinking behaviors.

2. Comparison of HRQoL, FSSQ, and depression among survivors of the three major types of UC

No significant difference was observed between the PC, KC, and BC survivor groups with respect to all domains of the EORTC QLQ-C30 functioning and symptom scales, except for a slight but significant difference in social functioning between KC and BC survivors (89.5 vs. 80.6, respectively; p=0.021). The three groups did not significantly differ in terms of functional social support or depression (Table 3).

3. Comparison of HRQoL between PC, KC, and BC survivors and the general population

When compared to the non-cancer general population, PC and BC survivors showed significantly lower social functioning and a lower appetite. KC survivors showed lower physical functioning, as well as higher pain and dyspnea symptoms. All three groups of UC survivors reported higher financial difficulties but also higher perceived social support than that reported by non-cancer controls (Table 4). There was no significant difference in depressive symptoms between each group of UC survivors and the general population (Table 4).
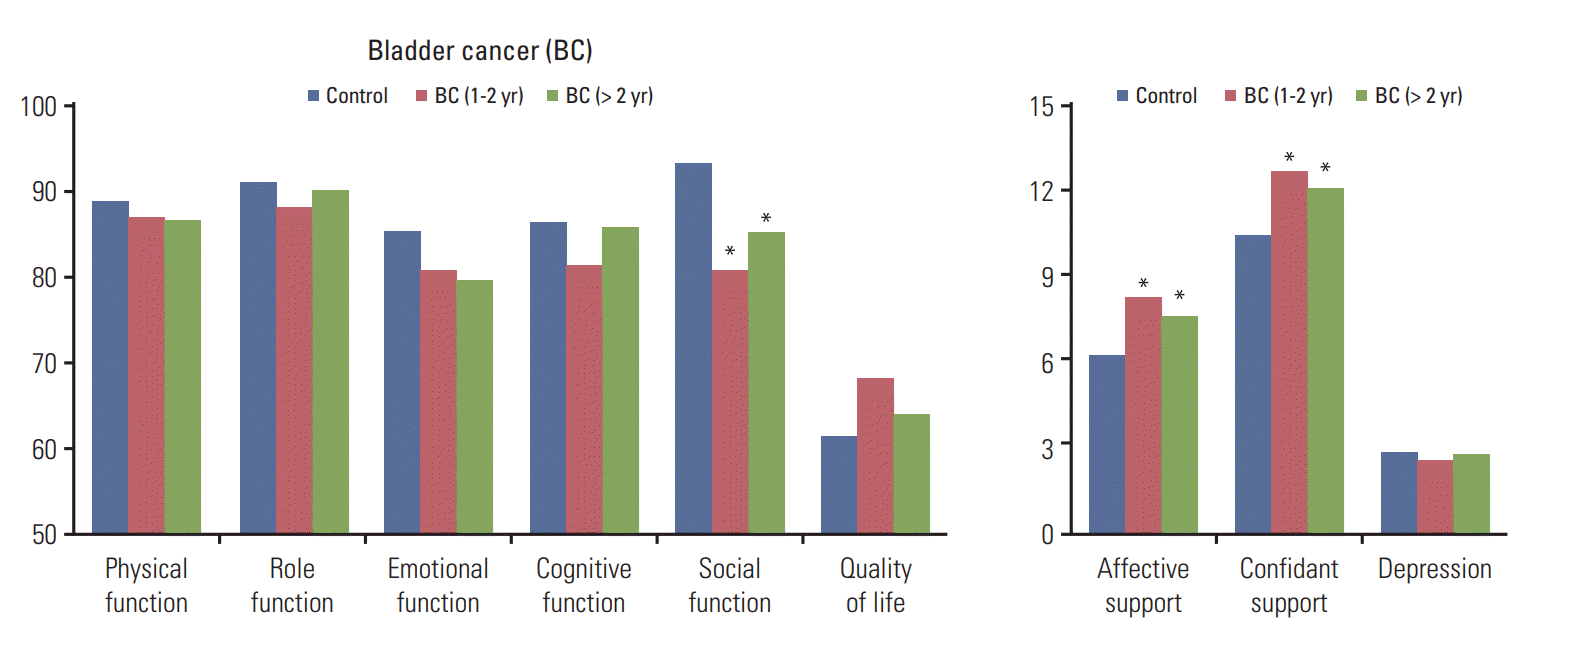
When examined by time elapsed from curative surgery, varying patterns were noted based on the type of cancer (Fig. 1). PC survivors showed significantly diminished social functioning > 2 years postsurgery, whereas other functioning scales and QoL did not significantly differ from the control group over time. Perceived social support was greater during the short-term survivorship period; however, it decreased thereafter. KC survivors showed decreased short-term physical, role, and social functioning, which did recover thereafter. QoL of KC survivors improved over time and it was significantly better than controls > 2 years postsurgery, whereas perceived social support significantly increased after surgery and was sustained > 2 years postsurgery. BC survivors showed significantly diminished social function, which did not recover > 2 years postsurgery. Perceived social support of BC survivors significantly increased during the short-term survivorship period and was sustained thereafter. There were no statistically significant differences in terms of emotional and cognitive function, as well as depressive symptoms among the three UC survivor groups, regardless of the time elapsed from surgery (Fig. 1).

Discussion

To our knowledge, this is the first study to compare the general QoL issues among disease-free survivors of the three most common UCs and between each group of UC survivors and the general population in terms of HRQoL, perceived social support, and depression.
In our study, in broad terms, we did not observe significant differences in functioning sub-scales and symptoms, functional social support, and depression among the three groups of UC survivors, or when these groups were compared to the general population. This finding indicates that the general HRQoL observed in disease-free UC survivors is usually not compromised, as opposed to the changes observed with respect to disease-specific domains of HRQoL. This suggests that UC survivors can enjoy a QoL comparable to that of the general population and should be encouraged to resume their usual normal personal and social activities. An exception observed in this study was the significantly lower social functioning noted among BC survivors than that noted among KC survivors (Table 3). In our study, approximately one-third of BC survivors underwent a radical cystectomy with urinary diversion, and this may contribute, at least in part, to the limitations in social activities demonstrated in this group, as shown by previous studies [16].
Compared to non-cancer controls, PC survivors showed lower social functioning (Table 4), which seemed to worsen > 2 years postsurgery (Fig. 1). A German study has reported that social functioning among PC survivors who underwent RP was significantly lower than that observed in the general population, whereas other EORTC QLQ-C30 scales were similar to those observed in controls—a finding that is in agreement with that observed in our study [17]. Although urinary incontinence improves gradually over time after RP and recovers to baseline status approximately at 1-year postsurgery in most PC survivors, a few (approximately 10%) of survivors continue to report urinary symptoms and incontinence even > 2 years post-RP [18]. The fear and embarrassing prospect of urine leakage, and the odor of urine associated with incontinence, as well as the need for diapers is humiliating to some PC survivors, which may interfere with their social life resulting in social withdrawal [19]. Additionally, sexual dysfunction can reduce sexual intimacy with partners and may affect family life, resulting in diminished social functioning [19]. Notably, sexual function declines in a majority of PC survivors after surgery and continues to show alterations in a significant percentage of them even > 2 years post-RP [18,20]. We consider that worsening social functioning > 2 years postsurgery observed in PC survivors can be understood in such a disease-specific context.
KC survivors showed significantly lower physical functioning than that observed in the general population. To date, only two studies [21,22] have compared HRQoL between KC survivors and non-cancer controls and have reported conflicting results: a study performed in the United States [21] using the 36-Item Short Form Health Survey (SF-36) and the RAND-12 questionnaire (vs. the EORTC QLQ-C30 used in our study) showed no significant differences in the HRQoL between the two study groups, and a Norwegian study [22] showed that KC survivors, particularly those undergoing surgery via an open or a flank approach, showed a lower HRQoL including a significantly higher pain score than that observed in the general population [22]. Our study also showed higher pain and dyspnea symptoms among KC survivors (among these, 43.5% [47/108] underwent open surgery). In terms of the time elapsed from the time of curative surgery until assessment (Fig. 1), KC survivors showed diminished physical, role, and social functioning in the shortterm (1-2 years postsurgery); however, this finding was observed to resolve over time indicating that KC survivors have the capacity to positively adapt themselves to challenges that they face after cancer diagnosis and treatment. We reckon that this may be a possible explanation for the significantly higher QoL noted in KC survivors > 2 years postsurgery than that observed in controls.
BC survivors showed significantly lower social functioning than that observed in the general population (Table 4), similar to the results noted in PC survivors. Interestingly, compromised social function observed among BC survivors was more evident 1-2 years postsurgery, which did not completely recover thereafter (Fig. 1). BC survivors, particularly those who underwent a radical cystectomy (one-third of the BC population) reported urinary incontinence and sexual dysfunction, which might significantly contribute to lower social functioning. A Japanese study [16] reported that patients undergoing radical cystectomy, regardless of the procedure performed (neobladder reconstruction vs. ileal conduit) showed significantly lower social functioning than that observed in the general population of the United States, similar to the results of our study.
Of note, changes in social functioning noted postoperatively was a finding common to all three UC groups, although the pattern of change showed marginal differences between groups based on the type of cancer. Thus, clinicians should be mindful of changes in social functioning among UC survivors and consider appropriate supportive measures such as group education [23] and psychosocial intervention [24] to minimize compromised social functioning.
UC survivors reported significantly higher levels of perceived social support than that reported by the non-cancer control group, which is consistent with the literature [25]. Cancer survivors usually receive greater encouragement and supportive care from friends, colleagues, and family members than would be expected in the general population. However, perceived social support among PC survivors was observed to have worsened > 2 years postsurgery, as opposed to that observed among KC or BC survivors. The reasons for this difference in pattern are unknown, although it could be related to lower sexual functioning noted even > 2 years postsurgery among PC survivors.
We noted that the depression score measured by the PHQ-9 did not show any statistically significant difference in all the analyses performed, suggesting that the occurrence of depression is not significantly different in disease-free UC survivors, compared to non-cancer general population. However, a recent systematic review reported the prevalence of post-treatment depression in PC survivors to be as high as 18.4% [26], and the prevalence of major depressive disorder among PC or BC survivors was higher than that observed among survivors with breast or colorectal cancer in a nation-wide Korean study population [27], although these studies did not compare cancer survivors with controls from the general population. Given the paucity of research regarding depression among UC survivors, further studies are warranted to specifically determine an association, if any, between UC and its treatment and occurrence of depression in this population.
Limitations of our study are as follows: (1) because ours was a cross-sectional study, we were unable to assess HRQoL changes presurgery and postsurgery. Thus, our interpretation regarding HRQoL in terms of time elapsed from surgery may have been biased. (2) The relatively small sample size of our study is another limitation. Potential differences could not be detected due to low statistical power, and comparison of HRQoL according to the type of surgery was difficult due to the same reason. (3) Because our results came from only UC survivors who underwent curative surgery, our results cannot be generalized to overall PC, KC, and BC survivors. Despite these limitations, we reckon that our results analyzing general QoL, perceived social support, and depression reflect the overall HRQoL aspects associated with UC survivors and would help to provide greater insight into the critical QoL issues among UC survivors.
In conclusion, although general QoL issues were observed to be essentially similar among disease-free survivors of the 3 major types of UCs, a few differences were observed between these groups based on the type of cancer. BC in both short-and long-term and, to a lesser degree, PC survivors in the long-term demonstrated lower social functioning than non-cancer control, potentially associated with a non-sustained level of perceived social support. In contrast, KC survivors demonstrated lower physical functioning than non-cancer control in the short-term, perhaps associated with complaints of increased pain and dyspnea commonly noted during this period. No significant difference was observed in depressive symptoms between each group of UC survivors and the general population. Further studies with larger sample sizes and a longitudinal follow-up design would be required in this context. Our results will be useful to both urologists and patients because they provide information regarding the general QoL among UC survivors postsurgery and would help to plan for future supportive care needs.

Notes

Conflict of interest relevant to this article was not reported.

References

1. Jung KW, Won YJ, Oh CM, Kong HJ, Lee DH, Lee KH, et al. Cancer statistics in Korea: incidence, mortality, survival, and prevalence in 2014. Cancer Res Treat. 2017; 49:292–305.
crossref
2. Joung JY, Lim J, Oh CM, Jung KW, Cho H, Kim SH, et al. Current trends in the incidence and survival rate of urological cancers in Korea. Cancer Res Treat. 2017; 49:607–15.
crossref
3. Siegel RL, Miller KD, Jemal A. Cancer statistics, 2016. CA Cancer J Clin. 2016; 66:7–30.
crossref
4. Quaresma M, Coleman MP, Rachet B. 40-year trends in an index of survival for all cancers combined and survival adjusted for age and sex for each cancer in England and Wales, 1971-2011: a population-based study. Lancet. 2015; 385:1206–18.
crossref
5. Miller KD, Siegel RL, Lin CC, Mariotto AB, Kramer JL, Rowland JH, et al. Cancer treatment and survivorship statistics, 2016. CA Cancer J Clin. 2016; 66:271–89.
crossref
6. Kim S, Shin DW, Yang HK, Kim SY, Ko YJ, Cho B, et al. Public perceptions on cancer incidence and survival: a nation-wide survey in Korea. Cancer Res Treat. 2016; 48:775–88.
crossref
7. Yoo H, Shin DW, Jeong A, Kim SY, Yang HK, Kim JS, et al. Perceived social support and its impact on depression and health-related quality of life: a comparison between cancer patients and general population. Jpn J Clin Oncol. 2017; 47:728–34.
crossref
8. Aaronson NK, Ahmedzai S, Bergman B, Bullinger M, Cull A, Duez NJ, et al. The European Organization for Research and Treatment of Cancer QLQ-C30: a quality-of-life instrument for use in international clinical trials in oncology. J Natl Cancer Inst. 1993; 85:365–76.
crossref
9. Yun YH, Park YS, Lee ES, Bang SM, Heo DS, Park SY, et al. Validation of the Korean version of the EORTC QLQ-C30. Qual Life Res. 2004; 13:863–8.
crossref
10. Broadhead WE, Gehlbach SH, de Gruy FV, Kaplan BH. The Duke-UNC Functional Social Support Questionnaire: measurement of social support in family medicine patients. Med Care. 1988; 26:709–23.
11. Suh SY, Im YS, Lee SH, Park MS, Yoo T. A study for the development of Korean version of the Duke-UNC functional social support questionnaire. J Korean Acad Fam Med. 1997; 18:250–60.
12. Broadhead WE, Kaplan BH. Social support and the cancer patient. Implications for future research and clinical care. Cancer. 1991; 67(3 Suppl):794–9.
crossref
13. Kroenke K, Spitzer RL, Williams JB. The PHQ-9: validity of a brief depression severity measure. J Gen Intern Med. 2001; 16:606–13.
14. Han C, Jo SA, Kwak JH, Pae CU, Steffens D, Jo I, et al. Validation of the Patient Health Questionnaire-9 Korean version in the elderly population: the Ansan Geriatric study. Compr Psychiatry. 2008; 49:218–23.
crossref
15. Stanton AL, Rowland JH, Ganz PA. Life after diagnosis and treatment of cancer in adulthood: contributions from psychosocial oncology research. Am Psychol. 2015; 70:159–74.
crossref
16. Hara I, Miyake H, Hara S, Gotoh A, Nakamura I, Okada H, et al. Health-related quality of life after radical cystectomy for bladder cancer: a comparison of ileal conduit and orthotopic bladder replacement. BJU Int. 2002; 89:10–3.
crossref
17. Bestmann B, Loetters C, Diemer T, Weidner W, Kuchler T, Rohde V. Prostate-specific symptoms of prostate cancer in a German general population. Prostate Cancer Prostatic Dis. 2007; 10:52–9.
crossref
18. Parker WR, Wang R, He C, Wood DP Jr. Five year expanded prostate cancer index composite-based quality of life outcomes after prostatectomy for localized prostate cancer. BJU Int. 2011; 107:585–90.
crossref
19. Roth AJ, Weinberger MI, Nelson CJ. Prostate cancer: psychosocial implications and management. Future Oncol. 2008; 4:561–8.
crossref
20. Prabhu V, Lee T, McClintock TR, Lepor H. Short-, intermediate-, and long-term quality of life outcomes following radical prostatectomy for clinically localized prostate cancer. Rev Urol. 2013; 15:161–77.
21. Kent EE, Ambs A, Mitchell SA, Clauser SB, Smith AW, Hays RD. Health-related quality of life in older adult survivors of selected cancers: data from the SEER-MHOS linkage. Cancer. 2015; 121:758–65.
crossref
22. Beisland C, Beisland E, Hjelle KM, Bostad L, Hjermstad MJ, Aarstad AK, et al. Health-related quality of life in long-term survivors after renal cancer treatment. Scand J Urol. 2014; 48:52–64.
crossref
23. Lepore SJ, Helgeson VS, Eton DT, Schulz R. Improving quality of life in men with prostate cancer: a randomized controlled trial of group education interventions. Health Psychol. 2003; 22:443–52.
crossref
24. Parahoo K, McDonough S, McCaughan E, Noyes J, Semple C, Halstead EJ, et al. Psychosocial interventions for men with prostate cancer: a Cochrane systematic review. BJU Int. 2015; 116:174–83.
crossref
25. Schroevers MJ, Ranchor AV, Sanderman R. The role of social support and self-esteem in the presence and course of depressive symptoms: a comparison of cancer patients and individuals from the general population. Soc Sci Med. 2003; 57:375–85.
crossref
26. Watts S, Leydon G, Birch B, Prescott P, Lai L, Eardley S, et al. Depression and anxiety in prostate cancer: a systematic review and meta-analysis of prevalence rates. BMJ Open. 2014; 4:e003901.
crossref
27. Park B, Youn S, Yi KK, Lee SY, Lee JS, Chung S. The prevalence of depression among patients with the top ten most common cancers in South Korea. Psychiatry Investig. 2017; 14:618–25.
crossref

Fig. 1.
Comparison of health-related quality of life, functional social support, and depression between non-cancer control and survivors of three major types of urological cancer by time elapsed from the cancer treatment. *p < 0.05 as compared to control.
crt-2018-053f1.tif
Table 1.
Characteristics of urological cancer survivors (age ≥ 50)
Prostate cancer (n=114) Kidney cancer (n=108) Bladder cancer (n=109) All cancers (n=331)
Age (yr) 68.4±7.1 63.1±9.1 68.0±9.2 66.5±8.8
Sex
 Male 114 (100) 77 (71.3) 96 (88.1) 287 (86.7)
 Female 0 31 (28.7) 13 (11.9) 44 (13.3)
Marital status
 Unmarried 14 (12.3) 13 (12.0) 17 (15.6) 44 (13.3)
 Married 99 (86.8) 95 (88.0) 92 (84.4) 286 (86.4)
Education
 < High school 52 (45.6) 36 (33.3) 45 (41.3) 133 (40.2)
 ≥ High school 62 (54.4) 69 (63.9) 63 (57.8) 194 (58.6)
Income (KRW)
 < 200 million 60 (52.6) 51 (47.2) 67 (61.5) 178 (53.8)
 ≥ 200 million 54 (47.4) 54 (50.0) 40 (36.7) 148 (44.7)
Job status
 Unemployed 52 (45.6) 52 (48.2) 52 (47.7) 156 (47.1)
 Employed 62 (54.4) 53 (49.1) 56 (51.4) 171 (51.7)
Smoking
 Non or past 103 (90.4) 88 (81.5) 93 (85.3) 284 (85.8)
 Current 11 (9.7) 20 (18.5) 16 (14.7) 47 (14.2)
Drinking
 Non or past 62 (54.4) 71 (66.5) 61 (57.6) 194 (59.3)
 Current 52 (45.6) 36 (33.6) 45 (45.4) 133 (40.6)
SEER stage
In situ or localized 95 (83.3) 103 (95.4) 102 (93.6) 300 (90.6)
 Regional 19 (16.7) 5 (4.6) 7 (6.4) 31 (9.4)
Time since treatment (yr)
 1-2 66 (57.9) 39 (36.1) 48 (44.0) 153 (46.2)
 2-5 39 (34.2) 40 (37.0) 44 (40.4) 123 (37.2)
 > 5 9 (7.9) 29 (26.9) 17 (15.6) 55 (16.6)

Values are presented as mean±standard deviation or number (%). Numbers may not sum to total number due to missing responses

Table 2.
Characteristics of urological cancer survivors and general population for comparison with non-cancer control (age 50-70)
General population (n=1,176) All cancers (n=216) p-value Prostate cancer (n=63) Kidney cancer (n=84) Bladder cancer (n=69)
Age (yr) 57.8±5.4 61.5±6 < 0.001 63.4±5.1 59.1±5.7 62.6±6.3
Sex
 Male 568 (48.3) 184 (85.2) < 0.001 63 (100) 59 (70.2) 62 (89.9)
 Female 608 (51.7) 31 (14.4) 0 24 (28.6) 7 (10.1)
Marital status
 Unmarried 67 (5.7) 23 (10.6) 0.001 6 (9.5) 8 (9.5) 9 (13.0)
 Married 1,109 (94.3) 191 (88.4) 56 (88.9) 75 (89.3) 60 (87.0)
Education
 Less than high school 314 (26.7) 73 (33.8) < 0.001 29 (46.0) 26 (31.0) 18 (26.1)
 High school and above 862 (73.3) 139 (64.4) 34 (54.0) 54 (64.3) 51 (73.9)
Income (KRW)
 < 200 million 287 (24.4) 93 (43.1) < 0.001 26 (41.3) 32 (38.1) 35 (50.7)
 ≥ 200 million 889 (75.6) 118 (54.6) 37 (58.7) 48 (57.1) 33 (47.8)
Job status
 Unemployed 406 (34.5) 85 (39.4) 0.001 24 (38.1) 34 (40.5) 27 (39.1)
 Employed 770 (65.5) 128 (59.3) 39 (61.9) 47 (56.0) 42 (60.9)
Smoking
 Non or past 858 (73.0) 179 (82.9) 0.001 58 (92.1) 65 (77.4) 56 (81.2)
 Current 318 (27.0) 36 (16.7) 5 (7.9) 18 (21.4) 13 (18.8)
Drinking
 Non or past 398 (33.8) 119 (55.1) 0.001 30 (47.6) 51 (60.7) 38 (55.1)
 Current 778 (66.2) 94 (43.5) 33 (52.4) 31 (36.9) 30 (43.5)

Values are presented as mean±standard deviation or number (%). Numbers may not represent sum of total number due to missing responses. p-value (calculated by t test and chi-square test) represents comparison between general population and all urological cancer survivors.

Table 3.
Comparison of health-related quality of life, functional social support, and depression among survivors of three major types of urological cancer
Prostate cancer (n=114)
Kidney cancer (n=108)
Bladder cancer (n=109)
p-value for difference
Adj. mean SE Adj. mean SE Adj. mean SE PC vs. KC PC vs. BC KC vs. BC
EORTC QLQ C-30
 Functioning scales
  Physical functioning 85.0 1.6 83.5 1.8 81.4 1.6 0.838 0.257 0.670
  Role functioning 86.4 2.0 88.7 2.3 82.9 2.0 0.763 0.439 0.148
  Emotional functioning 82.4 1.9 85.2 2.0 82.2 1.8 0.636 0.997 0.558
  Cognitive functioning 82.5 1.7 82.5 1.9 81.6 1.7 1.000 0.937 0.940
  Social functioning 86.8 2.2 89.5 2.4 80.6 2.1 0.712 0.111 0.021*
 Overall quality of life 57.7 2.4 64.0 2.6 62.9 2.3 0.234 0.272 0.949
 Symptom scales
  Fatigue 26.4 2.1 23.4 2.3 25.5 2.0 0.636 0.950 0.774
  Nausea and vomiting 2.3 0.9 3.5 1.0 4.5 0.9 0.690 0.195 0.748
  Pain 8.9 2.0 11.5 2.2 14.7 2.0 0.704 0.109 0.569
  Dyspnea 13.5 2.1 16.4 2.3 13.9 2.1 0.683 0.988 0.735
  Sleep disturbance 21.6 2.7 15.8 3.0 21.1 2.6 0.370 0.990 0.394
  Appetite loss 10.4 1.9 6.5 2.1 9.2 1.8 0.402 0.894 0.606
  Constipation 18.4 2.7 14.6 2.9 21.0 2.6 0.660 0.756 0.256
  Diarrhea 9.2 2.0 11.9 2.2 13.5 1.9 0.685 0.286 0.864
  Financial difficulties 17.4 2.7 19.4 3.0 20.6 2.7 0.890 0.685 0.959
Functional social support
 Affective support 7.1 0.3 6.9 0.4 7.6 0.3 0.870 0.586 0.321
 Confidant support 11.2 0.5 10.7 0.6 12.0 0.5 0.831 0.621 0.305
Depression 3.8 0.4 2.8 0.4 3.3 0.4 0.315 0.646 0.751

Adj. mean, adjusted mean by analysis of co-variance with age, sex, Surveillance, Epidemiology, and End Results cancer stage, time since treatment, education, employment status, smoking, alcohol consumption as covariates; SE, standard error; PC, prostate cancer; KC, kidney cancer; BC, bladder cancer; EORTC QLQ C-30, European Organization for Research and Treatment of Cancer.

* p < 0.05.

Table 4.
Comparison of health-related quality of life, functional social support, and depression between survivors of three major types of urological cancer and general population non-cancer control
General population (n=1,176)
Prostate cancer (n=63)
Kidney cancer (n=84)
Bladder cancer (n=69)
Adj. mean SE Adj. mean SE p-value Adj. mean SE p-value Adj. mean SE p-value
EORTC QLQ C-30
 Functioning scales
  Physical functioning 88.9 0.4 87.0 1.9 0.752 83.2 1.6 0.003* 86.2 1.8 0.480
  Role functioning 91.2 0.5 88.4 2.1 0.619 88.0 1.8 0.350 88.9 2.1 0.725
  Emotional functioning 85.5 0.5 80.9 2.2 0.178 81.0 1.9 0.097 80.2 2.1 0.068
  Cognitive functioning 86.4 0.5 83.9 2.2 0.683 84.5 1.9 0.747 84.0 2.1 0.673
  Social functioning 93.3 0.5 85.7 2.2 0.004* 89.2 1.8 0.138 83.3 2.1 < 0.001*
 Overall quality of life 61.4 0.5 62.3 2.1 0.980 65.1 1.8 0.204 64.8 2 0.353
 Symptom scales
  Fatigue 20.8 0.5 24.2 2.4 0.523 25.9 2 0.077 22.9 2.3 0.809
  Nausea and vomiting 5.6 0.4 1.7 1.7 0.119 4.1 1.5 0.761 3.5 1.6 0.584
  Pain 8.7 0.5 6.7 2.2 0.803 15.1 1.9 0.006* 10.8 2.1 0.787
  Dyspnea 10.4 0.5 15.1 2.5 0.262 16.7 2.1 0.020* 11.8 2.4 0.941
  Sleep disturbance 14.4 0.6 13.0 2.8 0.960 17.4 2.3 0.597 18.9 2.6 0.364
  Appetite loss 11.3 0.6 4.0 2.5 0.027* 7.7 2.1 0.365 3.6 2.4 0.011*
  Constipation 12.6 0.6 16.3 2.8 0.593 17.5 2.4 0.199 14.5 2.7 0.905
  Diarrhea 9.1 0.5 11.1 2.4 0.853 11.0 2.1 0.821 13.8 2.3 0.211
  Financial difficulties 6.3 0.5 15.8 2.4 0.001* 17.4 2.1 < 0.001* 20.3 2.3 < 0.001*
Functional social support
 Affective support 6.3 0.1 7.2 0.3 0.047* 7.3 0.3 0.005* 7.9 0.3 < 0.001*
 Confidant support 10.5 0.1 11.9 0.5 0.047* 11.9 0.4 0.012* 12.4 0.5 0.001*
Depression 2.9 0.1 3.2 0.5 0.947 3.2 0.4 0.924 2.8 0.5 0.996

Adj. mean, adjusted mean by analysis of co-variance with age, sex, education, employment status, smoking, alcohol consumption as covariates; SE, standard error; EORTC QLQ C-30, European Organization for Research and Treatment of Cancer.

* p < 0.05.

TOOLS
Similar articles