Introduction
Materials and Methods
1. Data source and study population
2. Primary endpoint and covariates
3. Statistical analysis
Results
1. Patient characteristics and survival of the cohort before propensity score matching
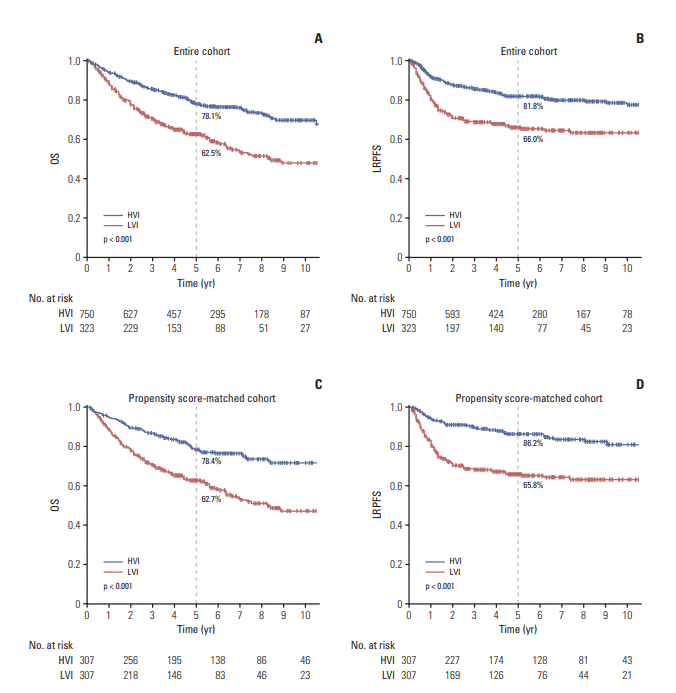
Fig. 1.

Table 1.
Values are presented as number (%). HVI, high volume institutions; LVI, low volume institutions; ECOG PS, Eastern Cooperative Oncology Group performance status; WHO, World Health Organization; MRI, magnetic resonance image; PET, positron emission tomography; 3D-CRT, three-dimensional-conformal radiotherapy; IMRT, intensity-modulated radiotherapy; CCRT, concurrent chemo-radiotherapy.
Table 2.
OS, overall survival; LRPFS, loco-regional progression-free survival; HR, hazard ratio; CI, confidence interval; ECOG PS, Eastern Cooperative Oncology Group performance status; WHO, World Health Organization; MRI, magnetic resonance image; PET, positron emission tomography; 3D-CRT, three-dimensional-conformal radiotherapy; IMRT, intensity-modulated radiotherapy; HCV, hospital case volume; HVI, high volume institutions; LVI, low volume institutions.
2. Patient characteristics and survival of the cohort after propensity score matching
Table 3.
Values are presented as number (%). HVI, high volume institutions; LVI, low volume institutions; ECOG PS, Eastern Cooperative Oncology Group performance status; WHO, World Health Organization; 3D-CRT, three-dimensional-conformal radiotherapy; IMRT, intensity-modulated radiotherapy; CCRT, concurrent chemo-radiotherapy.
Table 4.
OS, overall survival; LRPFS, loco-regional progression-free survival; HR, hazard ratio; CI, confidence interval; ECOG PS, Eastern Cooperative Oncology Group performance status; WHO, World Health Organization; 3D-CRT, three-dimensionalconformal radiotherapy; IMRT, intensity-modulated radiotherapy; HCV, hospital case volume; HVI, high volume institutions; LVI, low volume institutions.
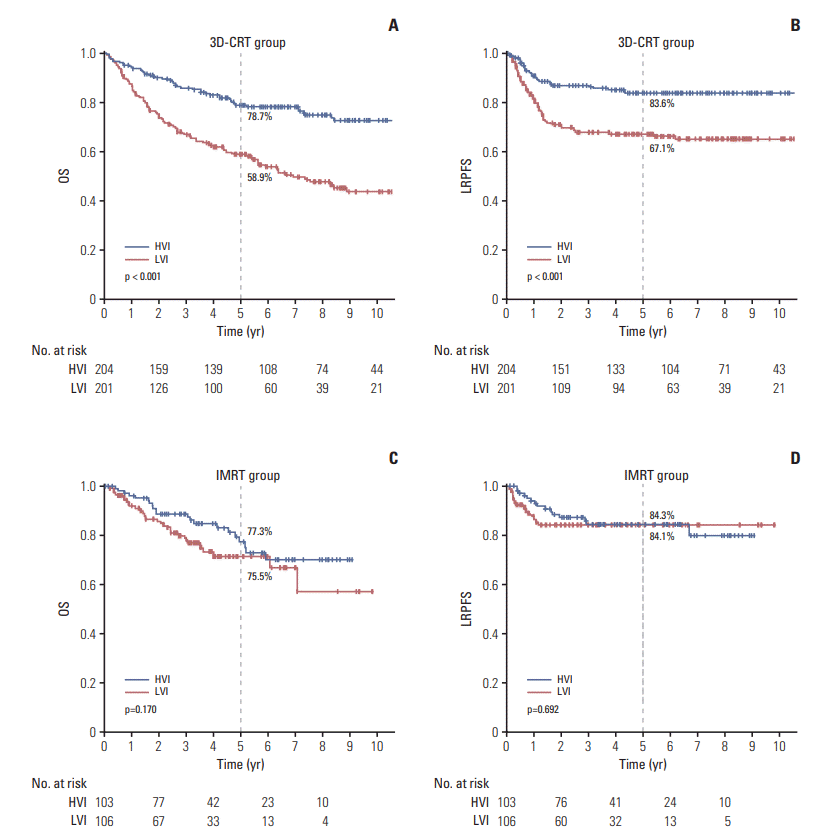
Fig. 2.

3. Toxicity
Table 5.
| HVI (n=307) | LVI (n=307) | Total (n=714) | p-value | |
|---|---|---|---|---|
| Acute toxicity | ||||
| Hematologic | ||||
| Grade 3 | 8 (2.6) | 50 (16.3) | 58 (9.5) | < 0.001a) |
| Grade 4 | 0 | 11 (3.6) | 11 (1.8) | |
| Grade 5 | 0 | 1 (0.3) | 1 (0.2) | |
| Mucositis | ||||
| Grade 3 | 34 (11.1) | 60 (20.0) | 94 (15.3) | 0.001a) |
| Grade 4 | 0 | 5 (1.6) | 5 (0.8) | |
| Xerostomia | ||||
| Grade 3 | 2 (0.7) | 27 (8.8) | 29 (4.7) | < 0.001b) |
| Skin | ||||
| Grade 3 | 12 (3.9) | 10 (3.3) | 22 (3.6) | 0.664b) |
| Late toxicity ≥ grade 3 | ||||
| Skin telangiectasia/Neck fibrosis | 5 (1.6) | 5 (1.6) | 10 (1.6) | > 0.999b) |
| Mucositis | 11 (3.6) | 8 (2.6) | 19 (3.1) | 0.484b) |
| Bone necrosis | 2 (0.7) | 1 (0.3) | 3 (0.5) | > 0.999a) |
| Carotid artery stenosis/Rupture | 2 (0.7) | 1 (0.3) | 3 (0.5) | > 0.999a) |
| Brain necrosis/Myelopathy | 4 (1.3) | 4 (1.3) | 8 (1.3) | > 0.999a) |
| CN palsy/Brachial plexopathy | 4 (1.3) | 4 (1.3) | 8 (1.3) | > 0.999a) |
| Hearing difficulty/Labyrinthitis | 2 (0.7) | 4 (1.3) | 6 (1.0) | 0.686a) |
| Dysphagia | 3 (1.0) | 1 (0.3) | 4 (0.7) | 0.624a) |
| Xerostomia (at 2 years F/U)c) | ||||
| Grade 2 | 30 (11.7) | 17 (8.0) | 47 (9.9) | 0.126a) |
| Grade 3 | 2 (0.8) | 0 | 2 (0.4) | |
| Treatment related death | 2 (0.7) | 8 (2.6) | 10 (1.6) | 0.056b) |


 PDF
PDF Citation
 Print
Print


 XML Download