Abstract
Purpose
Materials and Methods
Results
ACKNOWLEDGMENTS
Notes
The Community of Population-Based Regional Cancer Registries
Chang-Hoon Kim (Busan Cancer Registry, Pusan National University Hospital), Cheol-In Yoo (Ulsan Caner Registry, Ulsan University Hospital), Jong-Hyock Park (Chungbuk Cancer Registry, Chungbuk National University Hospital), Hae-Sung Nam (Daejeon/Chungnam Cancer Registry, Chungnam National University and Hospital), Jung-Sik Huh (Jeju Cancer Registry, Jeju National University and Hospital), Jung-Ho Youm (Chonbuk Cancer Registry, Chonbuk National University Hospital), Eurah Goh (Kangwon Cancer Registry, Kangwon National University Hospital), Nam-Soo Hong (Daegu/Gyeongbuk Cancer Registry, Kyungpook National University Medical Center), Sun-Seog Kweon (Gwangju/Jeonnam Cancer Registry, Chonnam National University Hospital), Woo-Chul Kim (Incheon Cancer Registry, Inha University Hospital), Yune-Sik Kang (Gyeongnam Cancer Registry, Gyeongsang National University & Hospital)
References
Fig. 1.
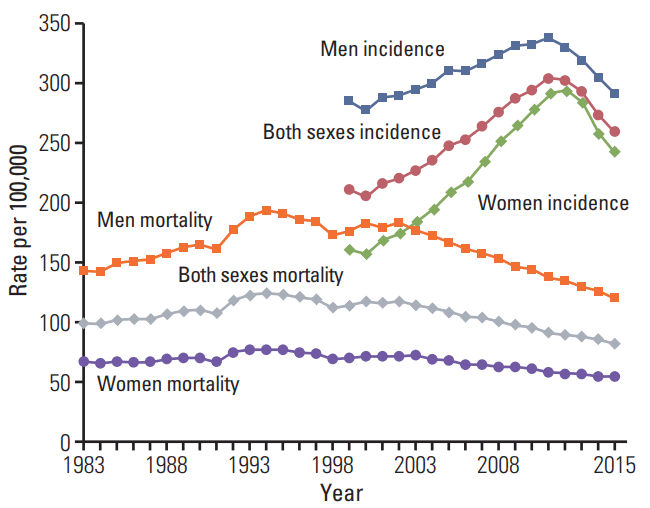
Fig. 2.
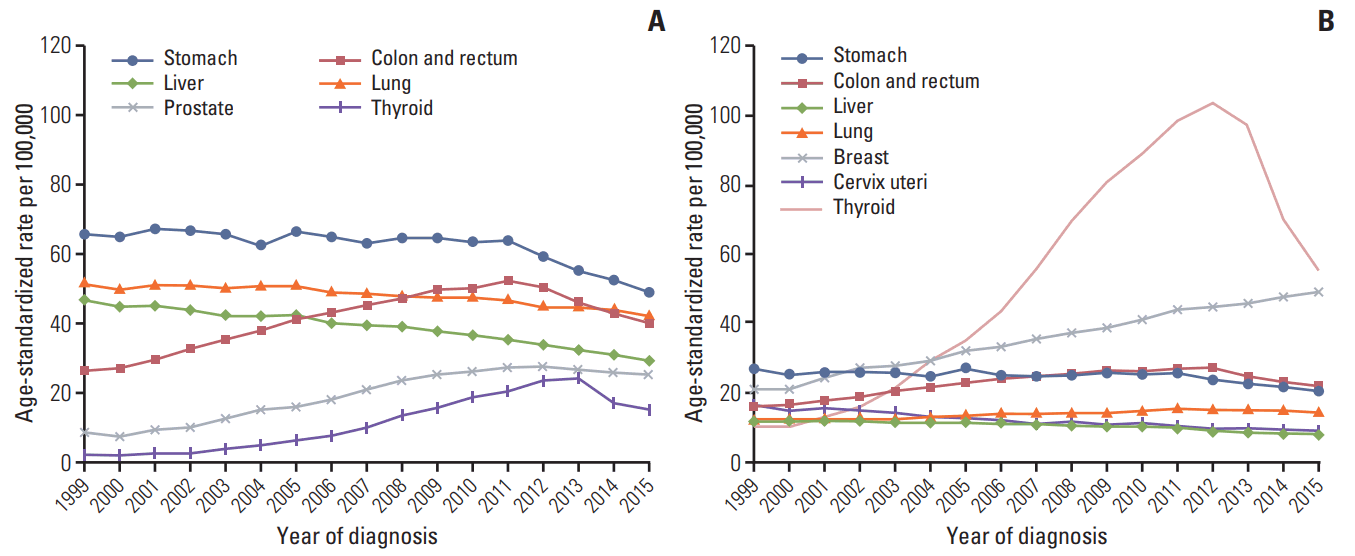
Fig. 3.
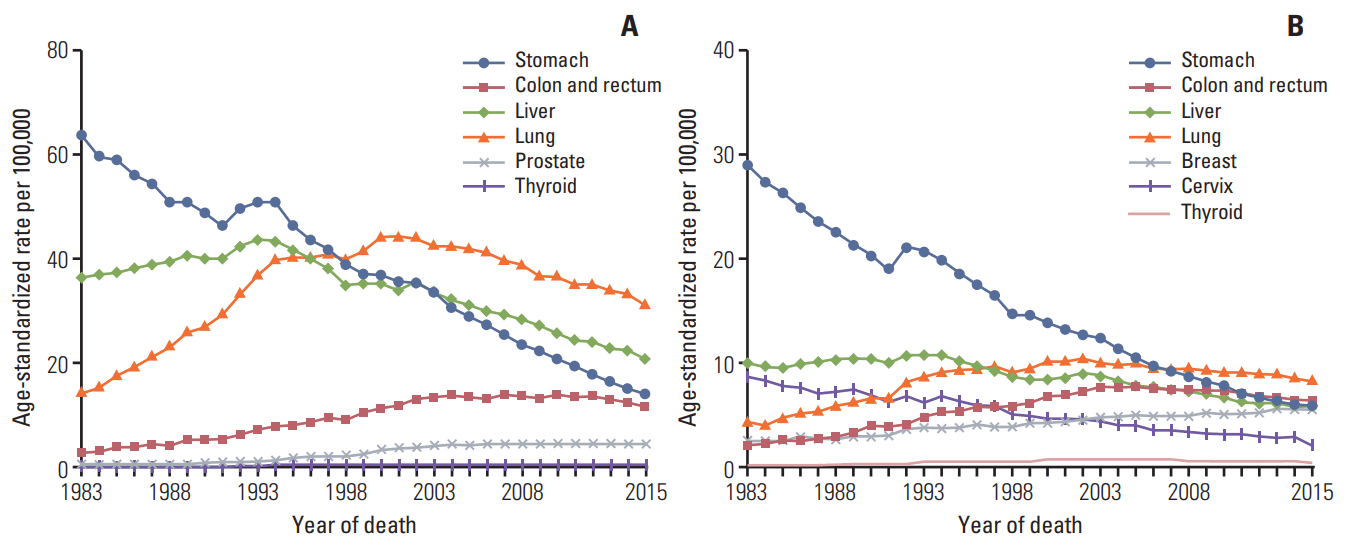
Fig. 5.
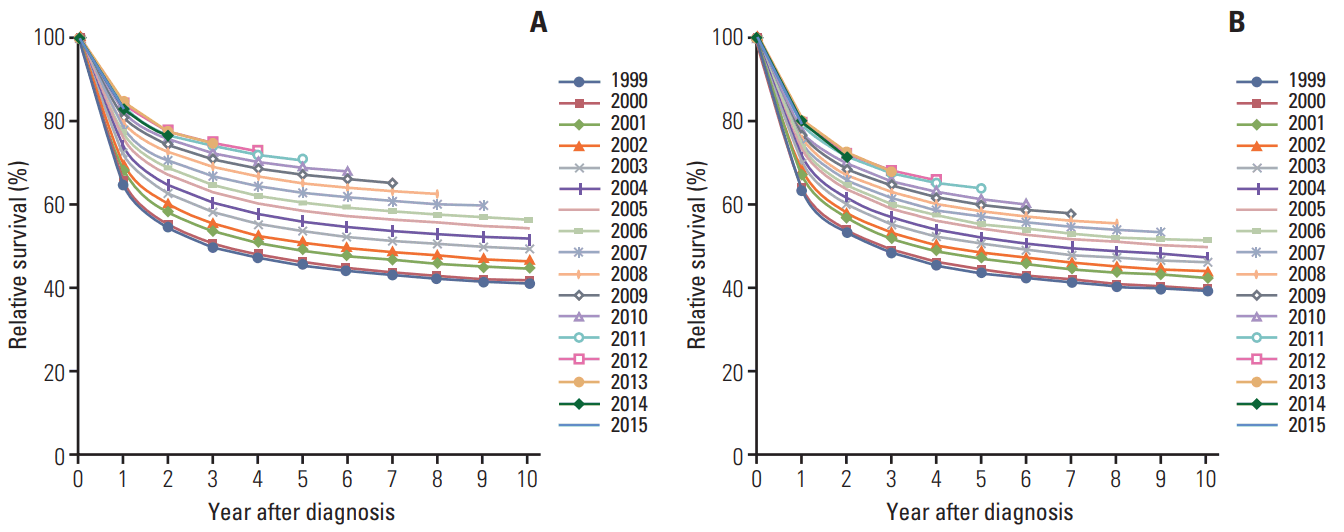
Fig. 6.
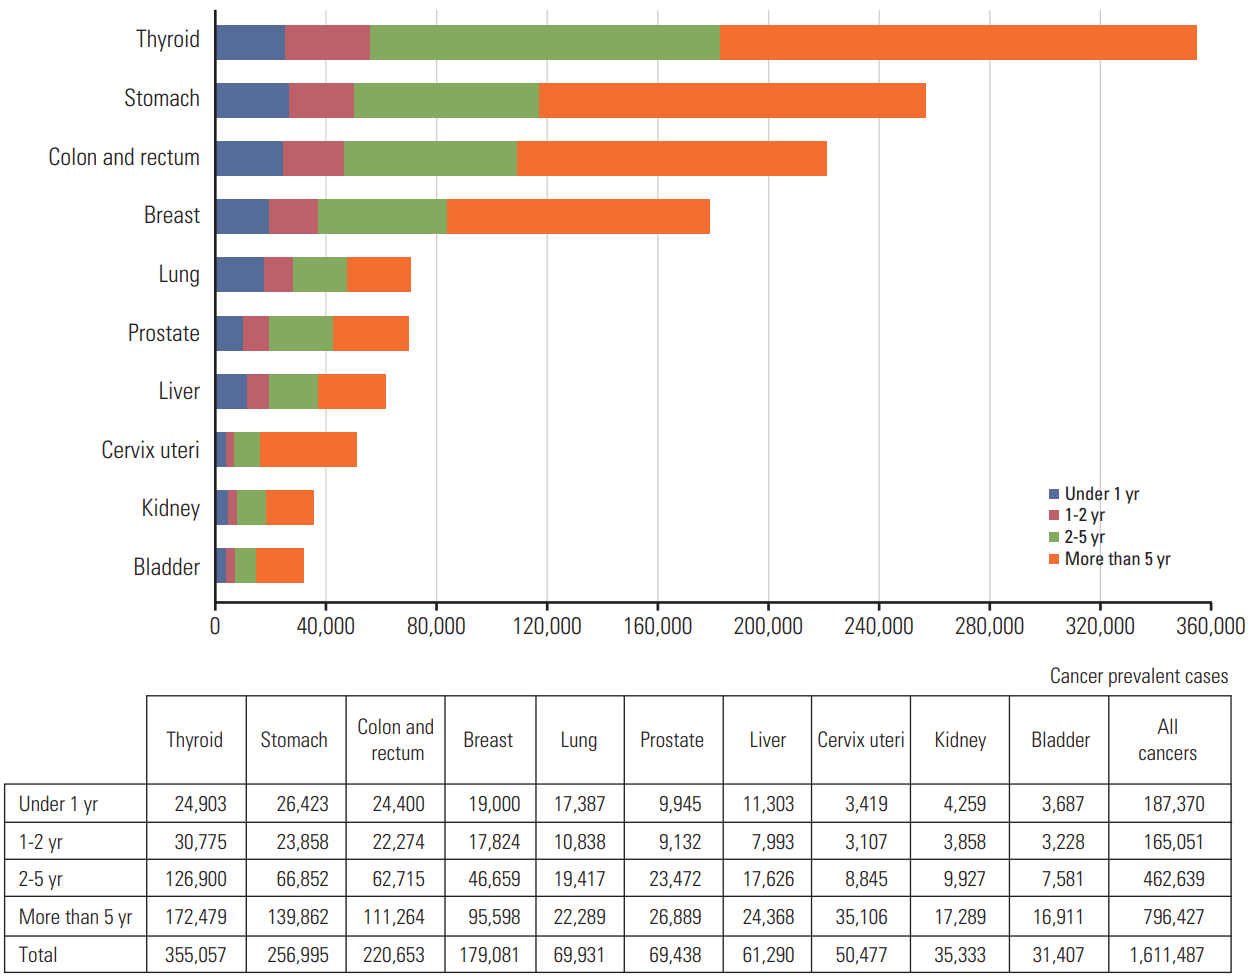
Table 1.
| Site/Type |
New cases |
Deaths |
Prevalent casesa) |
||||||
|---|---|---|---|---|---|---|---|---|---|
| Both sexes | Men | Women | Both sexes | Men | Women | Both sexes | Men | Women | |
| All sites | 214,701 | 113,335 | 101,366 | 76,855 | 47,678 | 29,177 | 1,611,487 | 707,977 | 903,510 |
| Lip, oral cavity, and pharynx | 3,309 | 2,390 | 919 | 1,170 | 884 | 286 | 21,827 | 14,656 | 7,171 |
| Esophagus | 2,420 | 2,201 | 219 | 1,531 | 1,401 | 130 | 9,171 | 8,262 | 909 |
| Stomach | 29,207 | 19,545 | 9,662 | 8,526 | 5,507 | 3,019 | 256,995 | 170,294 | 86,701 |
| Colon and rectum | 26,790 | 15,911 | 10,879 | 8,301 | 4,698 | 3,603 | 220,653 | 131,579 | 89,074 |
| Liver | 15,757 | 11,732 | 4,025 | 11,311 | 8,382 | 2,929 | 61,290 | 45,881 | 15,409 |
| Gallbladderb) | 6,251 | 3,220 | 3,031 | 4,211 | 2,135 | 2,076 | 19,468 | 9,958 | 9,510 |
| Pancreas | 6,342 | 3,359 | 2,983 | 5,439 | 2,908 | 2,531 | 9,517 | 5,031 | 4,486 |
| Larynx | 1,146 | 1,079 | 67 | 344 | 319 | 25 | 10,049 | 9,452 | 597 |
| Lung | 24,267 | 17,015 | 7,252 | 17,399 | 12,677 | 4,722 | 69,931 | 43,987 | 25,944 |
| Breast | 19,219 | 77 | 19,142 | 2,354 | 16 | 2,338 | 179,081 | 686 | 178,395 |
| Cervix uteri | 3,582 | - | 3,582 | 967 | - | 3,582 | 50,477 | - | 3,582 |
| Corpus uteri | 2,404 | - | 2,404 | 319 | - | 2,404 | 20,859 | - | 2,404 |
| Ovary | 2,443 | - | 2,443 | 1,055 | - | 2,443 | 18,112 | - | 2,443 |
| Prostate | 10,212 | 10,212 | - | 1,700 | 1,700 | - | 69,438 | 69,438 | - |
| Testis | 286 | 286 | - | 10 | 10 | - | 2,939 | 2,939 | - |
| Kidney | 4,555 | 3,134 | 1,421 | 952 | 672 | 280 | 35,333 | 23,862 | 11,471 |
| Bladder | 4,033 | 3,245 | 788 | 1,299 | 960 | 339 | 31,407 | 25,609 | 5,798 |
| Brain and CNS | 1,776 | 958 | 818 | 1,266 | 674 | 592 | 10,349 | 5,334 | 5,015 |
| Thyroid | 25,029 | 5,386 | 19,643 | 341 | 106 | 235 | 355,057 | 60,151 | 294,906 |
| Hodgkin lymphoma | 271 | 174 | 97 | 49 | 33 | 16 | 2,571 | 1,623 | 948 |
| Non-Hodgkin lymphoma | 4,396 | 2,519 | 1,877 | 1,771 | 1,026 | 745 | 27,478 | 15,622 | 11,856 |
| Multiple myeloma | 1,455 | 762 | 693 | 889 | 466 | 423 | 5,330 | 2,779 | 2,551 |
| Leukemia | 3,242 | 1,830 | 1,412 | 1,720 | 1,003 | 717 | 19,260 | 10,654 | 8,606 |
| Other and ill defined | 16,309 | 8,300 | 8,009 | 3,931 | 2,101 | 1,830 | 104,895 | 50,180 | 54,715 |
Table 2.
| Site/Type |
Crude incidence rate per 100,000 |
Age-standardized incidence rate per 100,000a) |
||||
|---|---|---|---|---|---|---|
| Both sexes | Men | Women | Both sexes | Men | Women | |
| All sites | 421.4 | 445.2 | 397.6 | 258.9 | 291.7 | 241.1 |
| Lip, oral cavity, and pharynx | 6.5 | 9.4 | 3.6 | 4.1 | 6.2 | 2.2 |
| Esophagus | 4.7 | 8.6 | 0.9 | 2.7 | 5.5 | 0.4 |
| Stomach | 57.3 | 76.8 | 37.9 | 33.8 | 49.3 | 20.5 |
| Colon and rectum | 52.6 | 62.5 | 42.7 | 30.4 | 40.2 | 22.2 |
| Liver | 30.9 | 46.1 | 15.8 | 18.2 | 29.5 | 8.2 |
| Gallbladderb) | 12.3 | 12.6 | 11.9 | 6.6 | 8.0 | 5.5 |
| Pancreas | 12.4 | 13.2 | 11.7 | 7.0 | 8.5 | 5.7 |
| Larynx | 2.2 | 4.2 | 0.3 | 1.3 | 2.7 | 0.1 |
| Lung | 47.6 | 66.8 | 28.4 | 26.4 | 42.3 | 14.3 |
| Breast | 37.7 | 0.3 | 75.1 | 24.8 | 0.2 | 49.2 |
| Cervix uteri | 7.0 | - | 14.1 | 4.6 | - | 9.1 |
| Corpus uteri | 4.7 | - | 9.4 | 3.1 | - | 6.1 |
| Ovary | 4.8 | - | 9.6 | 3.2 | - | 6.3 |
| Prostate | 20.0 | 40.1 | - | 11.2 | 25.4 | - |
| Testis | 0.6 | 1.1 | - | 0.6 | 1.1 | - |
| Kidney | 8.9 | 12.3 | 5.6 | 5.7 | 8.2 | 3.4 |
| Bladder | 7.9 | 12.7 | 3.1 | 4.3 | 8.1 | 1.5 |
| Brain and CNS | 3.5 | 3.8 | 3.2 | 2.8 | 3.1 | 2.4 |
| Thyroid | 49.1 | 21.2 | 77.1 | 35.2 | 15.1 | 55.6 |
| Hodgkin lymphoma | 0.5 | 0.7 | 0.4 | 0.5 | 0.6 | 0.4 |
| Non-Hodgkin lymphoma | 8.6 | 9.9 | 7.4 | 5.9 | 7.2 | 4.6 |
| Multiple myeloma | 2.9 | 3.0 | 2.7 | 1.6 | 1.9 | 1.4 |
| Leukemia | 6.4 | 7.2 | 5.5 | 5.3 | 6.2 | 4.5 |
| Other and ill defined | 32.0 | 32.6 | 31.4 | 19.7 | 22.6 | 17.4 |
Table 3.
| Rank | Cause of death | No. of deaths (%) | Age-standardized death rate per 100,000a) |
|---|---|---|---|
| All causes | 275,895 (100) | 289.3 | |
| 1 | Cancer | 76,855 (27.9) | 82.0 |
| 2 | Heart disease | 28,326 (10.3) | 27.9 |
| 3 | Cerebrovascular disease | 24,455 (8.9) | 23.4 |
| 4 | Pneumonia | 14,718 (5.3) | 13.5 |
| 5 | Intentional self-harm (suicide) | 13,513 (4.9) | 18.3 |
| 6 | Diabetes mellitus | 10,558 (3.8) | 10.2 |
| 7 | Chronic lower respiratory diseases | 7,538 (2.7) | 6.8 |
| 8 | Disease of liver | 6,847 (2.5) | 8.1 |
| 9 | Transport accidents | 5,539 (2.0) | 7.6 |
| 10 | Hypertensive diseases | 5,050 (1.8) | 4.6 |
| Others | 82,496 (29.9) | 87.1 |
Source: Mortality Data, 2015, Statistics Korea [8].
Table 4.
| Site/Type |
Crude mortality rate per 100,000 |
Age-standardized mortality rate per 100,000a) |
||||
|---|---|---|---|---|---|---|
| Both sexes | Men | Women | Both sexes | Men | Women | |
| All sites | 150.8 | 187.3 | 114.4 | 82.0 | 119.6 | 54.6 |
| Lip, oral cavity, and pharynx | 2.3 | 3.5 | 1.1 | 1.3 | 2.3 | 0.6 |
| Esophagus | 3.0 | 5.5 | 0.5 | 1.6 | 3.4 | 0.2 |
| Stomach | 16.7 | 21.6 | 11.8 | 8.9 | 13.8 | 5.4 |
| Colon and rectum | 16.3 | 18.5 | 14.1 | 8.5 | 11.8 | 6.1 |
| Liver | 22.2 | 32.9 | 11.5 | 12.6 | 20.9 | 5.4 |
| Gallbladderb) | 8.3 | 8.4 | 8.1 | 4.2 | 5.3 | 3.4 |
| Pancreas | 10.7 | 11.4 | 9.9 | 5.7 | 7.2 | 4.5 |
| Larynx | 0.7 | 1.3 | 0.1 | 0.4 | 0.8 | 0.0 |
| Lung | 34.1 | 49.8 | 18.5 | 17.9 | 31.2 | 8.2 |
| Breast | 4.6 | 0.1 | 9.2 | 2.8 | 0.0 | 5.5 |
| Cervix uteri | 1.9 | - | 3.8 | 1.1 | - | 2.0 |
| Corpus uteri | 0.6 | - | 1.3 | 0.4 | - | 0.7 |
| Ovary | 2.1 | - | 4.1 | 1.2 | - | 2.2 |
| Prostate | 3.3 | 6.7 | - | 1.6 | 4.3 | - |
| Testis | 0.0 | 0.0 | - | 0.0 | 0.0 | - |
| Kidney | 1.9 | 2.6 | 1.1 | 1.0 | 1.7 | 0.5 |
| Bladder | 2.5 | 3.8 | 1.3 | 1.2 | 2.4 | 0.5 |
| Brain and CNS | 2.5 | 2.6 | 2.3 | 1.7 | 1.9 | 1.5 |
| Thyroid | 0.7 | 0.4 | 0.9 | 0.3 | 0.3 | 0.4 |
| Hodgkin lymphoma | 0.1 | 0.1 | 0.1 | 0.1 | 0.1 | 0.0 |
| Non-Hodgkin lymphoma | 3.5 | 4.0 | 2.9 | 2.0 | 2.7 | 1.4 |
| Multiple myeloma | 1.7 | 1.8 | 1.7 | 1.0 | 1.2 | 0.8 |
| Leukemia | 3.4 | 3.9 | 2.8 | 2.2 | 2.8 | 1.7 |
| Other and ill defined | 7.7 | 8.3 | 7.2 | 4.3 | 5.5 | 3.5 |
Table 5.
| Site/Type |
Both sexes |
Men |
Women |
|||||||||||||||
|---|---|---|---|---|---|---|---|---|---|---|---|---|---|---|---|---|---|---|
| 1999 | 2015 |
Trend 1 |
Trend 2 |
1999 | 2015 |
Trend 1 |
Trend 2 |
1999 | 2015 |
Trend 1 |
Trend 2 |
|||||||
| Year | APC | Year | APC | Year | APC | Year | APC | Year | APC | Year | APC | |||||||
| All sites | 210.5 | 258.9 | 1999-2012 | 3.4a) | 2012-2015 | –6.1a) | 285.0 | 291.7 | 1999-2011 | 1.7a) | 2011-2015 | –3.6a) | 161.1 | 241.1 | 1999-2012 | 5.5a) | 2012-2015 | –7.5a) |
| Lip, oral cavity, and pharynx | 3.6 | 4.1 | 1999-2015 | 0.5a) | - | - | 6.1 | 6.2 | 1999-2015 | –0.2 | - | - | 1.6 | 2.2 | 1999-2015 | 1.4a) | - | - |
| Esophagus | 4.1 | 2.7 | 1999-2015 | –2.3a) | - | - | 8.8 | 5.5 | 1999-2015 | –2.7a) | - | - | 0.6 | 0.4 | 1999-2015 | –1.8a) | - | - |
| Stomach | 43.6 | 33.8 | 1999-2011 | –0.1 | 2011-2015 | –5.7a) | 66.2 | 49.3 | 1999-2011 | –0.3 | 2011-2015 | –6.2a) | 26.7 | 20.5 | 1999-2011 | –0.3 | 2011-2015 | –5.1a) |
| Colon and rectum | 20.4 | 30.4 | 1999-2010 | 6.0a) | 2010-2015 | –4.9a) | 26.2 | 40.2 | 1999-2010 | 6.5a) | 2010-2015 | –5.4a) | 16.4 | 22.2 | 1999-2010 | 4.9a) | 2010-2015 | –4.3a) |
| Liver | 27.9 | 18.2 | 1999-2010 | –1.7a) | 2010-2015 | –4.6a) | 46.8 | 29.5 | 1999-2009 | –1.9a) | 2009-2015 | –4.2a) | 12.3 | 8.2 | 1999-2010 | –1.5a) | 2010-2015 | –5.0a) |
| Gallbladderb) | 6.5 | 6.6 | 1999-2004 | 1.5 | 2004-2015 | –0.3 | 8.1 | 8.0 | 1999-2015 | 0.0 | - | - | 5.4 | 5.5 | 1999-2003 | 2.5 | 2003-2015 | –0.6a) |
| Pancreas | 5.6 | 7.0 | 1999-2015 | 1.4a) | - | - | 7.8 | 8.5 | 1999-2015 | 0.7a) | - | - | 4.0 | 5.7 | 1999-2015 | 2.2a) | - | - |
| Larynx | 2.3 | 1.3 | 1999-2015 | –3.6a) | - | - | 4.9 | 2.7 | 1999-2015 | –3.8a) | - | - | 0.4 | 0.1 | 1999-2007 | –8.9a) | 2007-2015 | –4.2a) |
| Lung | 28.5 | 26.4 | 1999-2011 | 0.1 | 2011-2015 | –1.8a) | 51.4 | 42.3 | 1999-2005 | –0.1 | 2005-2015 | –1.6a) | 12.4 | 14.3 | 1999-2012 | 1.9a) | 2012-2015 | –2.0 |
| Breast | 10.7 | 24.8 | 1999-2007 | 6.9a) | 2007-2015 | 4.0a) | 0.2 | 0.2 | 1999-2015 | –1.1 | - | - | 20.9 | 49.2 | 1999-2007 | 7.1a) | 2007-2015 | 4.1a) |
| Cervix uteri | 8.5 | 4.6 | 1999-2015 | –3.9a) | - | - | - | - | - | - | - | - | 16.3 | 9.1 | 1999-2015 | –3.7a) | - | - |
| Corpus uteri | 1.4 | 3.1 | 1999-2009 | 6.2a) | 2009-2015 | 3.1a) | - | - | - | - | - | - | 2.8 | 6.1 | 1999-2009 | 6.4a) | 2009-2015 | 3.3a) |
| Ovary | 2.7 | 3.2 | 1999-2015 | 1.6a) | - | - | - | - | - | - | - | - | 5.0 | 6.3 | 1999-2015 | 1.8a) | - | - |
| Prostate | 3.1 | 11.2 | 1999-2009 | 15.3a) | 2009-2015 | 0.3 | 8.4 | 25.4 | 1999-2009 | 13.7a) | 2009-2015 | –0.5 | - | - | - | - | - | - |
| Testis | 0.3 | 0.6 | 1999-2015 | 4.9a) | - | - | 0.6 | 1.1 | 1999-2015 | 4.8a) | - | - | - | - | - | - | - | - |
| Kidney | 3.0 | 5.7 | 1999-2009 | 6.7a) | 2009-2015 | 1.3a) | 4.5 | 8.2 | 1999-2010 | 6.1a) | 2010-2015 | 0.4 | 1.7 | 3.4 | 1999-2009 | 6.6a) | 2009-2015 | 1.1 |
| Bladder | 4.6 | 4.3 | 1999-2004 | 2.4a) | 2004-2015 | –1.5a) | 9.0 | 8.1 | 1999-2005 | 1.5a) | 2005-2015 | –1.8a) | 1.6 | 1.5 | 1999-2003 | 2.6 | 2003-2015 | –1.7a) |
| Brain and CNS | 2.9 | 2.8 | 1999-2008 | 1.3a) | 2008-2015 | –1.6a) | 3.2 | 3.1 | 1999-2009 | 1.2a) | 2009-2015 | –2.0 | 2.6 | 2.4 | 1999-2007 | 1.5 | 2007-2015 | –1.5a) |
| Thyroid | 6.3 | 35.2 | 1999-2011 | 22.8a) | 2011-2015 | –13.3a) | 2.1 | 15.1 | 1999-2012 | 22.9a) | 2012-2015 | –16.9a) | 10.4 | 55.6 | 1999-2011 | 22.4a) | 2011-2015 | –14.4a) |
| Hodgkin lymphoma | 0.2 | 0.5 | 1999-2015 | 4.1a) | - | - | 0.4 | 0.6 | 1999-2015 | 3.2a) | - | - | 0.1 | 0.4 | 1999-2015 | 5.3a) | - | - |
| Non-Hodgkin lymphoma | 4.3 | 5.9 | 1999-2015 | 2.3a) | - | - | 5.6 | 7.2 | 1999-2015 | 1.9a) | - | - | 3.3 | 4.6 | 1999-2015 | 2.6a) | - | - |
| Multiple myeloma | 1.0 | 1.6 | 1999-2015 | 3.3a) | - | - | 1.2 | 1.9 | 1999-2015 | 3.0a) | - | - | 0.8 | 1.4 | 1999-2015 | 3.5a) | - | - |
| Leukemia | 4.7 | 5.3 | 1999-2015 | 0.9a) | - | - | 5.5 | 6.2 | 1999-2015 | 1.0a) | - | - | 3.9 | 4.5 | 1999-2015 | 0.7a) | - | - |
| Other and ill defined | 14.4 | 19.7 | 1999-2008 | 3.5a) | 2008-2015 | 1.3a) | 18.1 | 22.6 | 1999-2015 | 1.8a) | - | - | 11.9 | 17.4 | 1999-2011 | 3.8a) | 2011-2015 | –0.3 |
Table 6.
| Site/Type |
Both sexes |
Men |
Women |
|||||||||||||||
|---|---|---|---|---|---|---|---|---|---|---|---|---|---|---|---|---|---|---|
| 1999 | 2015 |
Trend 1 |
Trend 2 |
1999 | 2015 |
Trend 1 |
Trend 2 |
1999 | 2015 |
Trend 1 |
Trend 2 |
|||||||
| Year | APC | Year | APC | Year | APC | Year | APC | Year | APC | Year | APC | |||||||
| All sites | 114.3 | 82.0 | 1999-2002 | 1.0 | 2002-2015 | –2.7a) | 176.6 | 119.6 | 1999-2002 | 1.2 | 2002-2015 | –3.1a) | 70.6 | 54.6 | 1999-2002 | 1.0 | 2002-2015 | –2.2a) |
| Lip, oral cavity, and pharynx | 1.1 | 1.3 | 1999-2015 | –1.8a) | - | - | 2.0 | 2.3 | 1999-2015 | –2.1a) | - | - | 0.4 | 0.6 | 1999-2015 | –2.7a) | - | - |
| Esophagus | 3.1 | 1.6 | 1999-2015 | –4.4a) | - | - | 6.8 | 3.4 | 1999-2015 | –4.6a) | - | - | 0.5 | 0.2 | 1999-2015 | –5.1a) | - | - |
| Stomach | 23.8 | 8.9 | 1999-2003 | –3.3a) | 2003-2015 | –6.7a) | 36.9 | 13.8 | 1999-2003 | –2.6a) | 2003-2015 | –7.0a) | 14.6 | 5.4 | 1999-2003 | –4.4a) | 2003-2015 | –6.6a) |
| Colon and rectum | 7.7 | 8.5 | 1999-2004 | 5.5a) | 2004-2015 | –1.3a) | 10.5 | 11.8 | 1999-2004 | 5.9a) | 2004-2015 | –1.0a) | 6.0 | 6.1 | 1999-2004 | 4.9a) | 2004-2015 | –1.8a) |
| Liver | 20.4 | 12.6 | 1999-2002 | 0.8 | 2002-2015 | –3.6a) | 35.3 | 20.9 | 1999-2002 | –0.1 | 2002-2015 | –3.7a) | 8.3 | 5.4 | 1999-2002 | 2.9 | 2002-2015 | –3.7a) |
| Gallbladderb) | 5.2 | 4.2 | 1999-2001 | 7.4 | 2001-2015 | –2.7a) | 6.8 | 5.3 | 1999-2001 | 6.2 | 2001-2015 | –2.8a) | 4.1 | 3.4 | 1999-2001 | 9.2 | 2001-2015 | –2.6a) |
| Pancreas | 5.4 | 5.7 | 1999-2015 | 0.3a) | - | - | 7.6 | 7.2 | 1999-2015 | –0.4a) | - | - | 3.9 | 4.5 | 1999-2015 | 0.9a) | - | - |
| Larynx | 1.6 | 0.4 | 1999-2015 | –9.5a) | - | - | 3.4 | 0.8 | 1999-2015 | –9.1a) | - | - | 0.4 | 0.0 | 1999-2010 | –15.4a) | 2010-2015 | –6.2 |
| Lung | 22.4 | 17.9 | 1999-2002 | 1.8 | 2002-2015 | –2.1a) | 41.5 | 31.2 | 1999-2001 | 4.3 | 2001-2015 | –2.5a) | 9.4 | 8.2 | 1999-2002 | 2.3 | 2002-2015 | –1.5a) |
| Breast | 2.2 | 2.8 | 1999-2015 | 1.4a) | - | - | 0.1 | 0.0 | 1999-2015 | –4.5a) | - | - | 4.2 | 5.5 | 1999-2015 | 1.7a) | - | - |
| Cervix uteri | 1.4 | 1.1 | 1999-2003 | 8.4a) | 2003-2015 | –5.2a) | - | - | - | - | - | - | 2.6 | 2.0 | 1999-2003 | 7.8a) | 2003-2015 | –4.9a) |
| Corpus uteri | 0.1 | 0.4 | 1999-2002 | 51.8a) | 2002-2015 | 3.4a) | - | - | - | - | - | - | 0.1 | 0.7 | 1999-2002 | 51.6a) | 2002-2015 | 3.8a) |
| Ovary | 0.9 | 1.2 | 1999-2001 | 10.9 | 2001-2015 | 0.2 | - | - | - | - | - | - | 1.7 | 2.2 | 1999-2001 | 10.2 | 2001-2015 | 0.5 |
| Prostate | 0.9 | 1.6 | 1999-2004 | 9.4a) | 2004-2015 | 0.4 | 2.6 | 4.3 | 1999-2002 | 17.5a) | 2002-2015 | 0.3 | - | - | - | - | - | - |
| Testis | 0.0 | 0.0 | 1999-2015 | –2.5 | - | - | 0.1 | 0.0 | 1999-2015 | 2.9 | - | - | - | - | - | - | - | - |
| Kidney | 1.1 | 1.0 | 1999-2015 | –0.1 | - | - | 1.8 | 1.7 | 1999-2015 | 0.0 | - | - | 0.5 | 0.5 | 1999-2015 | –0.8 | - | - |
| Bladder | 1.3 | 1.2 | 1999-2015 | –1.3a) | - | - | 2.6 | 2.4 | 1999-2015 | –1.6a) | - | - | 0.5 | 0.5 | 1999-2001 | 10.8 | 2001-2015 | –1.9a) |
| Brain and CNS | 1.9 | 1.7 | 1999-2002 | 4.4 | 2002-2015 | –2.0a) | 2.2 | 1.9 | 1999-2015 | –1.5a) | - | - | 1.6 | 1.5 | 1999-2015 | –1.4a) | - | - |
| Thyroid | 0.4 | 0.3 | 1999-2003 | 7.0 | 2003-2015 | –4.2a) | 0.3 | 0.3 | 1999-2002 | 16.0 | 2002-2015 | –4.0a) | 0.5 | 0.4 | 1999-2004 | 4.3 | 2004-2015 | –4.7a) |
| Hodgkin lymphoma | 0.0 | 0.1 | 1999-2003 | 29.6 | 2003-2015 | –0.2 | 0.0 | 0.1 | 1999-2004 | 19.2a) | 2004-2015 | –2.0 | 0.0 | 0.0 | 1999-2003 | 40.8 | 2003-2015 | 1.3 |
| Non-Hodgkin lymphoma | 2.1 | 2.0 | 1999-2015 | –0.5a) | - | - | 3.0 | 2.7 | 1999-2015 | –0.8a) | - | - | 1.4 | 1.4 | 1999-2015 | –0.2 | - | - |
| Multiple myeloma | 0.6 | 1.0 | 1999-2003 | 12.8a) | 2003-2015 | 0.8 | 0.8 | 1.2 | 1999-2003 | 10.9a) | 2003-2015 | 0.8 | 0.4 | 0.8 | 1999-2007 | 7.4a) | 2007-2015 | –1.1 |
| Leukemia | 2.9 | 2.2 | 1999-2001 | 1.4 | 2001-2015 | –2.1a) | 3.5 | 2.8 | 1999-2015 | –1.7a) | - | - | 2.4 | 1.7 | 1999-2015 | –2.1a) | - | - |
| Other and ill defined | 7.8 | 4.3 | 1999-2015 | –3.1a) | - | - | 9.0 | 5.5 | 1999-2009 | –0.6 | 2009-2015 | –6.8a) | 7.0 | 3.5 | 1999-2005 | –7.0a) | 2005-2015 | –2.2a) |
Table 7.
Table 8.
| Site/Type |
Both sexes |
Men |
Women |
|||||||||||||||
|---|---|---|---|---|---|---|---|---|---|---|---|---|---|---|---|---|---|---|
| 1993-1995 | 1996-2000 | 2001-2005 | 2006-2010 | 2011-2015 | Changea) | 1993-1995 | 1996-2000 | 2001-2005 | 2006-2010 | 2011-2015 | Changea) | 1993-1995 | 1996-2000 | 2001-2005 | 2006-2010 | 2011-2015 | Changea) | |
| All sites | 41.2 | 44.0 | 54.0 | 65.2 | 70.7 | 29.5 | 31.7 | 35.3 | 45.4 | 56.5 | 62.8 | 31.1 | 53.4 | 55.3 | 64.2 | 74.2 | 78.4 | 25.0 |
| Lip, oral cavity, and pharynx | 41.1 | 46.7 | 54.3 | 60.6 | 64.5 | 23.4 | 35.8 | 41.1 | 49.4 | 56.4 | 60.7 | 24.9 | 58.1 | 63.8 | 67.8 | 71.7 | 74.1 | 16.0 |
| Esophagus | 12.7 | 15.2 | 21.4 | 29.6 | 36.0 | 23.3 | 11.8 | 14.3 | 20.6 | 29.0 | 35.7 | 23.9 | 23.7 | 24.2 | 29.7 | 36.5 | 39.3 | 15.6 |
| Stomach | 42.8 | 46.6 | 57.8 | 68.1 | 75.4 | 32.6 | 43.0 | 46.9 | 58.4 | 68.7 | 76.3 | 33.3 | 42.6 | 46.0 | 56.5 | 66.7 | 73.7 | 31.1 |
| Colon and rectum | 54.8 | 58.0 | 66.7 | 73.5 | 76.3 | 21.5 | 55.3 | 59.0 | 68.5 | 75.4 | 78.0 | 22.7 | 54.2 | 56.8 | 64.3 | 70.8 | 73.6 | 19.4 |
| Liver | 10.7 | 13.2 | 20.4 | 28.1 | 33.6 | 22.9 | 9.9 | 12.9 | 20.3 | 28.1 | 34.1 | 24.2 | 13.6 | 14.2 | 20.9 | 28.1 | 32.2 | 18.6 |
| Gallbladderb) | 17.3 | 19.7 | 23.1 | 26.8 | 29.1 | 11.8 | 16.6 | 20.3 | 23.5 | 27.7 | 30.2 | 13.6 | 18.0 | 19.1 | 22.7 | 25.9 | 28.0 | 10.0 |
| Pancreas | 9.4 | 7.6 | 8.4 | 8.4 | 10.8 | 1.4 | 8.8 | 7.3 | 8.4 | 8.1 | 10.3 | 1.5 | 10.1 | 8.1 | 8.5 | 8.7 | 11.5 | 1.4 |
| Larynx | 59.7 | 62.3 | 66.3 | 72.9 | 75.5 | 15.8 | 60.2 | 62.8 | 66.9 | 73.2 | 75.9 | 15.7 | 55.4 | 57.8 | 58.9 | 67.6 | 69.9 | 14.5 |
| Lung | 11.3 | 12.7 | 16.5 | 20.1 | 26.7 | 15.4 | 10.4 | 11.6 | 15.2 | 17.9 | 22.7 | 12.3 | 14.2 | 16.2 | 20.1 | 25.8 | 35.8 | 21.6 |
| Breast | 77.9 | 83.2 | 88.6 | 91.1 | 92.3 | 14.4 | 75.1 | 85.6 | 87.2 | 89.9 | 87.1 | 12.0 | 78.0 | 83.2 | 88.6 | 91.1 | 92.3 | 14.3 |
| Cervix uteri | 77.5 | 80.0 | 81.4 | 80.5 | 79.9 | 2.4 | - | - | - | - | - | - | 77.5 | 80.0 | 81.4 | 80.5 | 79.9 | 2.4 |
| Corpus uteri | 81.5 | 81.8 | 84.5 | 86.4 | 87.8 | 6.3 | - | - | - | - | - | - | 81.5 | 81.8 | 84.5 | 86.4 | 87.8 | 6.3 |
| Ovary | 58.7 | 58.9 | 61.8 | 61.1 | 64.1 | 5.4 | - | - | - | - | - | - | 58.7 | 58.9 | 61.8 | 61.1 | 64.1 | 5.4 |
| Prostate | 55.9 | 67.2 | 80.4 | 91.1 | 94.1 | 38.2 | 55.9 | 67.2 | 80.4 | 91.1 | 94.1 | 38.2 | - | - | - | - | - | - |
| Testis | 85.4 | 90.4 | 90.7 | 93.1 | 95.6 | 10.2 | 85.4 | 90.4 | 90.7 | 93.1 | 95.6 | 10.2 | - | - | - | - | - | - |
| Kidney | 62.0 | 66.1 | 73.6 | 78.4 | 82.2 | 20.2 | 60.8 | 64.4 | 73.0 | 78.2 | 81.6 | 20.8 | 64.5 | 69.7 | 74.7 | 78.8 | 83.6 | 19.1 |
| Bladder | 69.1 | 73.1 | 75.7 | 76.7 | 75.8 | 6.7 | 70.0 | 74.8 | 77.5 | 78.8 | 77.8 | 7.8 | 65.5 | 66.3 | 68.8 | 68.6 | 67.7 | 2.2 |
| Brain and CNS | 38.5 | 39.0 | 40.9 | 42.8 | 40.7 | 2.2 | 37.2 | 37.5 | 40.2 | 41.4 | 39.1 | 1.9 | 40.2 | 40.7 | 41.7 | 44.4 | 42.6 | 2.4 |
| Thyroid | 94.2 | 94.9 | 98.4 | 99.9 | 100.3 | 6.1 | 87.2 | 89.5 | 96.0 | 100.1 | 100.6 | 13.4 | 95.4 | 95.9 | 98.7 | 99.9 | 100.2 | 4.8 |
| Hodgkin lymphoma | 68.0 | 71.2 | 76.7 | 81.0 | 82.2 | 14.2 | 67.6 | 68.1 | 74.7 | 80.7 | 82.8 | 15.2 | 68.6 | 77.4 | 80.7 | 81.6 | 81.2 | 12.6 |
| Non-Hodgkin lymphoma | 46.6 | 50.8 | 55.9 | 59.3 | 62.9 | 16.3 | 45.3 | 48.9 | 54.9 | 59.1 | 62.4 | 17.1 | 48.7 | 53.5 | 57.4 | 59.6 | 63.6 | 14.9 |
| Multiple myeloma | 22.1 | 19.8 | 29.6 | 34.9 | 40.9 | 18.8 | 21.1 | 17.8 | 29.8 | 35.0 | 40.6 | 19.5 | 23.3 | 22.1 | 29.4 | 34.8 | 41.3 | 18.0 |
| Leukemia | 26.5 | 33.3 | 42.0 | 47.6 | 51.0 | 24.5 | 26.2 | 32.3 | 41.8 | 46.8 | 51.1 | 24.9 | 26.8 | 34.6 | 42.2 | 48.6 | 50.8 | 24.0 |
| Other and ill defined | 42.1 | 45.9 | 57.6 | 67.2 | 72.2 | 30.1 | 37.4 | 42.4 | 53.8 | 63.4 | 68.9 | 31.5 | 47.4 | 50.0 | 61.8 | 71.0 | 75.5 | 28.1 |
Table 9.
| Site/Type |
Crude prevalence rate per 100,000a) |
Age-standardized prevalence rate per 100,000b) |
||||
|---|---|---|---|---|---|---|
| Both sexes | Men | Women | Both sexes | Men | Women | |
| All sites | 3,162.8 | 2,781.0 | 3,544.1 | 1,956.9 | 1,826.6 | 2,171.5 |
| Lip, oral cavity, and pharynx | 42.8 | 57.6 | 28.1 | 26.8 | 37.9 | 17.2 |
| Esophagus | 18.0 | 32.5 | 3.6 | 10.3 | 20.6 | 1.8 |
| Stomach | 504.4 | 668.9 | 340.1 | 291.5 | 425.6 | 180.9 |
| Colon and rectum | 433.1 | 516.8 | 349.4 | 248.2 | 330.6 | 181.7 |
| Liver | 120.3 | 180.2 | 60.4 | 73.5 | 116.8 | 34.2 |
| Gallbladderc) | 38.2 | 39.1 | 37.3 | 21.1 | 24.7 | 18.4 |
| Pancreas | 18.7 | 19.8 | 17.6 | 11.1 | 12.9 | 9.7 |
| Larynx | 19.7 | 37.1 | 2.3 | 11.2 | 23.6 | 1.2 |
| Lung | 137.2 | 172.8 | 101.8 | 78.7 | 110.2 | 54.5 |
| Breast | 351.5 | 2.7 | 699.8 | 221.7 | 1.7 | 435.9 |
| Cervix uteri | 99.1 | - | 198.0 | 61.5 | - | 120.0 |
| Corpus uteri | 40.9 | - | 81.8 | 26.1 | - | 51.2 |
| Ovary | 35.5 | - | 71.0 | 24.2 | - | 48.1 |
| Prostate | 136.3 | 272.8 | - | 71.3 | 170.0 | - |
| Testis | 5.8 | 11.5 | - | 5.2 | 10.3 | - |
| Kidney | 69.3 | 93.7 | 45.0 | 43.5 | 62.0 | 27.1 |
| Bladder | 61.6 | 100.6 | 22.7 | 33.7 | 64.1 | 10.6 |
| Brain and CNS | 20.3 | 21.0 | 19.7 | 17.2 | 18.3 | 16.1 |
| Thyroid | 696.8 | 236.3 | 1,156.8 | 464.9 | 160.2 | 767.5 |
| Hodgkin lymphoma | 5.0 | 6.4 | 3.7 | 4.2 | 5.1 | 3.2 |
| Non-Hodgkin lymphoma | 53.9 | 61.4 | 46.5 | 38.2 | 45.9 | 31.1 |
| Multiple myeloma | 10.5 | 10.9 | 10.0 | 6.1 | 7.0 | 5.4 |
| Leukemia | 37.8 | 41.8 | 33.8 | 35.2 | 39.2 | 31.1 |
| Other and ill defined | 205.9 | 197.1 | 214.6 | 131.4 | 139.9 | 124.4 |
a) Crude prevalence rate: number of prevalent cases divided by the corresponding person-years of observation. Prevalent cases were defined as patients who were diagnosed between January 1, 1999 and December 31, 2015 and who were alive on January 1, 2016. Multiple primary cancer cases were counted multiple times,


 PDF
PDF Citation
 Print
Print


 XML Download