Abstract
Purpose
The aim of this study was to evaluate recent trends in gastric cancer incidence according to the age, sex, and tumor location in the Korean population.
Materials and Methods
Using data from the Korea Central Cancer Registry between 1999 and 2014, gastric cancer incidence, annual percent changes, and male-to-female incidence rate ratios (IRRs) according to tumorlocationwere determined. The distribution of disease extent according to the tumor location and its changes between 2006 and 2014 were also analyzed.
Results
Incidence of gastric cancer was stable until 2011 and decreased between 2011 and 2014. The age-standardized incidence rate of gastric cancer was 43.6 (per 100,000) in 1999 and 35.8 in 2014. The proportion of cardia/fundus cancer remained stable (5.9% to 7.1%), and that of body cancer increased (35.3% to 43.2%). The male-to-female IRR decreased in most age groups, except for those in their 60s. In the distribution of disease extent, the proportion of localized disease increased, and regional and distant disease decreased in all tumor locations (53.9% to 66.0%, 31.4% to 22.5%, and 14.8% to 11.5%, respectively; p < 0.001). For histological type, the proportion of carcinoid tumor and non-epithelial tumor increased (0.3% to 1.0%, and 0.8% to 1.4%, respectively).
Gastric cancer is the fifth most common cancer and the third leading cause of cancer mortality worldwide [1]. Although the incidence of gastric cancer has been decreasing in developed countries, 1.3 million new cases of gastric cancer and 819,000 deaths were still reported in 2015. In the Republic of Korea, gastric cancer ranks second in cancer incidence and third in cancer mortality [2]. Approximately 30,000 new gastric cancer cases and about 9,000 deaths were reported in 2014.
Previous studies using the Korea Central Cancer Registry (KCCR), a nationwide cancer database, analyzed the incidence, mortality, survival, and prevalence of 23 cancer types since its first functional year in 1999 [2,3]. However, these studies did not evaluate incidence stratified by specific clinicopathological factors, such as tumor location, stage, and histology.
Another nationwide epidemiological study for gastric cancer, which was performed by the Korean Gastric Cancer Association (KGCA), did evaluate incidence according to clinicopathological factors, such as tumor location and pathological TNM [4]. However, only surgically treated patients were included in its survey data. Meaning, patients who received endoscopic or chemotherapeutic treatment were excluded from this study, and the KGCA statistics therefore did not depict an accurate portrayal of the overall gastric cancer status in Korea. To our knowledge, no previous studies have analyzed trends in gastric cancer incidence according to the specific characteristics using nationwide cancer data in Korea.
Domestically, reports evaluating nationwide trends in cancer incidence are necessary for the development of up-todate and evidence-based health care policies and guidelines by both clinicians and policy makers. For example, policy makers can analyze the effectiveness of Korea’s National Cancer Control Program and update their recommendations and initiatives accordingly. On a larger scale, these epidemiological reports can also advance general understating of cancer etiology in the context of treated patients. Clinicians can assess the effect of biological and environmental risk factors on cancer incidence, and focus on important factors to prevent and treat cancer.
The aim of this study was to evaluate recent trends in gastric cancer incidence according to clinicopathological factors using the KCCR. In particular, specific incidences of gastric cancer according to tumor location were determined.
When the KCCR was launched in 1980 by the Ministry of Health and Welfare, Korea, this database initially collected information on cancer cases only from training hospitals and then expanded to collecting nationwide data in 1999, by integrating the hospital-based KCCR database with data from regional cancer registry programs [3]. Currently, the KCCR provides nationwide cancer incidence, survival, and prevalence statistics annually.
Gastric cancer incidence data between 1999 and 2014 were obtained from the KCCR. Anatomical tumor location was classified based on the 10th version of the International Statistical Classification of Disease and Related Health Problems (ICD-10) and divided into four categories in this study: (1) cardia (C16.0) and fundus (C16.1), (2) body (C16.2), (3) antrum (C16.3) and pylorus (C16.4), and (4) non-specific including lesser curvature (C16.5), greater curvature (C16.6), overlapping lesion (C16.8), and unspecified (C16.9) [5]. The histology of gastric cancers was classified into six groups: tubular adenocarcinoma (ICD-O-3: 8140/3, 8143/3, 8144/3, 8190/3, 8210/3, 8211/3, 8221/3, 8255/3, 8261/3-8263/3), signet ring cell carcinoma (ICD-O-3: 8145/3, 8490/3), other carcinoma, carcinoid tumor (ICD-O-3: 8013/3, 8153/3, 8240/3-8246/3, 8249/3, 9364/3, 9473/3), non-epithelial, and unclassified (ICD-O-3: 8000/3, 8001/3, 8010/3, 8142/3, 8050/3, 8052/3).
Stage at diagnosis was classified as localized (invasive cancer confined to the organ of origin), regional (spread to adjacent organs by direct extension and/or regional lymph node metastasis), distant (extension to organs other than those covered in the regional category or metastases to distant organs or distant lymph nodes), or unknown.
The KCCR records constituted the best available information on the stage of disease as it appears in the medical record within 4 months of diagnosis.
The age-standardized incidence rates per 100,000 people were calculated as the sum of the expected age-specific rates divided by the sum of the standard population [6]. The sum of the expected age-specific rates was obtained by multiplying the age-specific incidence rates among study population by the proportion of population in the corresponding agespecific groups among standard population. We used the Segi’s world population as the standard population, and the structure of the standard population is shown in S1 Table. Annual percent changes (APCs) for the incidence rates is calculated using a linear model, according to the following formula; (exp(β)–1)×100, where the regression coefficient (β) is the slope of the regression of the natural logarithm of the agestandardized rate (ASR) in a calendar year [7]. The 95% confidence intervals (CIs) were obtained with a standard error from the fit of the regression and the t-distribution function.
Male-to female incidence rate ratios (IRR) were calculated using the numbers of cancer patients for each tumor location and the sex-specific population structure for each year [8]. Statistical significance in difference between IRRs was determined if the 95% CIs did not overlap between IRRs.
The most recent (2014) male-to female IRRs was compared to those of 2004, because we thought that 10 years of interval is appropriate to evaluate the trend of IRRs. The Surveillance Epidemiology and End Results (SEER) stage distributions were compared between 2006 and 2014, because SEER stage data have been collected since 2005 in KCCR and the 2006 data is the oldest reliable one.
A p-value of < 0.05 indicated statistical significance. All analyses were conducted using the R-2.12.2 (http://cran.r-project.org) software and STATA ver. 11.0 (StataCorp LP, College Station, TX).
Overall gastric cancer incidence and incidences by tumor location are shown in Table 1. Incidence of gastric cancer increased from 20,870 in 1999 to 31,937 in 2011, and then slightly decreased to 29,854 in 2014. The ASR was maintained, ranging from 41.2 to 44.4 per 100,000 between 1999 and 2011, but decreased to 35.8 in 2014.
The antrum/pylorus was the most common location throughout all periods. Incidence and ASR of cardia/fundus, body, and antrum/pylorus cancer slightly increased, and those of non-specific markedly decreased. When the cases classified as non-specific were excluded, the proportion of cardia/fundus cancer had little change, the body cancer increased from 35.3% in 1999 to 43.2% in 2014, and the antrum/pylorus cancer decreased from 58.0% in 1999 to 50.6% in 2014. The positive values of APCs for cardia/fundus, body, and antrum/pylorus cancer can be associated with a negative APC value for non-specific tumors (1.3, 3.7, and 1.3 in the cardia/fundus, body, and antrum/pylorus cancer respectively, and –8.5 in the non-specific tumor).
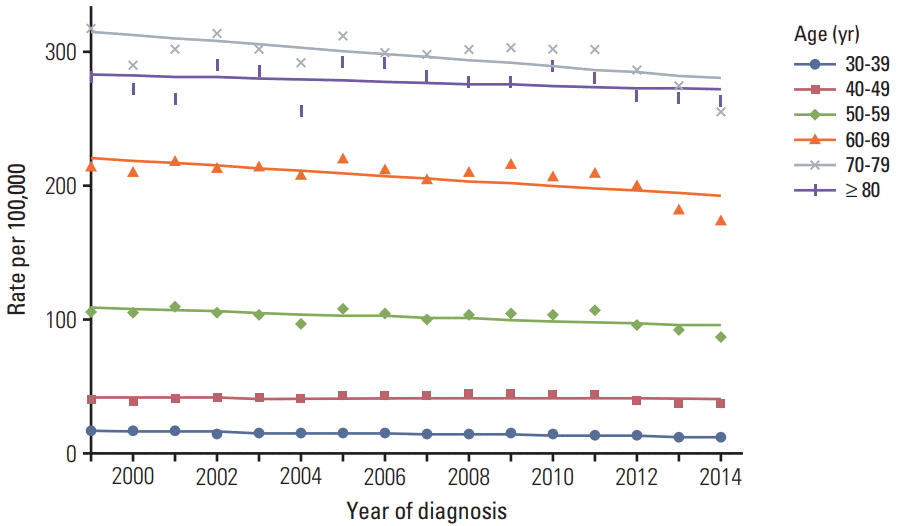
Fig. 1 demonstrates incidence rates per 100,000 according to the age groups in each location. The incidence rate was the highest in 70-79-year-old age group followed by the age groups of ≥ 80, 60-69, 50-59, 40-49, and 30-39 years.
The male-to-female IRRs according to the age groups in 2004 and 2014 are shown in Table 2. Generally, male patients occupied 2 to 3 times of female patients in most age groups. The highest male-to-female IRRs were observed in the 60s and the lowest in the 30s.
For overall gastric cancer, male-to-female IRRs significantly decreased in the 40s (1.8 in 2004 vs. 1.5 in 2014; p < 0.001). For body cancer, it significantly decreased in 30s, 40s, and 60s (p=0.003, p=0.006, and p=0.011, respectively).
Distributions of SEER stage by tumor location are shown in Table 3. In overall gastric cancer, the proportion of localized cancer increased from 53.9% in 2006 to 66.0% in 2014, and those of regional and distant cancer decreased from 31.4% to 22.5% and 14.8% to 11.5%, respectively (p < 0.001). These changes of increased localized cancer and decreased regional and distant cancer were observed in each tumor location.
The change of SEER stage was specifically evaluated in the 30s, because the National Cancer Screening Program is performed for patients above 40 years. Compared to patients older than 40 years, patients in their 30s experienced lower rates of localized cancer but higher rates of regional or distant cancer (Table 4). However, the changes between 2006 and 2014 were similar in both the 30s and 40 or more populations; the proportion of localized cancer increased from 45.3% to 55.5% between 2006 and 2014, and regional and distant cancer decreased from 33.4% to 24.3% and 21.3% to 20.2% between 2006 and 2014, respectively.
Table 5 demonstrates incidence and proportion according to histology. The proportion of each histological type was calculated excluding unclassified tumors. Most common histology was tubular adenocarcinoma followed by signet ring cell, other carcinoma, non-epithelial tumor, and carcinoid tumor. The proportions of carcinoid tumor and non-epithelial tumor increased from 0.3% to 1.0% and 0.8% to 1.4% between 1999 and 2014, respectively. However, the proportion of other carcinoma decreased from 3.8% to 3.1% between 1999 and 2014. The proportions of tubular adenocarcinoma and signet ring cell were stable.
In this study, we evaluated recent trends in gastric cancer incidence according to tumor location, stage, and histology using the KCCR database. Between 1999 and 2014, the incidence of gastric cancer decreased, but the proportion of cardia/fundus cancer has remained stable so far. Localized gastric cancer increased in all tumor locations, and an increase in carcinoid and non-epithelial tumors was also observed.
Gastric cancer ranks as the second-most common cancer following thyroid cancer in Korea, but only a few longitudinal studies evaluating its incidence have been performed thus far [2,9-11]. Previous nationwide longitudinal studies that reported these results, however, did not stratify data by specific clinicopathological factors or encompass patients treated by non-surgical modalities. A study by Song et al. [10] revealed age- and sex-specific gastric cancer incidence and APCs from 1999 to 2010 using the KCCR data, but no other clinical factors except age and sex in the study was studies.
Disparity in the tumor location of gastric tumors between the East and West is well known [12-15]. While the majority of gastric cancers in the East are located in the distal part of the stomach (antrum/pylorus), proximal gastric cancers (cardia/fundus) are more common in Western countries. However, recent studies using large surgical cohorts showed increased incidence of proximal gastric cancer in Japan and Korea [9,16]. The proportion of cardia cancer increased from 2.3% (1962-1965) to 10.0% (2001-2005) in the Japanese cohort and from 11.2% (1995) to 16.0% (2014) in the Korean cohort. Considering the transition towards a westernized life-style and increased rates of obesity in East Asia, we hypothesized that a gradual increase of proximal gastric cancers would be observed in this study. However, no significant change in the proportion of proximal gastric cancer was found; the proportion consistently ranged between 6% and 7% in all gastric cancer cases in Korea.
Proximal location is known to be a negative prognostic factor because of its association with advanced stages and high metastasis rates [17-19]. The change in SEER stage according to the tumor location was therefore evaluated, and the proportion of patients with localized cancer was found to be smaller in cardia/fundus cancers than in antrum/pylorus cancers. However, overall incidence of localized tumors in both cardia/fundus and antrum/pylorus locations increased. Even the proportion of localized tumors in young patients aged 30-39, who are not covered by the National Cancer Screening Program, increased from 45% to 56%. This trend of increased incidence in localized cancer was found in all tumor locations and age groups.
This study has several limitations. First, as the proportion of non-specific tumor location decreased, other specific tumor locations increased. These changes can be explained by improved accuracy in topology coding. The National Endoscopy Quality Improvement Program which was initiated in 2009 probably affected the topical accuracy, and it was recommended that information about the location, shape, and size of lesion are reported in endoscopic finding [20,21]. Therefore, positive APC values of each specific tumor location (cardia/fundus, body, and antrum/pylorus) are not actual increases. Instead, the relative proportion of each tumor location can suggest actual changes of gastric cancer incidence according to the tumor location. Second, approximately 15% (4,458/29,854 in 2014) of tumor location was unspecified. Even though the proportion of non-specific tumors gradually decreased throughout the timeframe of this study, these non-specific tumors could potentially skew the available data. Improvements in the KCCR data supplementation policies and increased effort by physicians can decrease the proportion of non-specific entities in the future.
These findings describing changes in gastric cancer incidence and trends when stratified by specific clinicopathological factors warrants further studies to investigate the cause of these noted changes. In turn, this information can be valuable when revising current guidelines to implement more effective prevention and surveillance programs for gastric cancer.
In the 15 years from 1999 through 2014, age-standardized incidence of gastric cancer started to decrease from 2012, and the proportion of cardia/fundus cancer remained unchanged. The trend of increasing localized cancer was observed in all tumor locations.
Electronic Supplementary Material
Supplementary materials are available at Cancer Research and Treatment website (http://www.e-crt.org).
ACKNOWLEDGMENTS
This work was supported by a grant of the National Cancer Center (No. NCC-1710120-1 and NCC-1610200).
References
1. Global Burden of Disease Cancer Collaboration, Fitzmaurice C, Allen C, Barber RM, Barregard L, Bhutta ZA, et al. Global, regional, and national cancer incidence, mortality, years of life lost, years lived with disability, and disability-adjusted lifeyears for 32 cancer groups, 1990 to 2015: a systematic analysis for the global burden of disease study. JAMA Oncol. 2017; 3:524–48.
2. Jung KW, Won YJ, Oh CM, Kong HJ, Lee DH, Lee KH, et al. Cancer statistics in Korea: incidence, mortality, survival, and prevalence in 2014. Cancer Res Treat. 2017; 49:292–305.
3. Shin HR, Won YJ, Jung KW, Kong HJ, Yim SH, Lee JK, et al. Nationwide cancer incidence in Korea, 1999~2001; first result using the national cancer incidence database. Cancer Res Treat. 2005; 37:325–31.
4. Korean Gastric Cancer Association. Nationwide gastric cancer report in Korea. J Korean Gastric Cancer Assoc. 2002; 2:105–14.
5. World Health Organization. International statistical classification of diseases and related health problems. 10th rev. ed. Geneva: World Health Organization;2016.
6. Howlader N, Noone AM, Krapcho M, Miller D, Bishop K, Kosary CL, et al. SEER cancer statistics review, 1975-2014. Bethesda, MD: National Cancer Institute;2017.
7. Altekruse SF, Kosary CL, Krapcho M, Neyman N, Aminou R, Waldron W, et al. SEER cancer statistics review, 1975-2007. Bethesda, MD: National Cancer Institute;2010.
8. Boyle P, Parkin DM. Statistical methods for registries. In : Jensen OM, Parkin DM, MacLennan R, Muir CS, Skeet RG, editors. Cancer registration: principles and methods. Lyon: IARC Press;1991. p. 126–58.
9. Information Committee of Korean Gastric Cancer Association. Korean Gastric Cancer Association nationwide survey on gastric cancer in 2014. J Gastric Cancer. 2016; 16:131–40.
10. Song M, Kang D, Yang JJ, Choi JY, Sung H, Lee Y, et al. Age and sex interactions in gastric cancer incidence and mortality trends in Korea. Gastric Cancer. 2015; 18:580–9.
12. Schwarz RE, Zagala-Nevarez K. Ethnic survival differences after gastrectomy for gastric cancer are better explained by factors specific for disease location and individual patient comorbidity. Eur J Surg Oncol. 2002; 28:214–9.
13. Yao JC, Schnirer II, Reddy S, Chiang S, Najam A, Yu C, et al. Effects of sex and racial/ethnic group on the pattern of gastric cancer localization. Gastric Cancer. 2002; 5:208–12.
14. Strong VE, Song KY, Park CH, Jacks LM, Gonen M, Shah M, et al. Comparison of gastric cancer survival following R0 resection in the United States and Korea using an internationally validated nomogram. Ann Surg. 2010; 251:640–6.
15. Ferro A, Peleteiro B, Malvezzi M, Bosetti C, Bertuccio P, Levi F, et al. Worldwide trends in gastric cancer mortality (1980-2011), with predictions to 2015, and incidence by subtype. Eur J Cancer. 2014; 50:1330–44.
16. Kusano C, Gotoda T, Khor CJ, Katai H, Kato H, Taniguchi H, et al. Changing trends in the proportion of adenocarcinoma of the esophagogastric junction in a large tertiary referral center in Japan. J Gastroenterol Hepatol. 2008; 23:1662–5.
17. Ohno S, Tomisaki S, Oiwa H, Sakaguchi Y, Ichiyoshi Y, Maehara Y, et al. Clinicopathologic characteristics and outcome of adenocarcinoma of the human gastric cardia in comparison with carcinoma of other regions of the stomach. J Am Coll Surg. 1995; 180:577–82.
18. Pacelli F, Papa V, Caprino P, Sgadari A, Bossola M, Doglietto GB. Proximal compared with distal gastric cancer: multivariate analysis of prognostic factors. Am Surg. 2001; 67:697–703.
19. Talamonti MS, Kim SP, Yao KA, Wayne JD, Feinglass J, Bennett CL, et al. Surgical outcomes of patients with gastric carcinoma: the importance of primary tumor location and microvessel invasion. Surgery. 2003; 134:720–7.
Table 1.
Year |
Overall |
Cardia/Fundus |
Body |
Antrum/Pylorus |
Non-specific |
|||||
---|---|---|---|---|---|---|---|---|---|---|
No. | ASRa) | No. (%)b) | ASRa) | No. (%)b) | ASRa) | No. (%)b) | ASRa) | No. | ASRb) | |
1999 | 20,870 | 43.6 | 775 (6.8) | 1.6 | 4,030 (35.3) | 8.3 | 6,623 (58.0) | 14.0 | 9,442 | 19.7 |
2000 | 20,972 | 42.3 | 813 (7.1) | 1.7 | 4,067 (35.5) | 8.1 | 6,591 (57.5) | 13.4 | 9,501 | 19.1 |
2001 | 22,541 | 44.0 | 878 (6.6) | 1.7 | 4,929 (37.3) | 9.5 | 7,405 (56.0) | 14.6 | 9,329 | 18.1 |
2002 | 23,220 | 43.6 | 999 (7.0) | 1.9 | 5,223 (36.4) | 9.7 | 8,123 (56.6) | 15.4 | 8,875 | 16.6 |
2003 | 23,927 | 43.3 | 1,016 (6.8) | 1.8 | 5,548 (37.0) | 10.0 | 8,434 (56.2) | 15.4 | 8,929 | 16.1 |
2004 | 23,636 | 41.2 | 1,013 (6.7) | 1.8 | 5,737 (38.1) | 10.0 | 8,304 (55.2) | 14.6 | 8,582 | 14.9 |
2005 | 26,367 | 44.4 | 1,114 (6.3) | 1.9 | 6,816 (38.4) | 11.5 | 9,806 (55.3) | 16.6 | 8,631 | 14.4 |
2006 | 26,434 | 42.9 | 1,208 (6.4) | 2.0 | 7,173 (38.2) | 11.6 | 10,386 (55.3) | 17.0 | 7,667 | 12.3 |
2007 | 26,820 | 41.8 | 1,251 (6.3) | 2.0 | 7,739 (39.1) | 12.1 | 10,799 (54.6) | 16.9 | 7,031 | 10.8 |
2008 | 28,394 | 42.6 | 1,326 (6.1) | 2.0 | 8,664 (39.8) | 13.1 | 11,758 (54.1) | 17.8 | 6,646 | 9.8 |
2009 | 30,019 | 43.4 | 1,382 (5.9) | 2.0 | 9,345 (39.8) | 13.7 | 12,754 (54.3) | 18.5 | 6,538 | 9.3 |
2010 | 30,680 | 42.6 | 1,495 (6.2) | 2.1 | 9,534 (39.6) | 13.4 | 13,056 (54.2) | 18.2 | 6,595 | 9.0 |
2011 | 31,937 | 42.9 | 1,668 (6.3) | 2.2 | 10,938 (41.5) | 14.9 | 13,759 (52.2) | 18.5 | 5,572 | 7.3 |
2012 | 31,067 | 40.2 | 1,662 (6.4) | 2.1 | 10,993 (42.1) | 14.5 | 13,442 (51.5) | 17.3 | 4,970 | 6.2 |
2013 | 30,328 | 37.6 | 1,582 (6.2) | 2.0 | 10,672 (42.0) | 13.6 | 13,181 (51.8) | 16.2 | 4,893 | 5.8 |
2014 | 29,854 | 35.8 | 1,566 (6.2) | 1.9 | 10,981 (43.2) | 13.6 | 12,849 (50.6) | 15.2 | 4,458 | 5.1 |
APC (95% CI) | –0.9 (–1.4 to –0.3) | 1.3 (0.6 to 2.1) | 3.7 (2.9 to 4.6) | 1.3 (0.3 to 2.2) | –8.5 (–9.3 to –7.7) | |||||
p-value | < 0.001 | < 0.001 | < 0.001 | < 0.001 | < 0.001 |
Table 2.
Table 3.
Table 4.
Table 5.
Year | Tubular adenocarcinoma | Signet ring cell | Other carcinoma | Carcinoid tumor | Non-epithelial tumor | Unclassified |
---|---|---|---|---|---|---|
1999 | 13,153 (75.9)a) | 3,348 (19.3) | 653 (3.8) | 50 (0.3) | 133 (0.8) | 3,533 |
2000 | 13,553 (75.8) | 3,443 (19.3) | 672 (3.8) | 49 (0.3) | 156 (0.9) | 3,099 |
2001 | 14,964 (75.6) | 3,918 (19.8) | 660 (3.3) | 45 (0.2) | 199 (1.0) | 2,755 |
2002 | 15,566 (75.4) | 4,107 (19.9) | 697 (3.4) | 71 (0.3) | 203 (1.0) | 2,576 |
2003 | 16,334 (75.4) | 4,235 (19.6) | 778 (3.6) | 79 (0.4) | 227 (1.0) | 2,274 |
2004 | 16,010 (74.2) | 4,521 (20.9) | 710 (3.3) | 110 (0.5) | 236 (1.1) | 2,049 |
2005 | 18,357 (75.5) | 4,755 (19.6) | 832 (3.4) | 128 (0.5) | 232 (1.0) | 2,063 |
2006 | 18,894 (76.1) | 4,756 (19.2) | 782 (3.2) | 124 (0.5) | 258 (1.0) | 1,620 |
2007 | 18,973 (75.3) | 5,006 (19.9) | 828 (3.3) | 133 (0.5) | 260 (1.0) | 1,620 |
2008 | 20,506 (75.6) | 5,353 (19.7) | 856 (3.2) | 141 (0.5) | 252 (0.9) | 1,286 |
2009 | 21,877 (75.8) | 5,576 (19.3) | 951 (3.3) | 174 (0.6) | 282 (1.0) | 1,159 |
2010 | 22,526 (76.4) | 5,577 (18.9) | 867 (2.9) | 217 (0.7) | 310 (1.1) | 1,183 |
2011 | 23,488 (76.2) | 5,870 (19.1) | 865 (2.8) | 255 (0.8) | 328 (1.1) | 1,131 |
2012 | 22,916 (76.2) | 5,631 (18.7) | 895 (3.0) | 278 (0.9) | 341 (1.1) | 1,006 |
2013 | 21,982 (74.9) | 5,849 (19.9) | 918 (3.1) | 260 (0.9) | 356 (1.2) | 963 |
2014 | 21,430 (74.0) | 5,947 (20.5) | 902 (3.1) | 277 (1.0) | 395 (1.4) | 903 |
APC (95% CI) | 3.8 (3.0-4.6) | 3.8 (3.2-4.4) | 2.4 (1.8-3.0) | 13.0 (11.1-14.9) | 5.9 (5.1-6.7) | |
p-value | < 0.001 | < 0.001 | < 0.001 | < 0.001 | < 0.001 |