Abstract
Purpose
We aimed to describe the temporal trends and district-level geographical variations in cancer incidences throughout Korea during 1999-2013.
Materials and Methods
Data were obtained from the Korean National Cancer Incidence Database. We calculated the age-standardized cumulative cancer incidences according to sex and geographical region (metropolitan cities, provinces, and districts) for three 5-year periods (1999-2003, 2004-2008, and 2009-2013). Each quintile interval contained the same number of regions. Disease maps were created to visualize regional differences in the cancer incidences.
Results
Substantial differences in cancer incidences were observed according to district and cancer type. The largest variations between geographical regions were found for thyroid cancer among both men and women. There was little variation in the incidences of stomach, colorectal, and lung cancer according to geographical region. Substantially elevated incidences of specific cancers were observed in Jeollanam-do (thyroid); Daejeon (colorectum); Jeollanam-do, Gyeongsangbuk-do, and Chungcheongbuk-do (lung); Seocho-gu, Gangnam-gu and Seongnam, Bundang-gu (breast and prostate); Chungcheong and Gyeongsang provinces (stomach); Ulleung-gun and the southern districts of Gyeongsangnam-do and Jeollanam-do (liver); and along the Nakdonggang River (gallbladder and biliary tract).
Conclusion
Mapping regional cancer incidences in Korea allowed us to compare the results according to geographical region. Our results may facilitate the development of infrastructure for systematic cancer incidence monitoring, which could promote the planning and implementation of region-specific cancer management programs.
Cancer creates a significant burden that is expected to grow during the coming years because of population aging. A 2012 GLOBOCAN report highlighted the geographical variation in worldwide cancer incidences [1], and noted up to five-fold differences between countries. The highest incidences for both sexes were noted in Australia/New Zealand and North America, and the lowest incidences were noted in south-central Asia and middle Africa Africa [1], and prostate, colorectal, female breast, and lung cancer incidence rates were several times higher in more developed countries than less developed countries [2]. Possible causes of these international variation in cancer incidence of all cancer combined could be the younger age structure, competing risks of death (such as infection), and lower smoking prevalence in less developed countries [2].
In Korea, the incidence of cancer had increased until 2011, although it has subsequently decreased. The Korea Central Cancer Registry (KCCR) was established as a national cancer incidence database that combines data from the KCCR and 11 population-based regional cancer registries. The KCCR publishes annual cancer statistics for the national and provincial levels. However, district-level incidences have not been published because of concerns regarding the disclosure of private information and statistical stability.
Spatial epidemiology is the description and analysis of geographically indexed health data in terms of demographic, environmental, behavioral, and socioeconomic risk factors. Disease maps provide a visual summary of large amounts of geographical information and have become widely used during recent years. In addition, disease maps can show patterns of diseases within small geographical areas, as they intrinsically provide information regarding the geographical variations in disease patterns. Cancer atlases that provide national or regional incidences have also been developed in many countries, including the United States [3], the United Kingdom and Ireland [4], and Australia [5]. In United Kingdom, only small geographical variations existed in incidence for colorectal, female breast and prostate cancer [4]. In contrast, the rate of lung cancer in patients living in the most deprived areas were three times higher than in the affluent, and very wide geographical variations existed in the incidence of cervical cancer, which is related to patterns in sexual behavior and human papillomavirus infection [4].
Although Statistics Korea has provided district-level cancer mortality data since 2005, district-level cancer incidence data have not been reported. Therefore, we present the first report of district-level temporal trends and spatial variations in cancer incidences throughout Korea according to sex, age, and cancer type.
The KCCR is a nationwide hospital-based cancer registry that was launched by the Korean Ministry of Health and Welfare in 1980. The KCCR was subsequently expanded in 1999 to include the entire Korean population [6]. The present study evaluated cancer incidence data for 1999-2013 that were obtained from the Korean National Cancer Incidence Database. The mid-year populations were obtained from Statistics Korea [7]. To enhance statistical stability, cancer incidence data according sex and geographical region were divided into three 5-year periods (1999-2003, 2004-2008, and 2009-2013). The incidences of eight cancer types were calculated according to their International Classification of Diseases, 10th edition (ICD-10) codes: thyroid cancer (C73), stomach cancer (C16), colorectal cancer (C18-C20), lung cancer (C33-34), female breast cancer (C50), liver cancer (C22), prostate cancer (C61), and gallbladder and biliary tract cancer (C23-24).
Geographical regions were defined and classified in accordance with Statistics Korea’s classification of administrative areas, which are determined according to population and regional characteristics. These areas included 16 metropolitan cities and provinces with 245-249 districts, depending on the specific time period. Inter-regional comparisons were calculated for age-standardized incidences, based on the mid-2000 population of registered residents as the standard population. Disease maps were created using ArcMap software ver. 9.1 (ESRI, Redlands, CA) to visualize regional differences in the incidences. Each quintile interval included the same number of regions and was shown on the regional disease map. Statistical analyses were performed using SAS software ver. 9.3 (SAS Institute Inc., Cary, NC) and STATA software (Stata Corp., College Station, TX).
Table 1 shows the national incidences for each cancer type during the three study periods, as well as regional differences during 2009-2013 among men. The differences in the regional incidences ranged from two- to 13-fold. The largest regional difference was observed for thyroid cancer, while smaller regional differences were observed for stomach, colorectal, and lung cancer. Among women, the regional differences ranged from two- to six-fold (Table 2). The largest regional difference was observed for gallbladder and biliary tract cancer, while smaller regional differences were observed for colorectal, breast, and stomach cancer.
During 2009-2013, elevated incidences of thyroid cancer were observed in most areas of Jeollanam-do, including Yeosu, whereas the lowest incidence was observed in Gangwon-do. High incidences of thyroid cancer were observed in some metropolises, including Seoul, Daejeon, and Daegu, although the district-level difference decreased during the study period (Fig. 1A and C). The national and regional incidences of thyroid cancer increased during the study period for both sexes. In addition, the absolute variation in the regional differences for thyroid cancer incidences broadened over time (Fig. 1B and D).
High incidences of stomach cancer were observed along the border of the Chungcheongbuk-do and Gyeongsangbuk-do. Among men, the highest incidences of stomach cancer during 2009-2013 were observed in Cheongyang-gun, Chungcheongbuk-do (age-standardized rate [ASR], 94.3), whereas the highest incidences among women were observed in Uljin-gun, Gyeongsangbuk-do (ASR, 44.4) (Fig. 2A and C). The national and regional incidences and their variations for stomach cancer decreased during the study period among men and women (Fig. 2B and D).
High incidences of colorectal cancer were observed in the Daejeon and Chungcheong Province. Among men, the highest incidences of colorectal cancer during 2009-2013 were observed in Chungcheongbuk-do, and especially in Jeungpyeong-gun (ASR, 68.2). Similarly, among women, the highest incidences of colorectal cancer were observed in Chungcheong Province, with a maximum incidence in the Cheongyang-gun district of Chungcheongnam-do (ASR, 39.3) (Fig. 3A and C). The national and regional incidences of colorectal cancer increased during the study period among men and women (Fig. 3B and D).
The incidences of lung cancer varied according to period, region, and sex, although no consistently elevated incidences were observed in any of the regions, and the regional differences were relatively small. During 2009-2013, elevated incidences of lung cancer among men were observed in Gunwi-gun, Gyeongsangbuk-do (ASR, 73.7), compared to in Boeun-gun, Chungcheongbuk-do for women (ASR, 23.1) (Fig. 4A and C). During the study period, the incidence of lung cancer decreased among men and increased among women (Fig. 4B and D).
During 2009-2013, high incidences of breast cancer were observed in Seocho-gu, Seoul (ASR, 65.1), Gangnam-gu, Seoul (ASR, 64.4), Suji-gu, Gyeonggi-do (ASR, 63.0), and Bundang-gu, Seongnam, Gyeonggi-do (ASR, 62.2). The national and regional incidences of breast cancer increased during the study period (Fig. 5).
High incidences of liver cancer were found in Ulleung-gun, Gyeongsangbuk-do, and along the southern coastal areas of the Gyeongsangnam-do and Jeollanam-do. In Ulleung-gun, Gyeongsangbuk-do, liver cancer was ranked among the top 10 cancers for women in terms of incidence. The national and regional incidences of liver cancer decreased during the study period (Fig. 6).
The incidences of prostate cancer were consistently high in Gangnam-gu, Seoul (1999-2003 ASR, 20.4; 2004-2008 ASR, 37.5; 2009-2013 ASR, 42.2), Seocho-gu, Seoul (1999-2003 ASR, 20.0; 2004-2008 ASR, 39.5; 2009-2013 ASR, 43.4), and Bundang-gu, Seongnam, Gyeonggi-do (1999-2003 ASR, 17.6; 2004-2008 ASR, 48.1; 2009-2013 ASR, 44.8). The national and regional incidences of prostate cancer increased gradually during the study period (Fig. 7).
The incidences of gallbladder and biliary tract cancer were elevated in regions downstream from the Nakdonggang River. Among men, the incidence during 2009-2013 was highest in Haman-gun, Gyeongsangnam-do (ASR, 15.4), with consistently high incidences in Haman-gun and Milryang, Gyeongsangnam-do (Fig. 8). Among women, the incidence of gallbladder and biliary tract cancer was high in Gangseo-gu, Busan district.
The present study revealed differences in Korean cancer incidences according to geographical region and cancer type. Thyroid cancer had the greatest district-level differences, as well as a sharp increase in its incidence during the study period. The absolute differences in the incidences of stomach, colorectal, liver, and lung cancer were larger among men, compared to among women. The incidence rate of lung cancer and stomach cancer is mainly attributable to smoking rate [8] and the incidence rate of colorectal cancer and liver cancer is affected by alcohol drinking [9]. Generally, the regional gap in smoking rate or alcohol drinking among men are much greater than among women [10]. This may be one of the reasons of sex disparity in these types of cancer. High incidences of breast and prostate cancer were observed in the Gangnam-gu, Seocho-gu, and Bundang-gu districts. In addition, high incidences of liver cancer were observed along the southern coastal area. Furthermore, high incidences of gallbladder and biliary tract cancer were observed in regions downstream from the Nakdonggang River.
Regarding the regional differences in cancer incidence, the district-level difference of thyroid cancer incidence has increased both in men and women from 1999-2003 to 2009-2013. For men, gap of cancer incidence of stomach cancer, lung cancer by region has decreased from 1999-2003 to 2009-2013, whereas the difference in regional colorectal cancer has increased during the same period. There was no clear trend in regional difference in cancer incidence of liver cancer, prostate cancer, and gallbladder and biliary tract cancer in men. For women, regional gap in cancer incidence of breast cancer, lung cancer has increased from 1999-2003 to 2009-2013, whereas there were no notable changes in regional differences in cancer incidence of colorectal cancer, stomach cancer, liver cancer, and gallbladder and biliary tract cancer. However, it is beyond the scope of this study to know why there are increasing or decreasing pattern in the regional difference in cancer incidence. Further sophisticated epidemiological study including changes in the screening patterns and related risk factors will be necessary.
Although we do not have clear evidence regarding the reasons for these geographical differences, there are several possible explanations. First, there were regional differences in the distributions of major cancer risk factors. For example, the high incidences of liver cancer in the southern districts of the Jeollanam-do and Gyeongsangnam-do could be attributed to the elevated rates of hepatitis B and C in these areas. A 2009 program with nationwide hepatitis B antigen and antibody screening revealed high positivity for hepatitis B surface antigens in the Gyeongsangnam-do (4.5%) and Jeollanam-do (5.6%) [11]. Compared to other provinces, elevated prevalences of hepatitis C antigens have also been observed in the Busan, Gyeongsangnam-do, and Jeollanam-do [12]. The high incidences of gallbladder and biliary tract cancer in the regions around the Nakdonggang River may be partially attributable to the high prevalence of clonorchiasis in these areas, based on a recent nationwide survey of intestinal parasite infections [13].
Another possible explanation for the differences in regional cancer incidences could be regional differences in cancer screening practices. Especially, the rapid increase in thyroid cancer is mostly due to increase in screening practice. A study of Brito et al. [14] showed that there was a high correlation between regional incidence of thyroid cancer and regional screening rate for thyroid cancer. According to the Korean Community Health Survey [10], breast cancer screening rates were higher in regions with high reported incidences of breast cancer. Thus, the apparently elevated incidences of breast cancer in the Gangnam-gu, Seocho-gu, and Bundang-gu districts may be partially attributable to high screening rates. However, there was no clear association between regional screening rate and other type of cancer included in national cancer screening program.
A third possible explanation is that cancer incidences are affected by differences in socioeconomic status and health behaviors. For example, smoking is a well-known risk factor for various cancers, including lung cancer and stomach cancer, and approximately 46.5% of the risk of lung cancer in Korea can be attributed to smoking [8]. Socioeconomic status also affects participation in cancer screening [15,16] and is strongly associated with smoking, alcohol consumption, physical activity, and female hormonal and reproductive factors, such as age at menarche, birth rate, and age at first birth [17-20].
The present study has several limitations. First, the patients’ addresses were recorded at their cancer diagnosis, although those addresses might not reflect previous residential environments, which could be associated with substantial risk factors. Second, the different population sizes in each region could induce large fluctuations in the cancer statistics for each administrative district, compared to national cancer statistics for the same time period.
Nevertheless, our disease maps provide a substantial amount of information regarding regional cancer incidences in intuitive and easily interpretable images. The data may facilitate the identification of previously unrecognized high-risk regions, which could allow regional health authorities to create region-specific cancer screening, treatment planning, and management programs.
This study is the first to examine the district-level cancer incidences throughout Korea. The results can be used by local governments to plan and implement cancer management projects that are tailored to the characteristics of their region. Detailed regional variation and trends for cancer incidence are available through the National Statistics Portal (http://kosis.kr).
ACKNOWLEDGMENTS
This work was supported by a research grant from the National Cancer Center (1610220), Republic of Korea. The authors thank the Korea Central Cancer Registry (KCCR)-affiliated hospitals, non-KCCR-affiliated hospitals, the National Health Insurance Service, and Statistics Korea for data collection.
References
1. International Agency for Research on Cancer. GLOBOCAN 2012: estimated cancer incidence, mortality and prevalence worldwide in 2012 [Internet]. Lyon: International Agency for Research on Cancer;2012. [cited 2017 Aug 17]. Available from: http://publications.iarc.fr/Databases/Iarc-Cancerbases/Globocan-2012-Estimated-Cancer-Incidence-Mortality-And-Prevalence-Worldwide-In-2012-V1-0-2012.
2. Torre LA, Bray F, Siegel RL, Ferlay J, Lortet-Tieulent J, Jemal A. Global cancer statistics, 2012. CA Cancer J Clin. 2015; 65:87–108.

3. U.S. Cancer Statistics Working Group. United States cancer statistics: 1999-2014 incidence and mortality web-based report [Internet]. Atlanta, GA: Department of Health and Human Services, Centers for Disease Control and Prevention and National Cancer Institute;2017. [cited 2017 Aug 17]. Available from: http://www.cdc.gov/uscs.
4. Quinn M, Wood H, Cooper N, Rowan S. Cancer atlas of the United Kingdom and Ireland 1991-2000. New York: Palgrave Macmillan;2005.
5. Cramb S, Mengersen K, Baade P. Atlas of cancer in Queensland: geographical variations in incidence and survival 1998-2007. Fortitude Valley: Viertel Centre for Research in Cancer Control, Cancer Council Queensland;2011.
6. Shin HR, Won YJ, Jung KW, Kong HJ, Yim SH, Lee JK, et al. Nationwide cancer incidence in Korea, 1999~2001: first result using the national cancer incidence database. Cancer Res Treat. 2005; 37:325–31.

7. Statistics Korea [Internet]. Daejeon: Statistics Korea;2017. [cited 2017 Aug 17]. Available from: http://kosis.kr.
8. Park S, Jee SH, Shin HR, Park EH, Shin A, Jung KW, et al. Attributable fraction of tobacco smoking on cancer using population-based nationwide cancer incidence and mortality data in Korea. BMC Cancer. 2014; 14:406.

9. Park S, Shin HR, Lee B, Shin A, Jung KW, Lee DH, et al. Attributable fraction of alcohol consumption on cancer using population-based nationwide cancer incidence and mortality data in the Republic of Korea. BMC Cancer. 2014; 14:420.

10. Korea Centers for Disease Control and Prevention; Ministry of Health and Welfare. 2011 Korea Community Health Survey [Internet]. Cheongju: Korea Centers for Disease Control and Prevention;2012. [cited 2017 Aug 17]. Available from: https://chs.cdc.go.kr/chs/.
11. Lee BS, Cho YK, Jeong SH, Lee JH, Lee D, Park NH, et al. Nationwide seroepidemiology of hepatitis B virus infection in South Korea in 2009 emphasizes the coexistence of HBsAg and anti-HBs. J Med Virol. 2013; 85:1327–33.

12. Kwon GY, Lee H, Gwack J, Lee SW, Ki M, Youn SK. Regional distribution of hepatitis C virus infection in the Republic of Korea, 2007-2011. Gut Liver. 2014; 8:428–32.

13. Jeong YI, Shin HE, Lee SE, Cheun HI, Ju JW, Kim JY, et al. Prevalence of Clonorchis sinensis infection among residents along 5 Major Rivers in the Republic of Korea. Korean J Parasitol. 2016; 54:215–9.
14. Brito JP, Kim HJ, Han SJ, Lee YS, Ahn HS. Geographic distribution and evolution of thyroid cancer epidemic in South Korea. Thyroid. 2016; 26:864–5.

15. Lee M, Park EC, Chang HS, Kwon JA, Yoo KB, Kim TH. Socioeconomic disparity in cervical cancer screening among Korean women: 1998-2010. BMC Public Health. 2013; 13:553.

16. Faggiano F, Partanen T, Kogevinas M, Boffetta P. Socioeconomic differences in cancer incidence and mortality. IARC Sci Publ. 1997; 138:65–176.
17. Hiscock R, Bauld L, Amos A, Fidler JA, Munafo M. Socioeconomic status and smoking: a review. Ann N Y Acad Sci. 2012; 1248:107–23.

18. van Oers JA, Bongers IM, van de Goor LA, Garretsen HF. Alcohol consumption, alcohol-related problems, problem drinking, and socioeconomic status. Alcohol Alcohol. 1999; 34:78–88.

19. Lindstrom M, Hanson BS, Ostergren PO. Socioeconomic differences in leisure-time physical activity: the role of social participation and social capital in shaping health related behaviour. Soc Sci Med. 2001; 52:441–51.
20. Robert SA, Strombom I, Trentham-Dietz A, Hampton JM, McElroy JA, Newcomb PA, et al. Socioeconomic risk factors for breast cancer: distinguishing individual- and community-level effects. Epidemiology. 2004; 15:442–50.
Fig. 1.
District-level incidences (2009-2013) (A, C) and incidence trends (1999-2013) (B, D) for thyroid cancer.
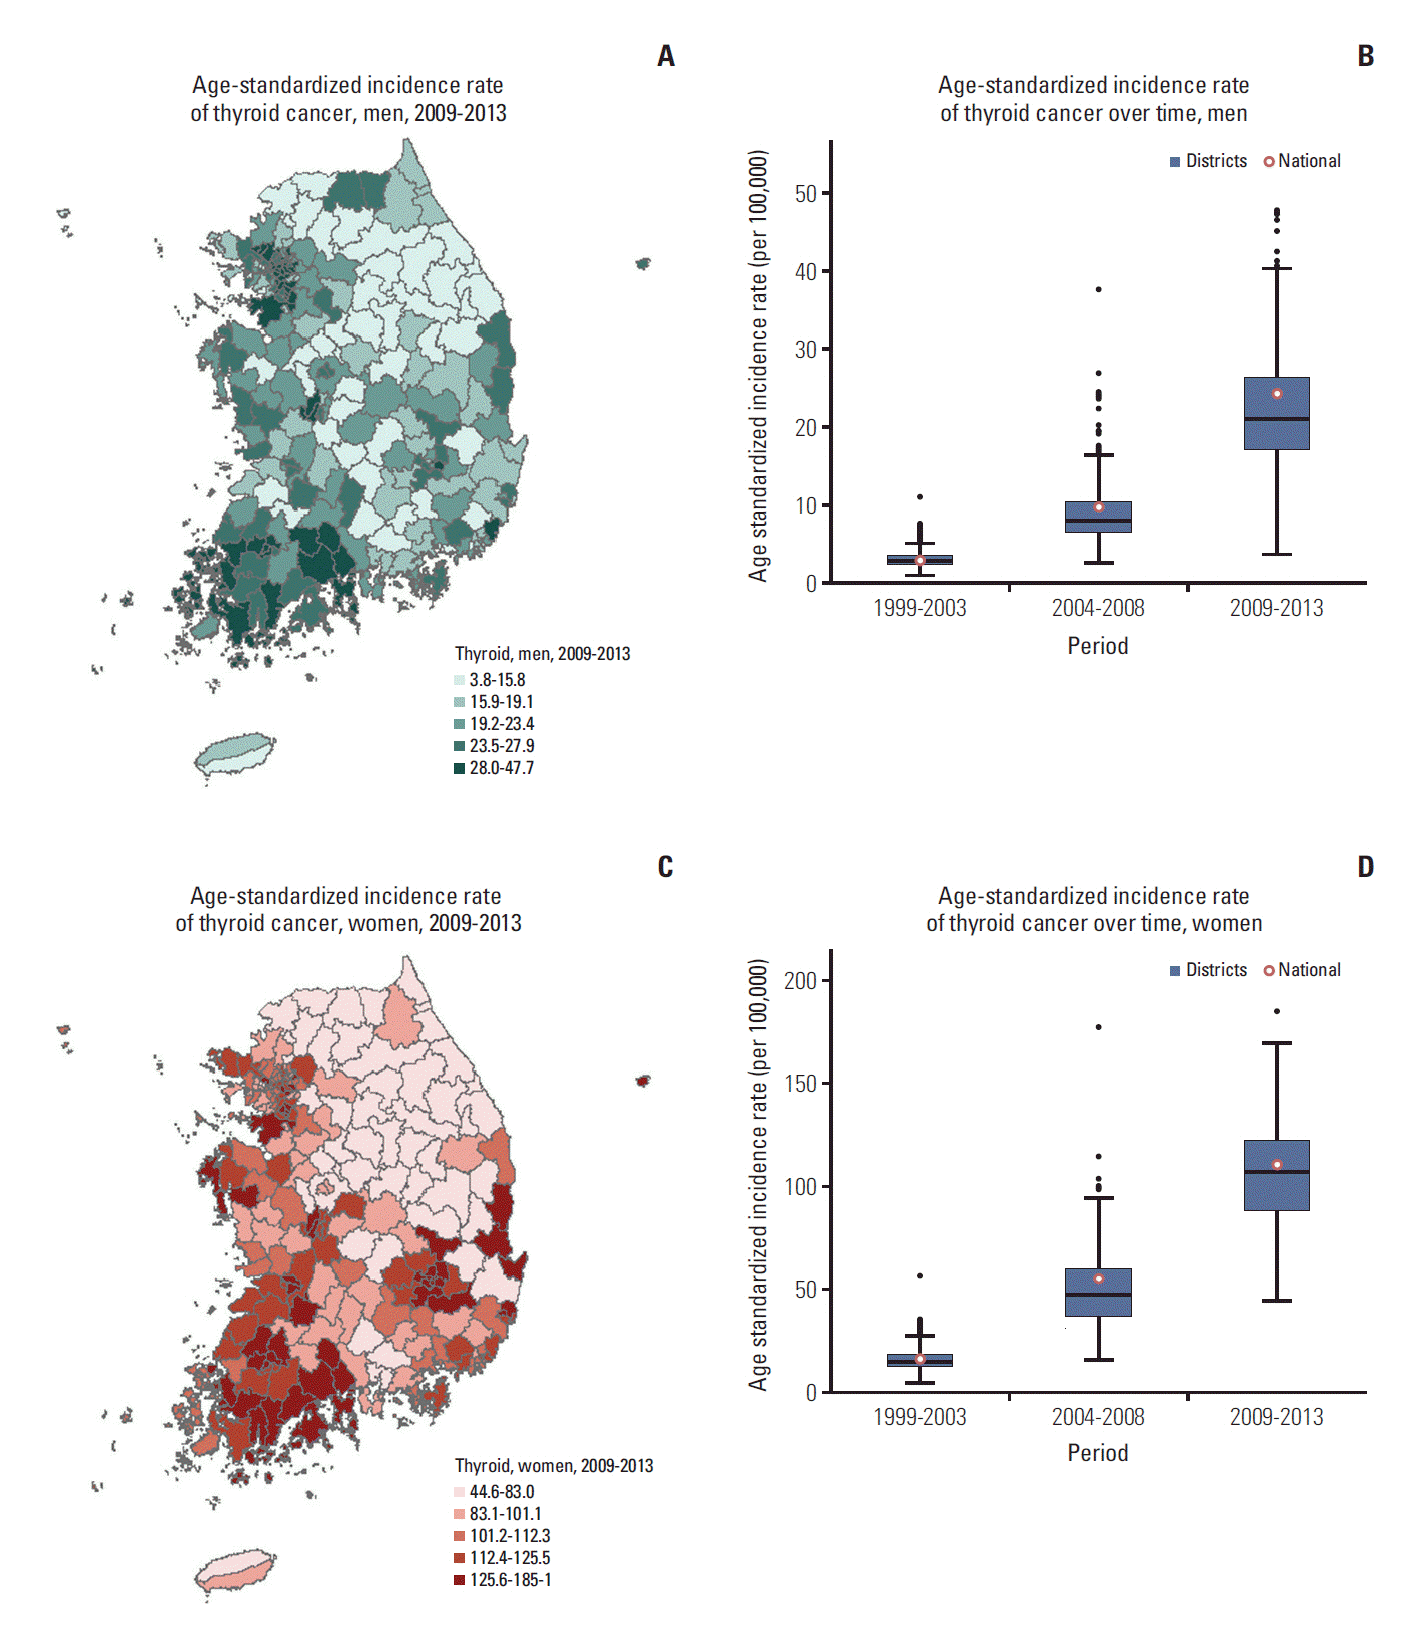
Fig. 2.
District-level incidences (2009-2013) (A, C) and incidence trends (1999-2013) (B, D) for stomach cancer.
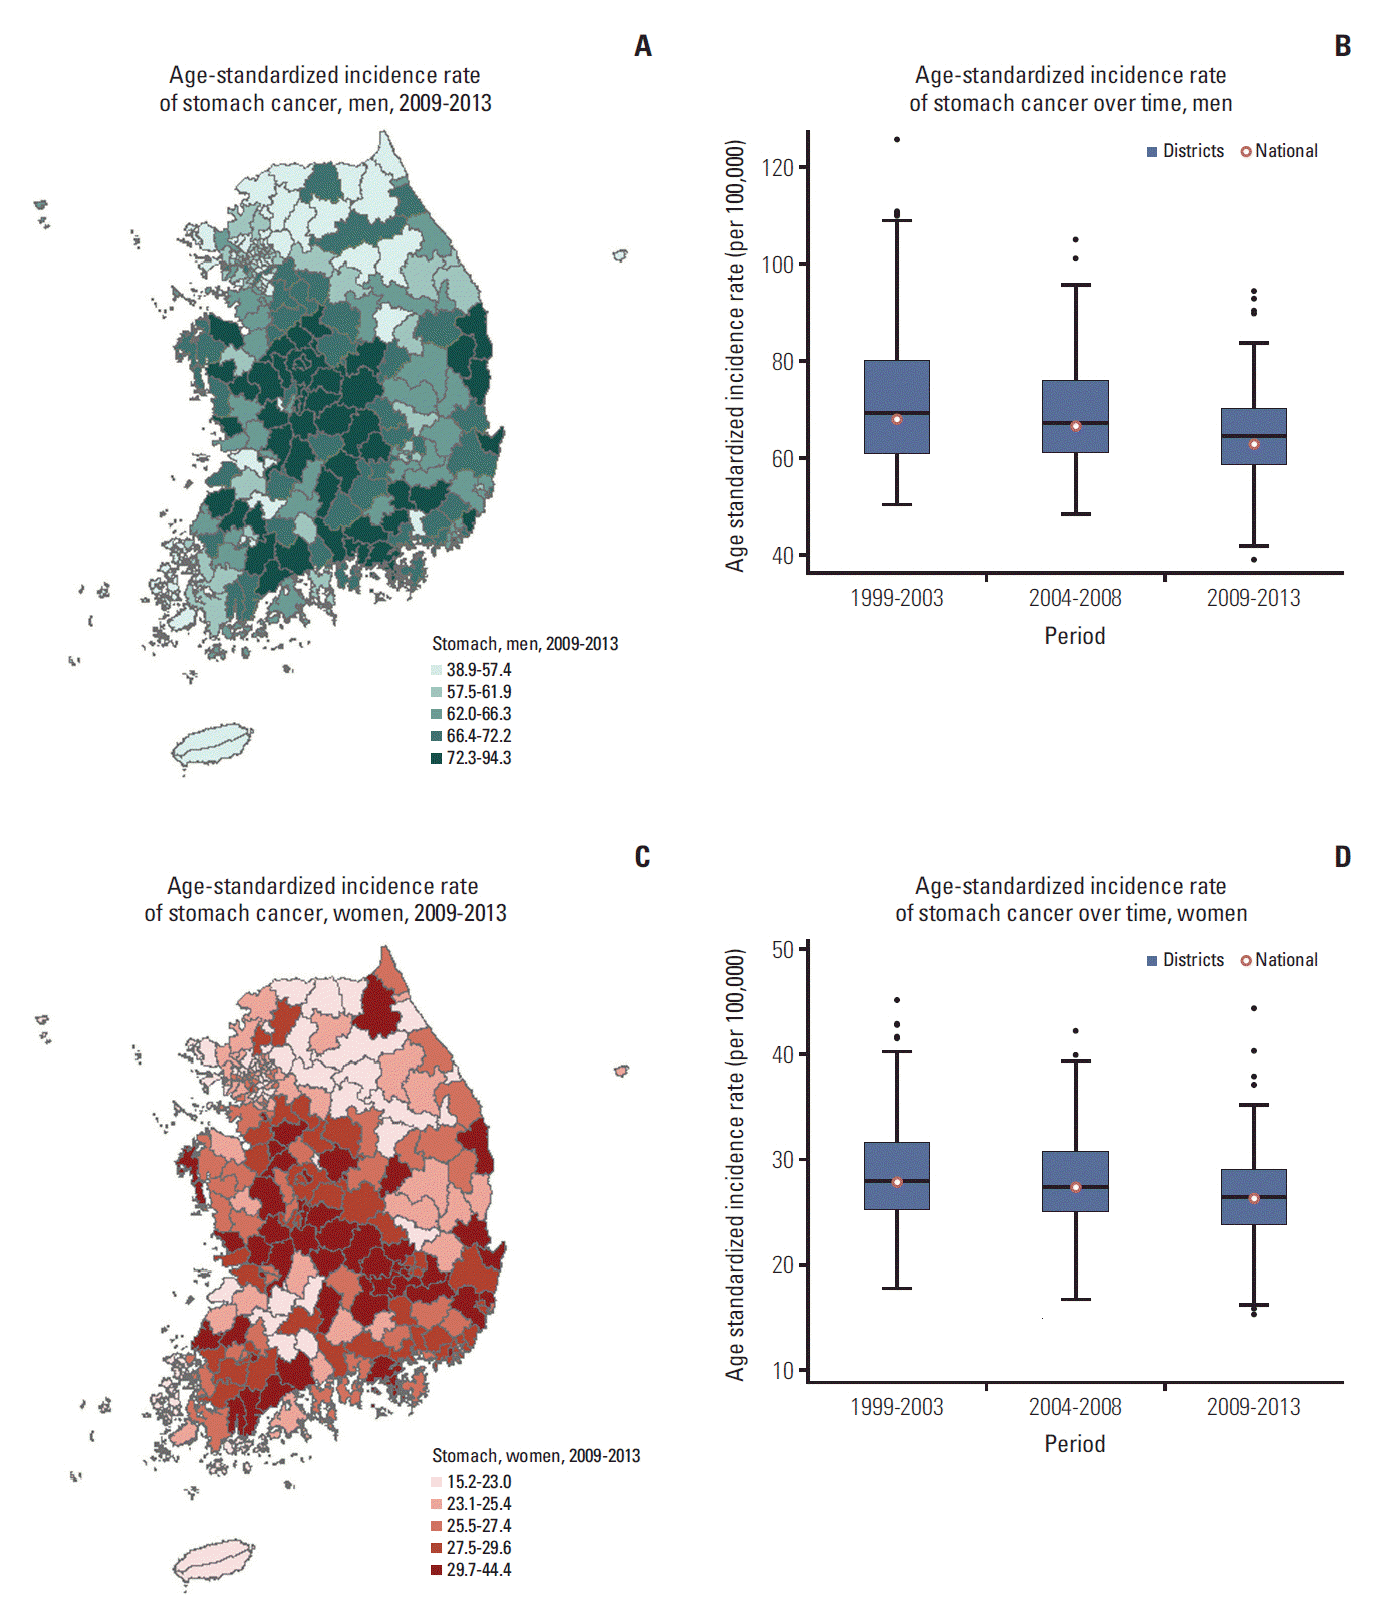
Fig. 3.
District-level incidences (2009-2013) (A, C) and incidence trends (1999-2013) (B, D) for colorectal cancer.
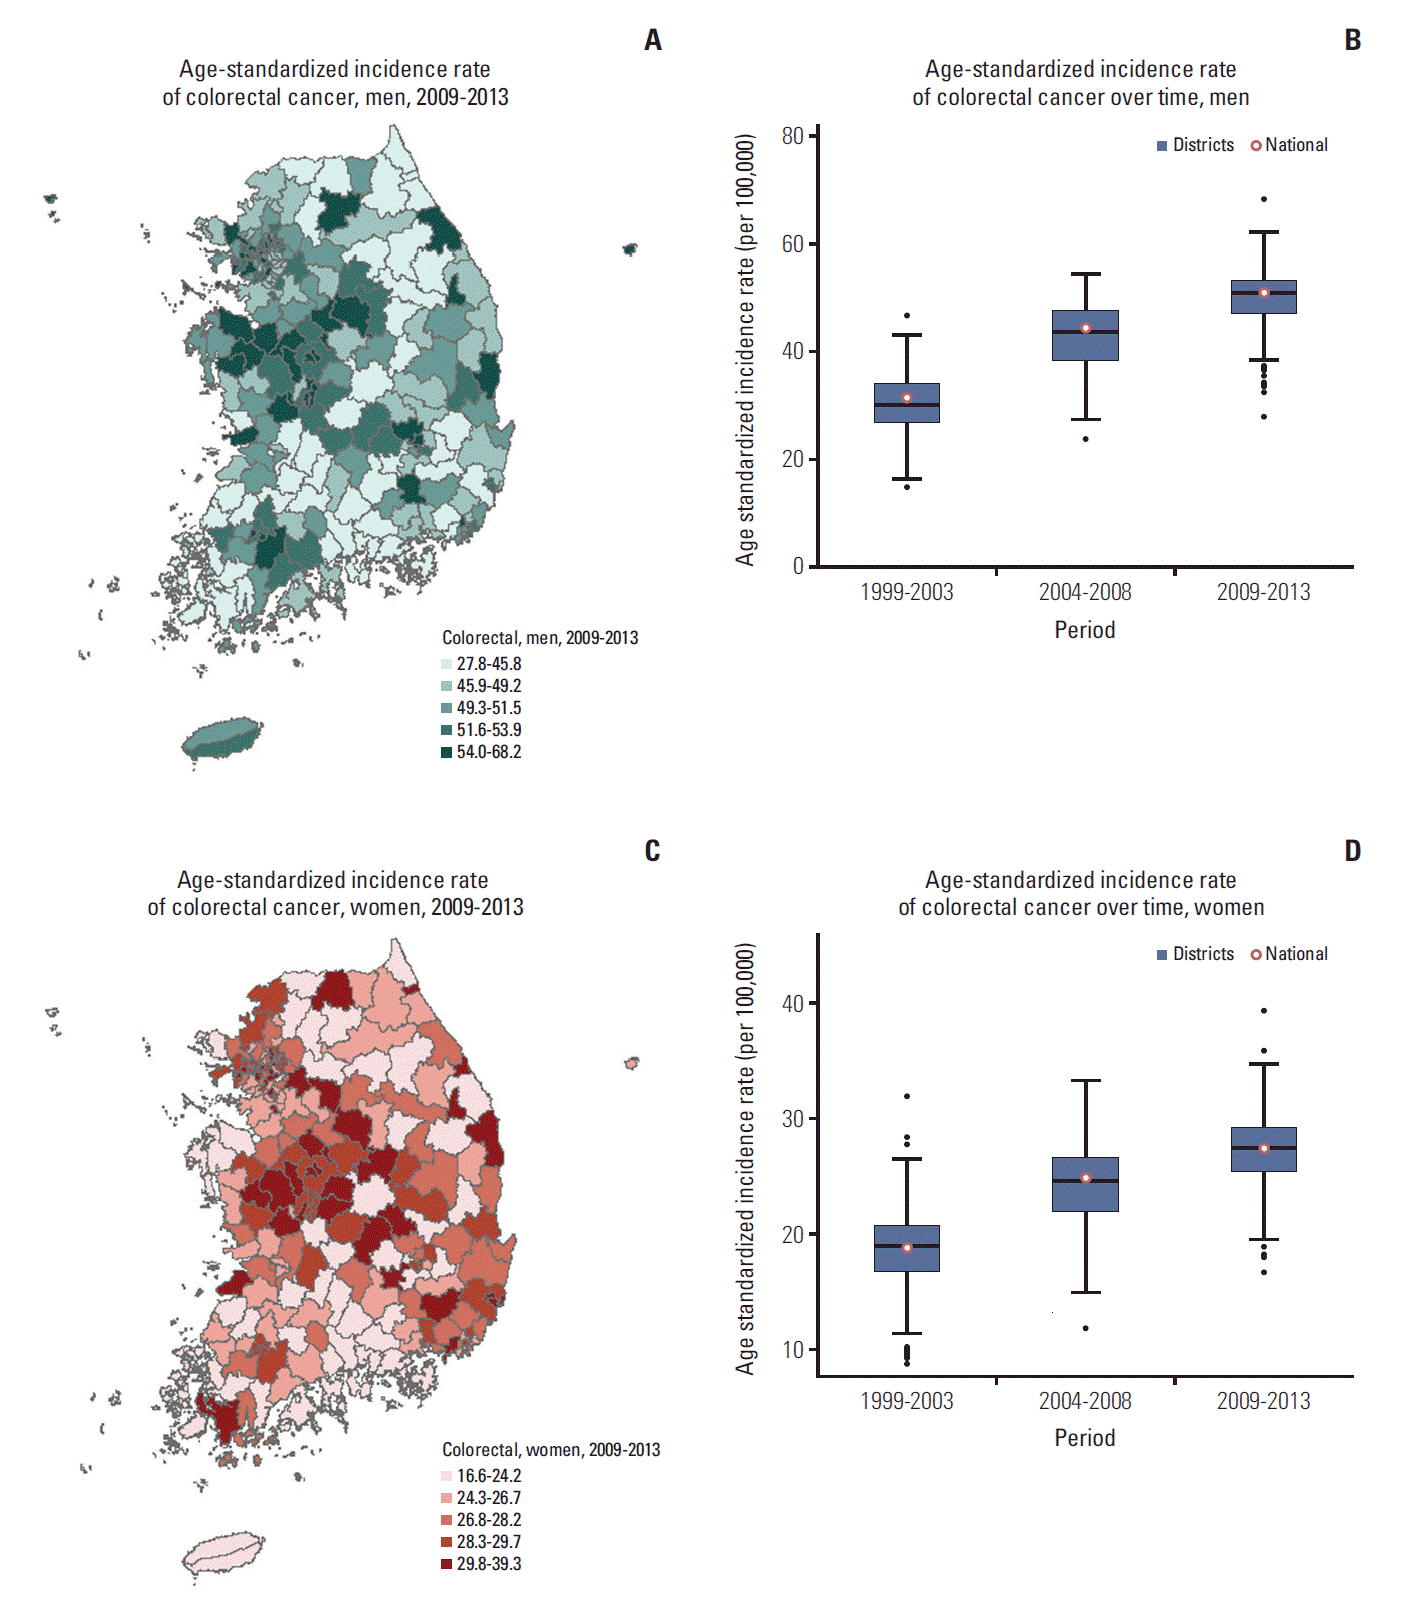
Fig. 4.
District-level incidences (2009-2013) (A, C) and incidence trends (1999-2013) (B, D) for lung cancer.
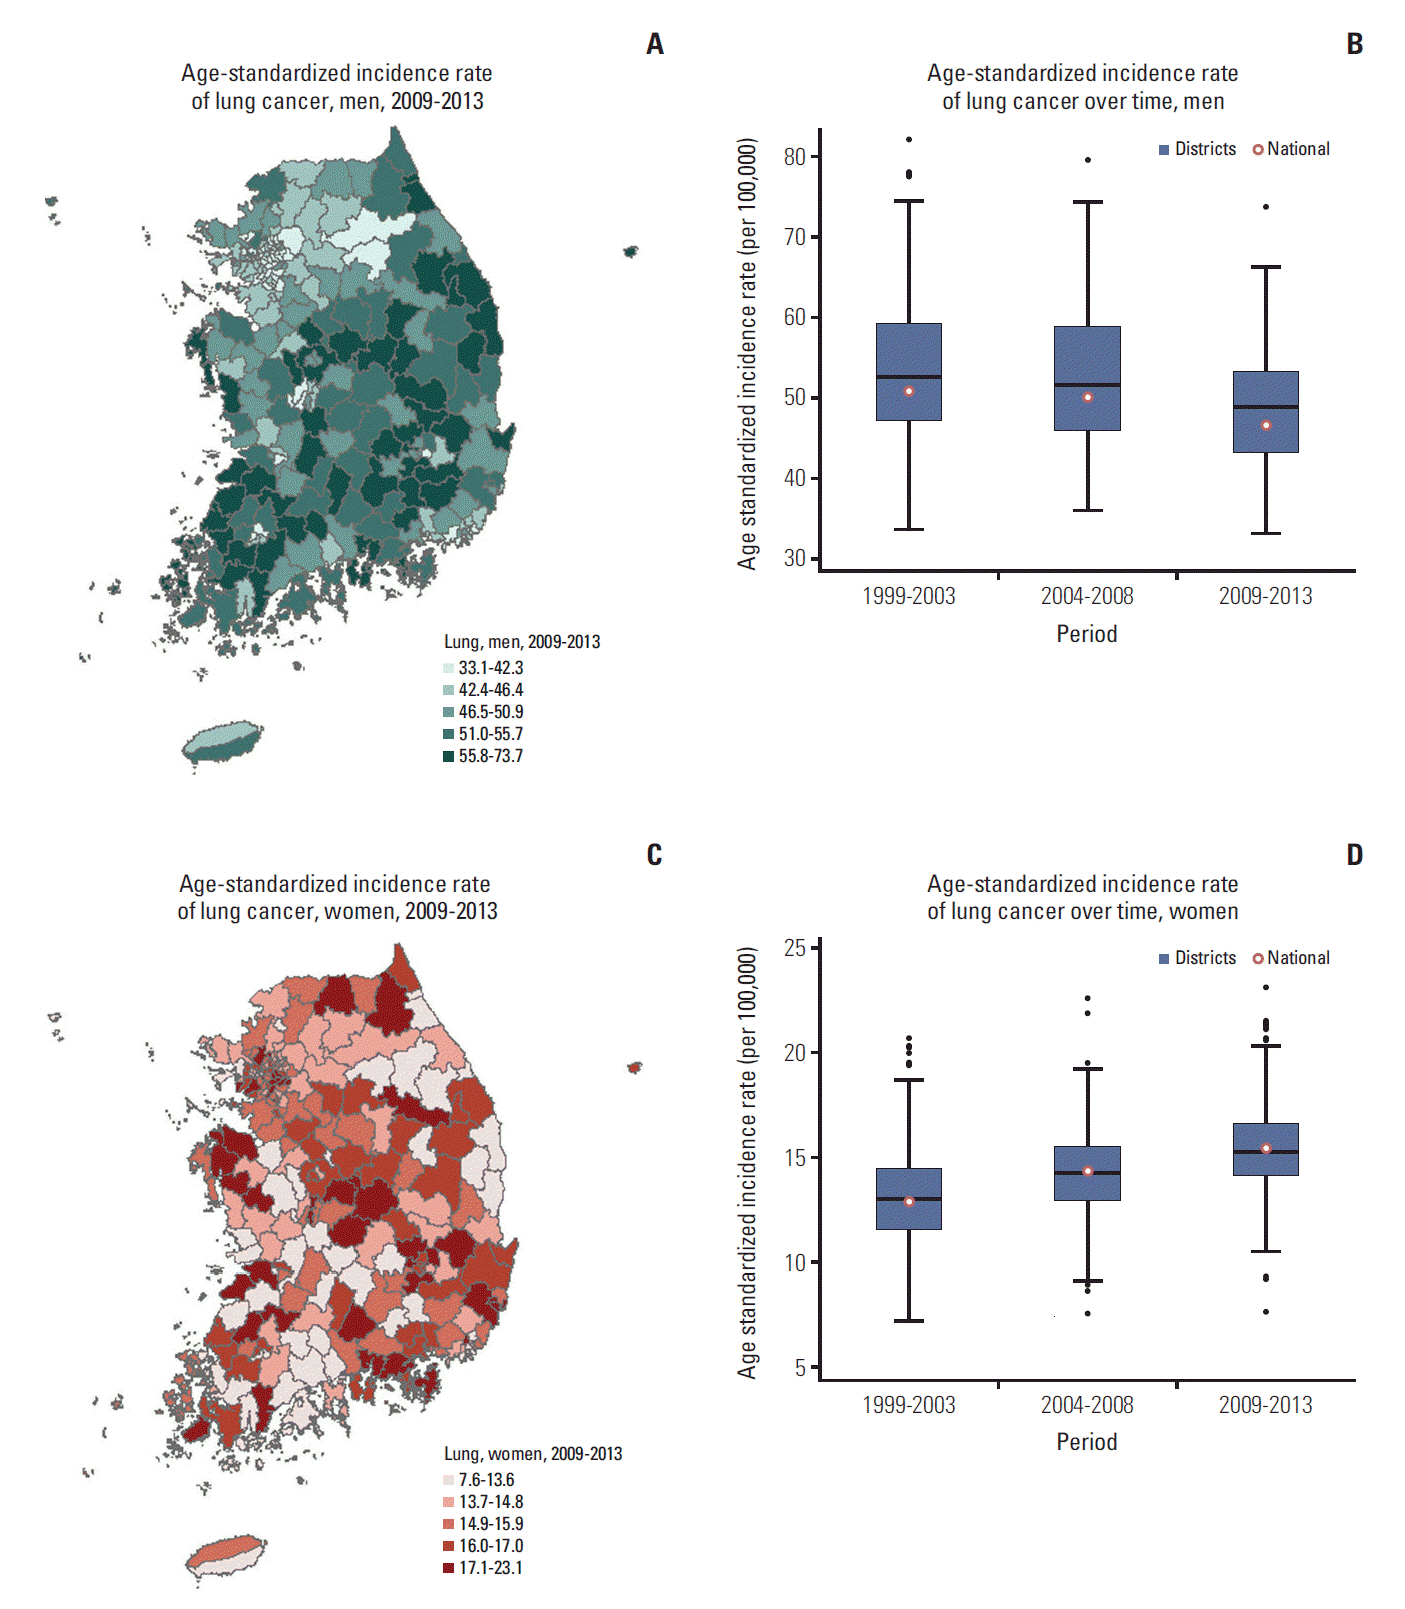
Fig. 5.
District-level incidences (2009-2013) (A) and incidence trends (1999-2013) (B) for breast cancer.
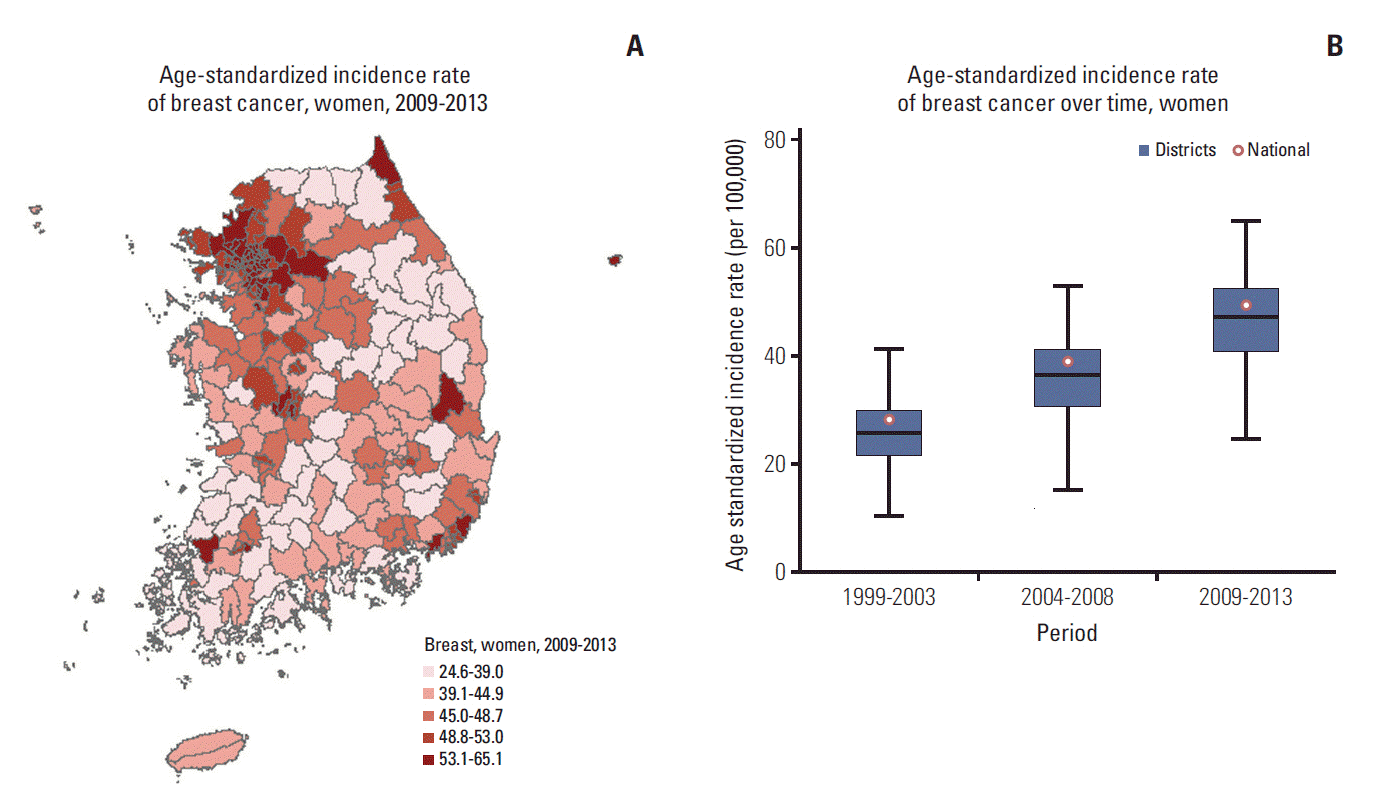
Fig. 6.
District-level incidences (2009-2013) (A, C) and incidence trends (1999-2013) (B, D) for liver cancer.
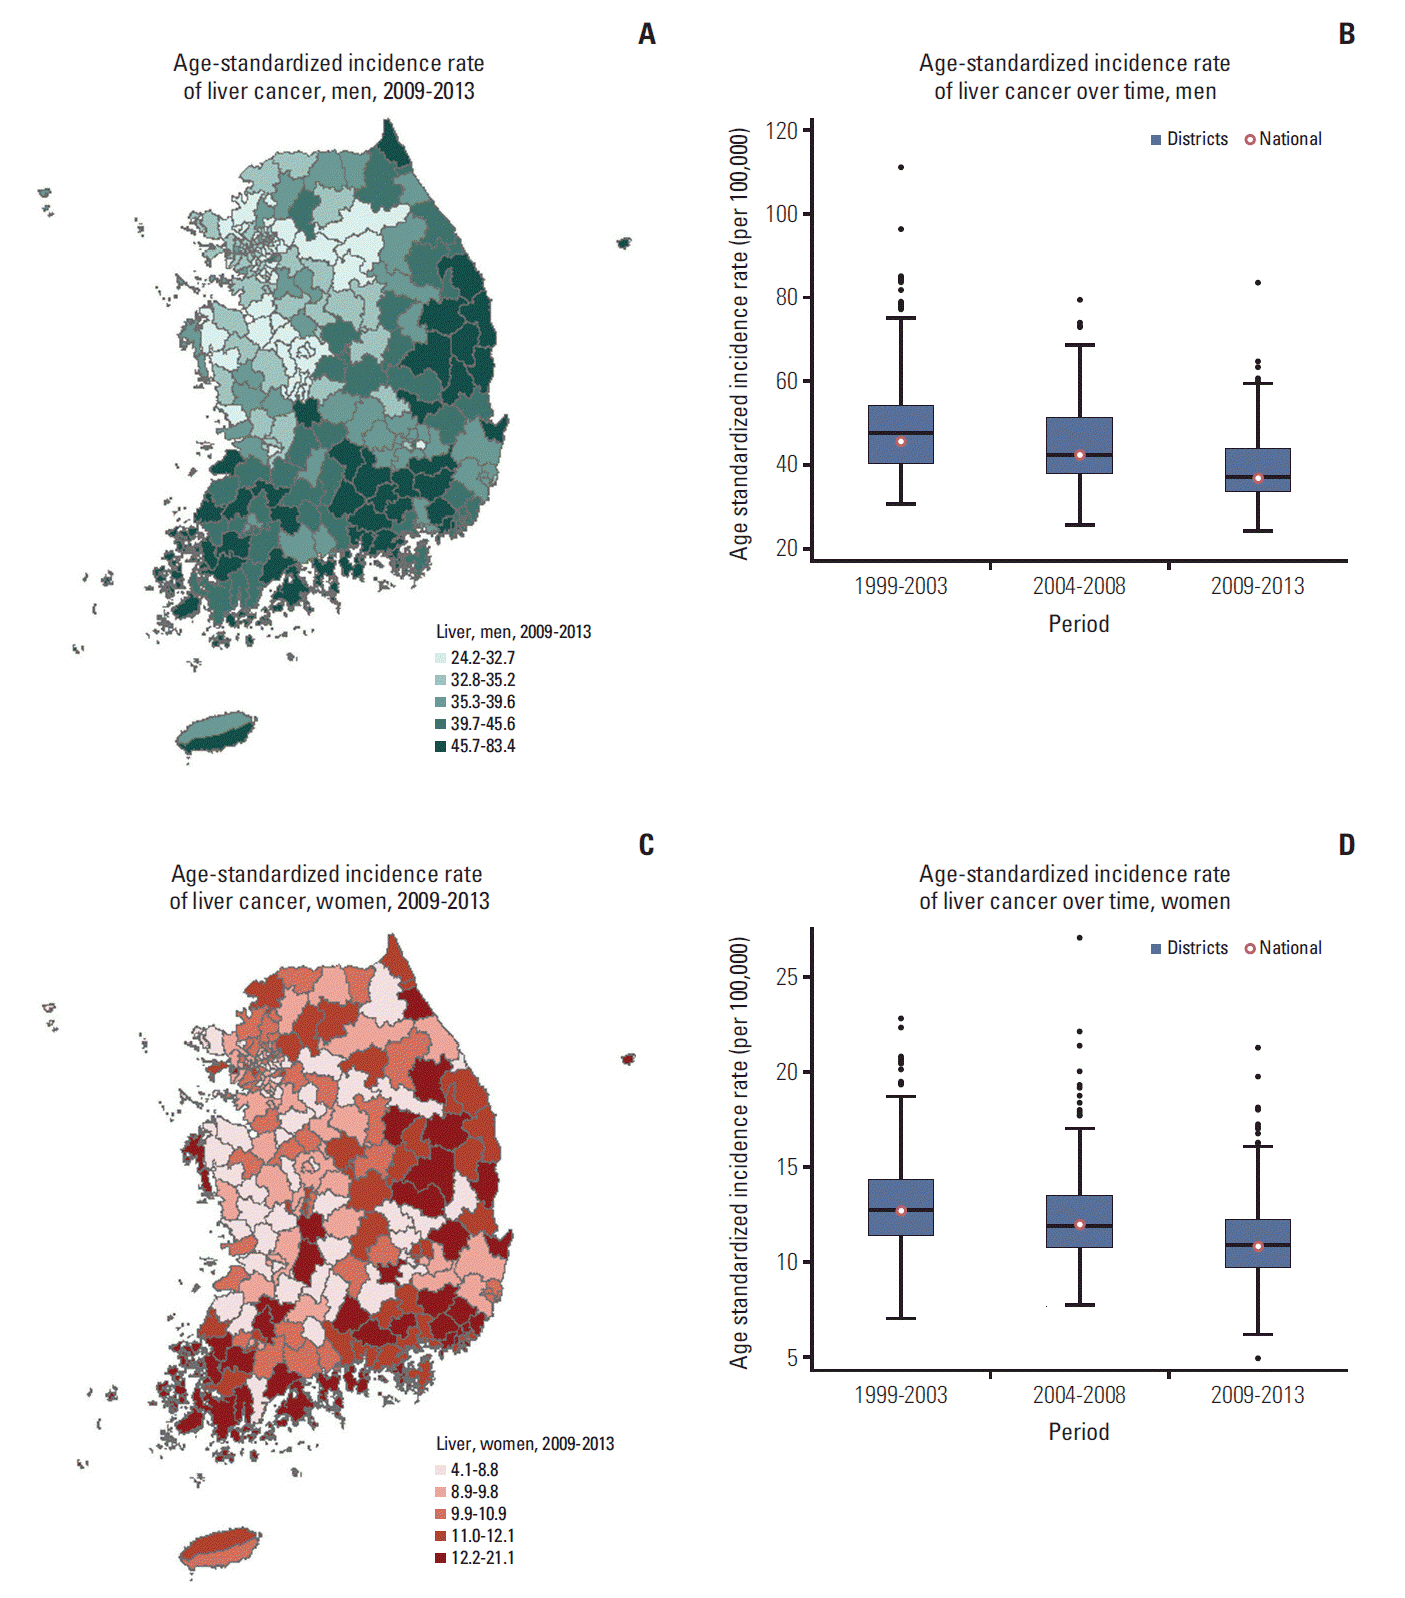
Fig. 7.
District-level incidences (2009-2013) (A) and incidence trends (1999-2013) (B) for prostate cancer.
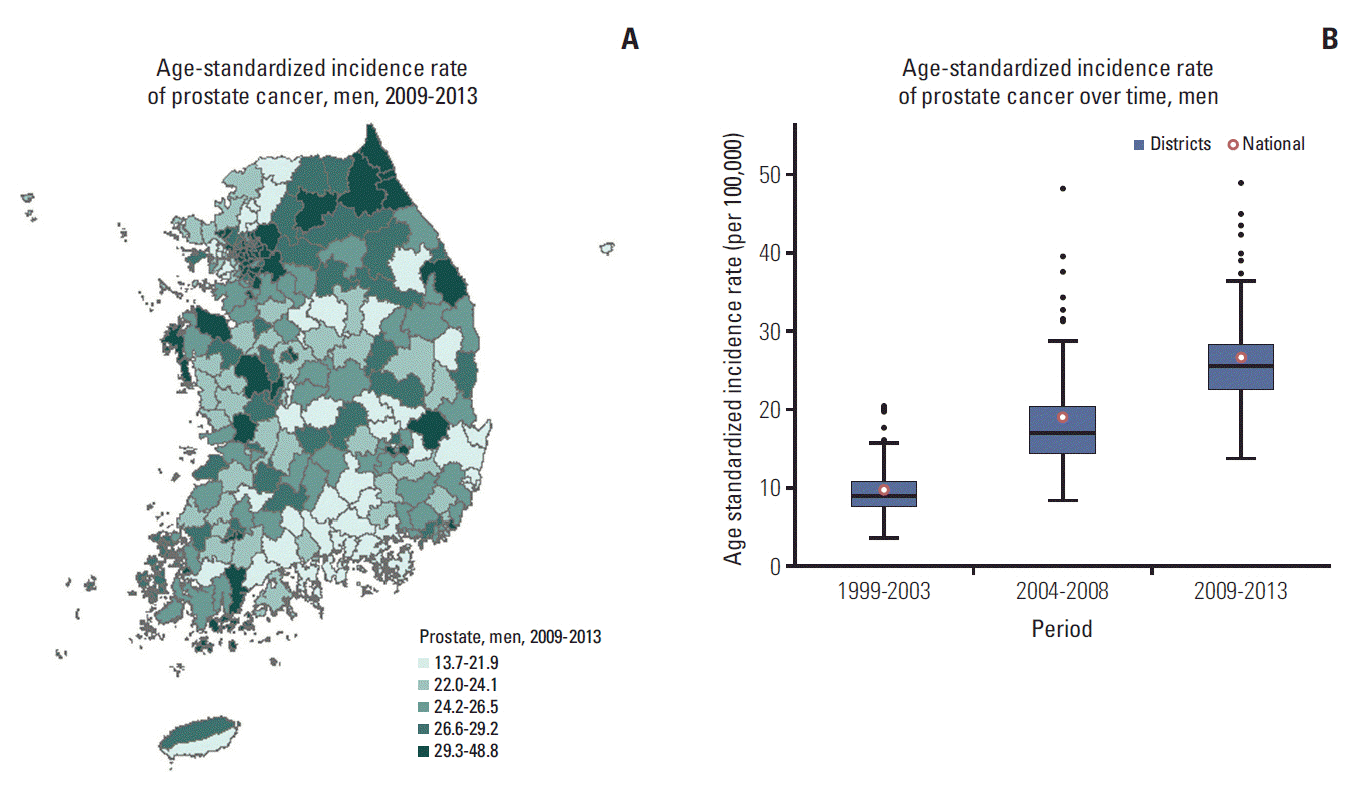
Fig. 8.
District-level incidences (2009-2013) (A, C) and incidence trends (1999-2013) (B, D) for gallbladder and biliary tract cancer.
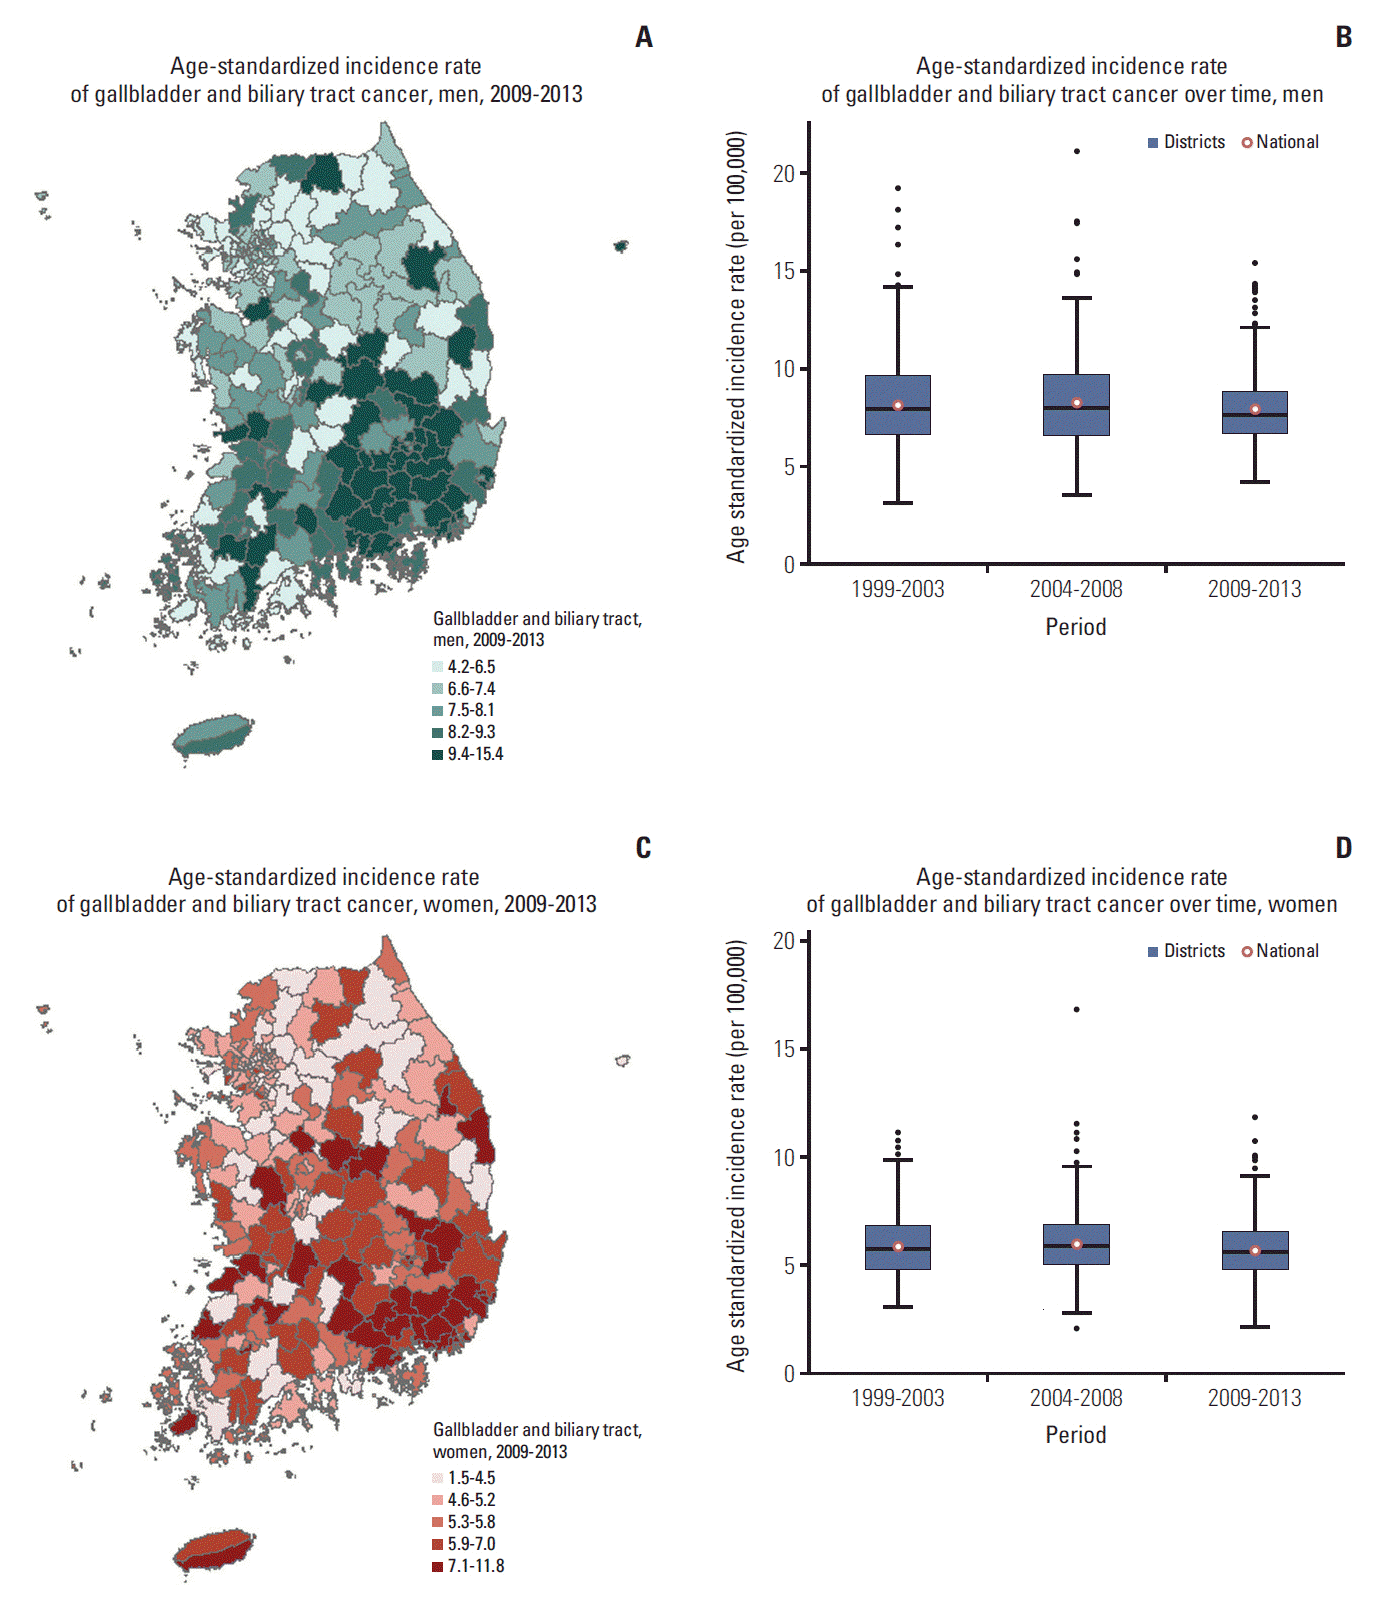
Table 1.
National and regional trends and changes in the incidences of cancers among Korean men
| Cancer |
National incidences (cases per 100,000 persons) |
Regional incidences (cases per 100,000 persons) |
||||||
|---|---|---|---|---|---|---|---|---|
|
2009-2013 |
||||||||
| 1999-2003 | 2004-2008 | 2009-2013 | Min | Median | Max | Absolute differencea) | Relative differenceb) | |
| Stomach | 67.9 | 66.5 | 63.0 | 38.9 | 64.3 | 94.3 | 55.4 | 2.4 |
| Colorectum | 31.1 | 44.3 | 50.8 | 27.8 | 50.5 | 68.2 | 40.4 | 2.5 |
| Lung | 50.8 | 50.1 | 46.6 | 33.1 | 48.8 | 73.7 | 40.6 | 2.2 |
| Liver | 45.7 | 42.3 | 36.8 | 24.2 | 37.2 | 83.4 | 59.2 | 3.4 |
| Prostate | 9.7 | 19.0 | 26.5 | 13.7 | 25.4 | 48.8 | 35.1 | 3.6 |
| Thyroid | 2.9 | 9.8 | 24.3 | 3.8 | 20.9 | 47.7 | 43.9 | 12.6 |
| Gallbladder and biliary tract | 8.1 | 8.5 | 7.9 | 4.2 | 7.6 | 15.4 | 11.2 | 9.9 |
Table 2.
National and regional trends and changes in the incidences of cancers among Korean women
| Cancer |
National incidences (cases per 100,000 persons) |
Regional incidences (cases per 100,000 persons) |
||||||
|---|---|---|---|---|---|---|---|---|
|
2009-2013 |
||||||||
| 1999-2003 | 2004-2008 | 2009-2013 | Min | Median | Max | Absolute differencea) | Relative differenceb) | |
| Thyroid | 16.7 | 55.2 | 110.6 | 44.6 | 106.8 | 185.1 | 140.5 | 4.2 |
| Breast | 28.2 | 39.0 | 49.5 | 24.6 | 46.9 | 65.1 | 40.5 | 2.6 |
| Colorectum | 18.8 | 24.8 | 27.4 | 16.6 | 27.3 | 39.3 | 22.7 | 2.4 |
| Stomach | 27.8 | 27.3 | 26.3 | 15.2 | 26.4 | 44.4 | 29.2 | 2.9 |
| Lung | 12.9 | 14.3 | 15.4 | 7.6 | 15.2 | 23.1 | 15.5 | 3.0 |
| Liver | 12.2 | 11.4 | 10.2 | 4.1 | 10.3 | 21.1 | 17.0 | 5.1 |
| Gallbladder and biliary tract | 5.8 | 5.9 | 5.6 | 2.1 | 5.5 | 11.8 | 9.7 | 5.6 |


 PDF
PDF Citation
 Print
Print


 XML Download