Journal List > Cancer Res Treat > v.50(3) > 1153597

Chen, Tang, Tang, Chen, Guo, Liu, Li, Li, Liang, Sun, Guo, Mo, Sun, Luo, Fan, He, Chen, Cao, Qian, Guo, and Mai: Pretreatment Serum Amyloid A and C-reactive Protein Comparing with Epstein-Barr Virus DNA as Prognostic Indicators in Patients with Nasopharyngeal Carcinoma: A Prospective Study

Abstract

Purpose

The measuring Epstein-Barr virus (EBV) DNA is an important predictor of nasopharyngeal carcinoma (NPC). This study evaluated the predictive value of pretreatment serum amyloid A (SAA) and C-reactive protein (CRP) comparing with EBV DNA in patients with NPC.

Materials and Methods

In an observational study of 419 non-metastatic NPC patients, we prospectively evaluated the prognostic effects of pretreatment SAA, CRP, and EBV DNA on survival. The primary end-point was progress-free survival (PFS).

Results

The median level of SAA and CRP was 4.28 mg/L and 1.88 mg/L, respectively. For the high-SAA group (> 4.28 mg/L) versus the low-SAA (≤ 4.28 mg/L) group and the high-CRP group (> 1.88 mg/L) versus the low-CRP (≤ 1.88 mg/L) group, the 5-year PFS was 64.5% versus 73.1% (p=0.013) and 65.2% versus 73.3% (p=0.064), respectively. EBV DNA detection showed a superior predictive result, the 5-year PFS in the EBV DNA ≥ 1,500 copies/mL group was obviously different than the EBV DNA < 1,500 copies/mL group (62.2% versus 77.8%, p < 0.001). Multifactorial Cox regression analysis confirmed that in the PFS, the independent prognostic factors were including EBV DNA (hazard ratio [HR], 1.788; p=0.009), tumour stage (HR, 1.903; p=0.021), and node stage (HR, 1.498; p=0.049), but the SAA and CRP were not included in the independent prognostic factors.

Conclusion

The results of SAA and CRP had a certain relationship with the prognosis of NPC, and the prognosis of patients with high level of SAA and CRP were poor. However, the predictive ability of SAA and CRP was lower than that of EBV DNA.

Introduction

Nasopharyngeal carcinoma (NPC) is endemic in Southern China and Southeast Asia, which with a peak incidence of 50 cases per 100,000 [1]. Radiotherapy is the primary treatment modality and concurrent chemoradiotherapy with or without adjuvant chemotherapy is currently considered as the standard treatment regimen for locoregionally advanced NPC patients [2]. However, patients with similar histologic classification and stages have demonstrated remarkably different survival outcomes because of the heterogeneity of the protein expression profiles [3,4]. Various studies have attempted to discover molecular biomarkers to predict the behaviour of NPC, and numerous promising biomarkers have been evaluated as potential prognosis predictors of NPC. Among them, Epstein-Barr virus (EBV) DNA is current the best index to predict the prognosis of NPC and it is widely used in clinical application [5].
A previous study showed that chronic inflammation is a key contributor to cancer development and progression [6]. Serum amyloid A (SAA) and C-reactive protein (CRP) are both inflammatory factors and nonspecific, acute-phase, hepatic proteins secreted in response to cytokines [7]. At present, investigations have showed that SAA and CRP play important roles in the occurrence and development of tumours [8-10]. SAA is a high-density lipoprotein-associated apolipoprotein known to play a major role as a modulator of inflammation and in the metabolism and transport of cholesterol [6]. Of interest, SAA has been recently proposed as a potentially useful biomarker for gastric cancer [8] and has also been used to monitor the lymph node metastasis or relapse of nasopharyngeal cancer [9,11]. Moreover, when using mass spectrometry and proteomic technologies in lung cancer patients, SAA was identified as the top differentially expressed protein that can differentiate the serum of patients from the serum of healthy individuals [10]. Unfortunately, only scant information regarding SAA expression in malignant human tissues has been reported thus far and, to our knowledge, no study has yet addressed SAA as a prospective biomarker of NPC. Another acute-phase serum protein, CRP, studies have shown that the high level of CRP is associated with the poor prognosis of some tumors, including breast cancer [12], and it has already been reported as a prognostic marker in NPC [13,14].
It is very necessary to use a prospective approach to verify the previous reports about SAA and CRP in the predictive function of prognosis in NPC, and compare the effect of EBV DNA. This study represents the first investigation examining pretreatment SAA and CRP and the prognosis of NPC, and compared the value EBV DNA in a large prospective cohort study. These results will provide important information for personalized therapy.

Materials and Methods

1. Patients and methods

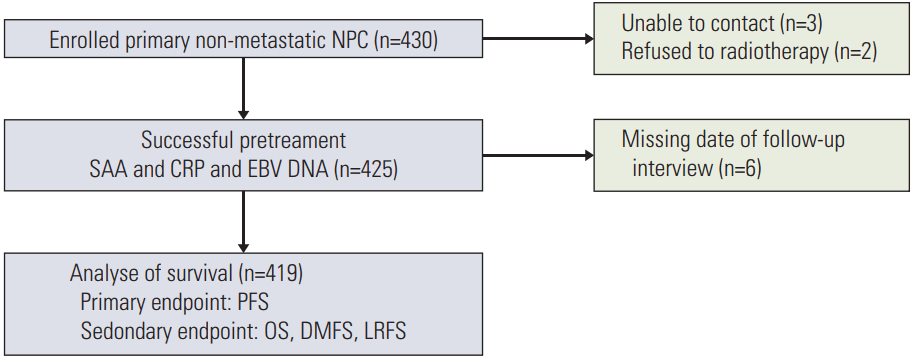
This is a prospective cohort study. Four hundred thirty primary NPC patients were consecutively recruited from April 2007 to November 2012 at the study institute. The patients were evaluated using the seventh American Joint Committee on Cancer staging system and were eligible for this study if they fulfilled all of the following criteria: they had biopsy-diagnosed World Health Organization types II-III NPC, they were aged between 18 and 80 years, and they had a satisfactory performance status (a score of 0-2 using the Eastern Cooperative Oncology Group System). The exclusion criteria included previous treatment for NPC, presence of distant metastasis, or prior malignancy (except carcinoma in situ of the cervix or basal/squamous cell carcinoma of the skin). Firstly, there were 430 NPC patients enrolled. Subsequently, three patients lost contact, and two patients refused to radiotherapy. There were 425 patients completed SAA, CRP, and EBV DNA measurements. Then, six patients were missing to follow up after radiotherapy. Finally, 419 non-metastatic primary patients were eligible for survival analysis (Fig. 1).
All of the patients were evaluated by complete physical examination, nasopharyngoscopy, head and neck magnetic resonance imaging (MRI), abdominal sonography, electrocardiography, chest radiography, bone scan, complete blood count with a differential count, biochemical profile, and prior treatment SAA, CRP, and EBV DNA levels. 18F-fluorodeoxyglucose positron emission tomography and computed tomography (PET-CT) was optional and was performed at the discretion of the attending physician. Before treatment, baseline clinical information was collected regarding sex, age, hereditary NPC, smoking status, TNM stage, and Eastern Cooperative Oncology Group (ECOG). Previous studies have indicated that some factors promoted increased plasma SAA and CRP levels, such as cardiovascular disease, diabetes, and chronic hepatitis B virus (HBV) infection. The definitions of these comorbidities and smoking status are presented in Supplementary Materials.
For these 419 patients, age 18-80 years (median age, 46 years), and 313 (74.7%) for male and 106 (25.3%) for female. The distribution of stage was as following: 10 (2.4%) for stage I, 38 (9.1%) for stage II, 235 (56.1%) for stage III, 91(21.7%) for stage IVa, and 45 (10.7%) for stage IVb. There were 126 (30.1%) were treated with conventional two-dimensional radiotherapy or three-dimensional conformal radiotherapy, and 293 (69.9%) were treated with intensity-modulated radiotherapy. Additionally, 369 (88.1%) of these patients with stage II-IV disease received platinum-based chemotherapy. Concurrent chemoradiotherapy with or without neoadjuvant or adjuvant chemotherapy was administered for advanced-stage disease (stages III and IV). A stratified multitherapeutic protocol was used: radiation alone for stage I disease and radiation alone or concurrent platinum-based chemotherapy for stage II disease; concurrent chemoradiotherapy with or without neoadjuvant or adjuvant chemotherapy for advanced-stage disease (stages III and IV). Neoadjuvant or adjuvant chemotherapy consisted of cisplatin with 5-fluorouracil or taxane administered every 3 weeks for two or three cycles. Concurrent chemotherapy consisted of cisplatin given on weeks 1, 4, and 7 of radiotherapy or weekly cisplatin. All of the patients were treated according to the same principles of the treatment for NPC patients at the study institute.

2. Plasma SAA, CRP, and EBV DNA evaluations

Each blood sample was allowed to clot and was centrifuged at 1,500 ×g for 10 minutes. Sera were collected, aliquoted, and kept frozen at ‒70°C until analysis. This molecular study was approved by the Ethics Committee of the study institute. The SAA levels were measured in serum samples using commercial enzyme-linked immunosorbent assay (ELISA) kits from Invitrogen (Camarillo, CA) according to the manufacturer’s instructions. All of the ELISAs were performed in duplicate. The results were obtained by a standard curve prepared according to the manufacturer’s instructions and with a coefficient of variation < 10%. The plasma CRP concentrations were immunoturbidimetrically quantified using a Roche automated clinical chemistry analyzer (Roche Diagnostics, Belleville, NJ). As described in previous study [15], patient plasma EBV DNA concentrations were routinely measured by quantitative polymerase chain reaction before treatment.

3. Clinical outcome assessment and patient follow-up

Our primary endpoint was progress-free survival (PFS), and the secondary endpoints were overall survival (OS), distant metastasis-free survival (DMFS), and local-regional recurrence-free survival (LRFS). The definitions of these endpoints are presented in the Supplementary Materials. After treatment was completed, patients were evaluated at 3-month intervals for the first 3 years and every 6 months thereafter or until death. The patient history was obtained and a physical examination and nasopharyngoscopy were performed at each follow-up visit. MRI of the head and neck, chest radiography, abdominal sonography, or PET-CT was routinely performed optionally or upon clinical indication of tumor relapse or metastasis.

4. Statistical analysis

Categorical variables were assessed using a chi-square test. The patients were divided into two groups according to the median level of SAA and CRP. The actuarial survival rates were estimated by the Kaplan-Meier method and survival curves were compared using the log-rank test. Multivariate analyses were performed using the Cox proportional hazards model. The covariates included tumour stage, Node stage, sex, SAA, CRP, EBV DNA, age, HBV infection, cardiac disease, diabetes mellitus, family history of NPC, and smoking. All of the reported probability values were two-tailed, with p < 0.05 considered to be significant. Statistical analyses were performed using SPSS ver. 20.0 (IBM Corp., Armonk, NY).

5. Ethical statement

All patients provided written informed consent. The study was approved by Sun Yat-Sen University’s independent ethics committees.

Results

1. Clinical outcomes

All of the 419 patients had a follow-up examination from their first visit (median, 56.7 months). During the follow-up period, 83 (19.8%) patients developed distant metastasis, 38 patients (9.07%) developed local-regional recurrence, and four patients (0.95%) developed both distant metastasis and local-regional recurrence. These patients almost received palliative chemotherapy or radiotherapy. A total of 36 patients (8.5%) with recurrent or metastasis disease died during our follow-up. Another five patients died without recurrent disease—two patients died of a heart attack, and three patients died of radiotherapy complication. The PFS, OS, DMFS, and LRFS for all 419 patients were 69.2%, 84.4%, 78.5%, and 89.6%, respectively.

2. Relationship between the SAA or CRP levels and the clinical characteristics of NPC

The median concentration of SAA in the 419 NPC patients was 4.28 mg/L (range, 0.90 to 743.00 mg/L). The median concentration of CRP in the 419 NPC patients was 1.88 mg/L (range, 0.11 to 126.56 mg/L). With this cut-off point of the median concentration, these patients were divided into two groups: the high SAA level group (SAA > 4.28 mg/L) and the low SAA level group (SAA ≤ 4.28 mg/L); the high CRP level group (CRP > 1.88 mg/L) and the low CRP level group (CRP ≤ 1.88 mg/L).
The chi-squared test results showed that our data was relatively balanced. In the results of SAA, regarding age, pathologic classification, ECOG performance, tumour classification, treatment, radiotherapy, smoking, chronic HBV infection, cardiac disease, diabetes mellitus, family history of NPC, local recurrence and posttreatment distant metastasis, the SAA level was not significantly different (p > 0.05). However, high level of SAA is associated with risk stratification and poor prognosis of NPC, and the SAA level was significantly associated with node metastasis (p < 0.001), clinical staging (p=0.018), EBV DNA (p=0.001), and death (p=0.012). In the results of CRP, similar to those of SAA, CRP was not related to the patient's general condition and inflammatory factors. At the same time, the CRP level was significantly associated with stage and prognosis, including tumour stage (p=0.001), node classification (p=0.002), clinical staging (p=0.001), EBV DNA (p=0.012), and distant metastasis (p=0.009) (Table 1).

3. Survival analysis divided by SAA, CRP, integrating SAA & CRP, and EBV DNA

According to high or low level of SAA, or CRP, or integrating SAA & CRP, or EBV DNA, we divided all 419 patients to two groups and analysis their different survival prognosis. The split point of SAA (4.28 mg/L) and CRP (1.88 mg/L) were applied the median concentration as before, and the split point of EBV DNA was applied in 1,500 copies/mL approved to be an accurate prognostic value in previous study [5]. The results showed that the high level of EBV DNA had worse prognosis than high level of SAA, CRP, integrating SAA & CRP in the 5-year PFS, OS, DMFS, and LRFS.
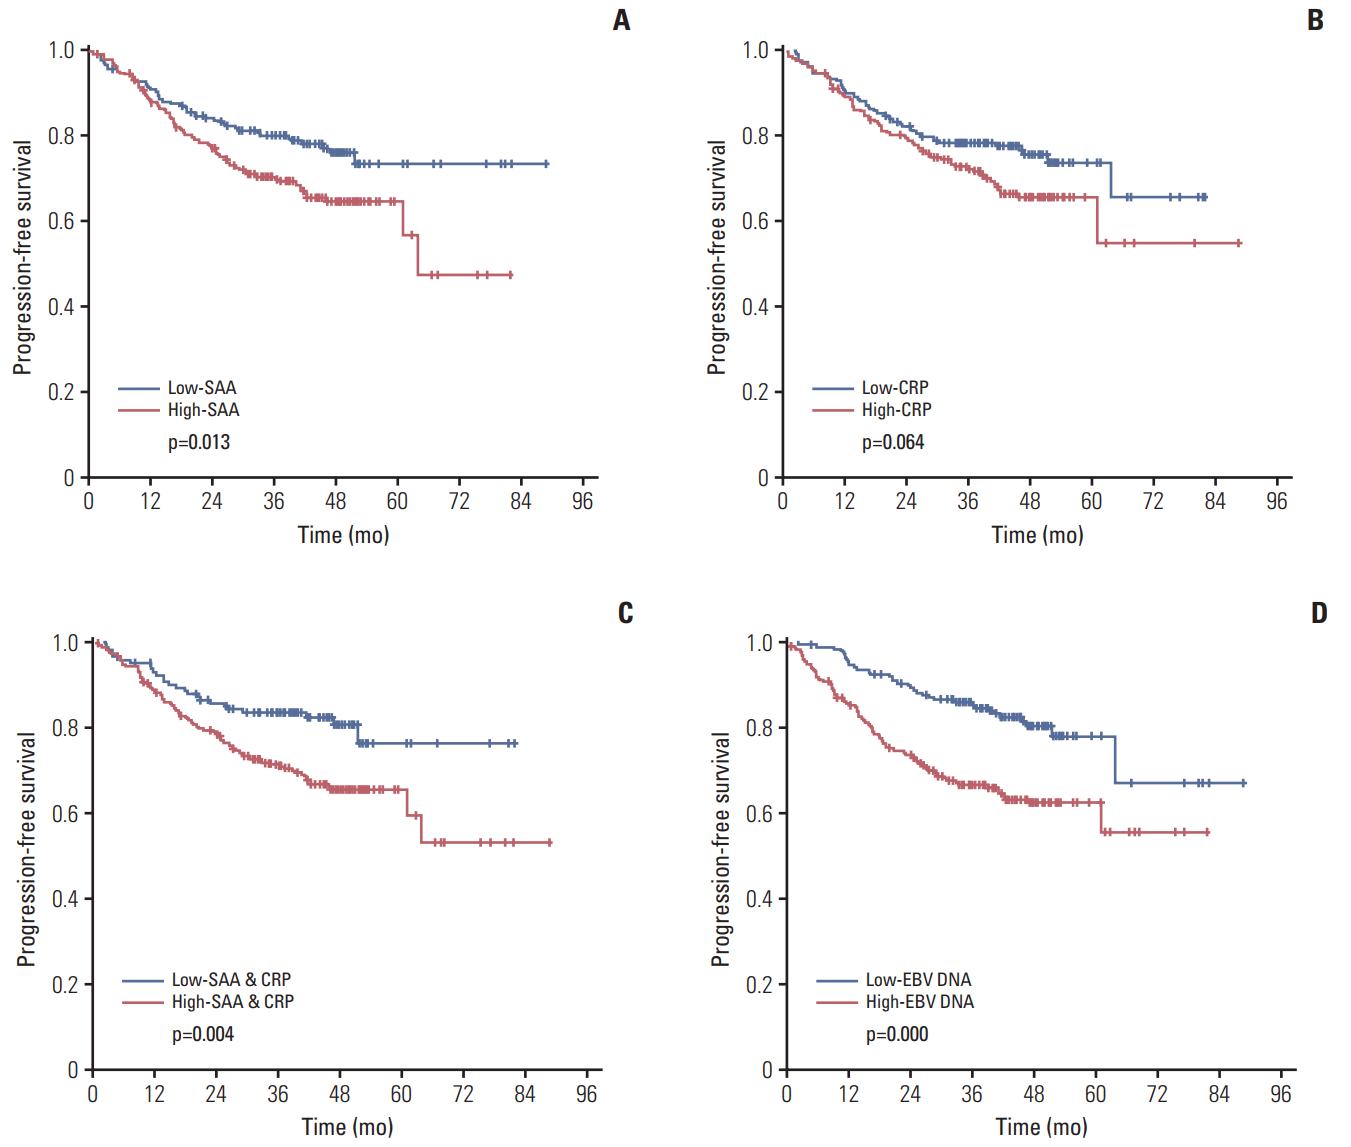
Regarding the 5-year PFS rate, the high and low SAA groups showed rate of 64.5% and 73.1%, respectively (p=0.013) (Fig. 2A); the high and low CRP groups showed rate of 65.2% and 73.3%, respectively (p=0.064) (Fig. 2B); the integrating SAA & CRP (high group, SAA > 4.28 mg/L or CRP > 1.88 mg/L; low group, SAA ≤ 4.28 mg/L and CRP ≤ 1.88 mg/L) showed rate of 65.2% and 75.9%, respectively (p=0.004) (Fig. 2C); the high EBV DNA (≥ 1,500 copies/mL) and low EBV DNA (< 1,500 copies/mL) group showed rate of 62.2% and 77.8%, respectively (p < 0.001) (Fig. 2D). All the results above showed that the 5-year PFS of patients with high level of EBV DNA were significantly lower than those with high levels of SAA, or CRP, or integrating SAA & CRP and EBV DNA had a more favorable prognostic value in NPC patients (Table 2, Fig. 2).
Similar to 5-year PFS, the other survival analysis, including 5-year OS, DMFS, and LRFS, we concluded the following results: EBV DNA has a more sensitive predictive p-value than SAA, CRP, and integrating SAA & CRP. The p-value in 5-year OS divided by SAA, CRP, integrating SAA & CRP, and EBV DNA were p=0.025, p=0.060, p=0.037, and p=0.015, respectively. The p-value in 5-year DMFS divided by SAA, CRP, integrating SAA & CRP, and EBV DNA were p=0.069, p=0.009, p=0.016, and p=0.000, respectively. The p-value in 5-year LRFS divided by SAA, CRP, integrating SAA & CRP, and EBV DNA were p=0.080, p=0.826, p=0.091, and p=0.035, respectively. Integrating SAA & CRP could improve the predictive ability of survival prognosis value to some extent, especially in the 5-year PFS (Table 2).

4. Univariate analysis and multifactorial Cox risk model analysis

The variable in univariate analysis was age (> 46 years vs. ≤ 46 years), sex (male vs. female), smoking (yes vs. no), chronic HBV infection (yes vs. no), diabetes mellitus (yes vs. no), cardiac disease (yes vs. no), family history of NPC (yes vs. no), tumour stage (T1+T2 vs. T3+T4), node stage (N0+N1 vs. N2+N3), SAA level (> 4.28 mg/L vs. ≤ 4.28 mg/L), CRP level (> 1.88 mg/L vs. ≤ 1.88 mg/L), and EBV-DNA (≥ 1,500 copies/mL vs. < 1,500 copies/mL), respectively. In univariate analysis, the significant factors included in the PFS: tumour stage (hazard ratio [HR], 2.048; 95% confidence interval [CI], 1.190 to 3.523; p=0.010), node stage (HR, 1.864; 95% CI, 1.291 to 2.649; p=0.001), SAA (HR, 1.593; 95% CI, 1.100 to 2.305; p=0.014), and EBV DNA (HR, 2.260; 95% CI, 1.521 to 3.358; p=0.000). In univariate analysis, the significant factors included in the OS: node stage (HR, 3.438; 95% CI, 1.711 to 6.910; p=0.001), SAA (HR, 2.095; 95% CI, 1.083 to 4.050; p=0.028), and EBV DNA (HR, 2.308; 95% CI, 1.156 to 4.610; p=0.018) (Table 3).
The association analyses of variables above with PFS and OS were performed using multifactorial Cox regression analyses. The analyses demonstrated that the tumour stage (HR, 1.903; 95% CI, 1.100 to 3.290; p=0.021), node stage (HR, 1.498; 95% CI, 1.002 to 2.241; p=0.049), and EBV DNA (HR, 1.788; 95% CI, 1.157 to 2.764; p=0.009) were independent predictors of PFS. The node stage (HR, 3.438; 95% CI, 1.711 to 6.910; p=0.001) was independent predictors of OS in patients with NPC (Table 3). SAA was not an independent prognostic factor in multivariate analysis, although it was significant in univariate analysis.

Discussion

SAA and CRP are acute-phase proteins and have been demonstrated to be contributors to cancer development and progression. SAA and CRP are regulated by related cytokines, and the amplitude of the inflammation-related increase in SAA is similar to, or slightly greater than, that of CRP [16]. However, the physiologic level of circulating SAA is approximately 10-fold greater than that of CRP, suggesting that SAA may be more useful for detecting slight elevations in systemic or chronic inflammation [16,17]. Several previous and recent studies have proposed a direct correlation between the SAA concentrations and tumour grade [18,19]. Additionally, SAA has been reported to be a marker of disease progression in different malignancies, including renal cell carcinoma [20,21], lung [22,23], colorectal [24], uterine serous papillary cancer [25], and breast cancer [12]. Some research demonstrated that SAA was potential NPC metastasis-specific serum biomarkers [11] and SAA could be a useful biomarker to monitor relapse of NPC [9]. Regarding CRP, a retrospective study [14] showed that baseline CRP may be useful to predict the prognosis of metastatic NPC patients. Previous we have found that baseline plasma EBV DNA and CRP levels were significantly correlated with survival in NPC patients [13]. A study suggested that systemic inflammation, as measured by circulating CRP and SAA, may be an important long term prognostic factor for breast cancer and elevated SAA and CRP were associated with reduced OS [12]. However, a prospective study to validate this prognostic effect of SAA and CRP in NPC is still needed. Quantification of plasma EBV DNA is useful for monitoring patients with NPC and predicting the outcome of treatment [5]. Pretherapy circulating EBV DNA load is an independent prognostic factor to Union for International Cancer Control staging in NPC [26]. It is very necessary to use a prospective approach to verify the previous reports about SAA and CRP in the predictive function of prognosis in NPC, and compare the effect of EBV DNA.
The advantage of this study is its prospective design and analysis of pretreatment blood samples. In this study of 419 non-metastatic primary NPC patients, the chi-squared test results showed that the level of SAA and CRP were not related to the patient's general condition and inflammatory factors, but significantly associated with stage and prognosis, including tumour stage or Node classification or clinical staging or distant metastasis or death or the EBV DNA. We deserve further study that which factors predict prognosis is more important, the staging, the EBV DNA, or the inflammatory factors SAA and CRP.
In this study, we found significant associations of higher levels of SAA (64.5% vs. 73.1%, p=0.013) reduced 5-year PFS, but the result of CRP was close to be significant (65.2% vs. 73.3%, p=0.064). Additionally, we observed that the integrating SAA & CRP improved the ability to predict prognosis and high level of circulating SAA combined with CRP was significantly correlated with survival in NPC patients (65.2% vs. 75.9%, p=0.004), a finding that was similar to that in patients with other cancers, including breast cancer [12], melanoma [27] and colorectal cancer [24]. On the other hand, EBV DNA detection showed a superior predictive result, the 5-year PFS in the EBV DNA ≥ 1500 copies/mL group was obviously different than the EBV DNA < 1,500 copies/mL group (62.2% vs. 77.8%, p < 0.001). At the same time, in the 5-year OS (p=0.015), DMFS (p=0.000), LRFS (p=0.035), the high level of EBV DNA was also significant different than low level of EBV DNA. Although SAA was significant in univariate analysis, it was not an independent prognostic factor in multivariate analysis. Multifactorial Cox regression analysis confirmed that in the PFS, the independent prognostic factors were including EBV DNA (HR, 1.788; p=0.009), tumour stage (HR, 1.903; p=0.021) and node stage (HR, 1.498; p=0.049), but the SAA and CRP were not included in the independent prognostic factors. The above results showed that the EBV DNA, which is the best biomarker so far, was more sensitive to the prediction of NPC than the inflammatory factors SAA and CRP. High level of EBV DNA, SAA, and CRP were both poor prognostic factors for NPC patients, especially EBV DNA. For these patients, we can consider performing closer follow-ups and early intervention.
SAA and CRP are acute-phase proteins and have been demonstrated to be connected with the Inflammation related diseases [6,7], such as chronic HBV infection, diabetes mellitus and cardiac disease. In this study, the chi-square test results showed that the level of SAA and CRP were not related to these diseases. Also, the association analyses of chronic HBV infection, diabetes mellitus, and cardiac disease were not independent predictors of PFS and OS in NPC patients with multifactorial Cox regression analyses. Although SAA and CRP were associated with a self-reported history of myocardial infarction and history of heart failure in the HEAL study [28]. In our study, two patients died of a heart attack, which was a low-probability event here. Thus, our results suggested that survival prognosis of patients with NPC were not related to these pretreatment inflammatory diseases.
The drawback of our study is that the data were obtained exclusively from one centre. Although our cancer centre treats many NPC patients, these results also need to be validated in other data sets. The second limitation is that the single pretreatment measurement of SAA, CRP, and EBV DNA. A single measurement is likely to underestimate the magnitude of the association between the biomarkers and survival. One strength of our study is the reliable measurement of both the SAA and CRP levels with a high accuracy in a core laboratory. And the other is the large size examination should perform throughout the treatment period, including pretreatment, post-treatment, and follow-up periods.
In summary, this study suggests that pretreatment SAA and CRP had a certain relationship with the prognosis of NPC, and the prognosis of patients with high level of SAA and CRP were poor. However, the predictive ability of SAA and CRP was worse than that of EBV DNA. These results also need to be validated with further large collaborative studies.
In conclusion, there is a certain relationship between SAA and CRP with the prognosis of NPC, and the prognosis of patients with high level of SAA and CRP are poor. However, the predictive ability of SAA and CRP is worse than that of EBV DNA.

Electronic Supplementary Material

Supplementary materials are available at Cancer Research and Treatment website (http://www.e-crt.org).

Notes

Conflict of interest relevant to this article was not reported.

ACKNOWLEDGMENTS

We gratefully recognize the patients who participated in this study. This study was supported by grants from the National Key R&D Program of China (2016YFC0902000), National Natural Science Foundation of China (No. 81425018, No. 81072226, No. 81201629), the 863 Project (No. 2012AA02A501), the National Key Basic Research Program of China (No. 2013CB910304), the Special Support Plan of Guangdong Province (No. 2014TX01R145), the SCI-Tech Project Foundation of Guangdong Province (No. 2014A020212103, No. 2011B080701034, No. 2011B031800161), the Health & Medical Collaborative Innovation Project of Guangzhou City (No. 20140000-0001), the National Science & Technology Pillar Program during the Twelfth Five-year Plan Period (No. 2014BAI09B10), the PhD Start-up Fund of Natural Science Foundation of Guangdong Province, China (No. 2016A030310221), the cultivation foundation for the junior teachers in Sun Yat Sen University (No. 16ykpy28), the Sun Yatsen University Clinical Research 5010 Program, the Sun Yat-sen University Cancer Center Clinical Research 308 Program, the Fundamental Research Funds for the Central Universities, the Medical Research Foundation of Guangdong Province (No. A2014252), and Nurses Fund of the Sun Yat-sen Cancer Hospital (No. 201301).

References

1. Wee JT, Ha TC, Loong SL, Qian CN. Is nasopharyngeal cancer really a "Cantonese cancer"? Chin J Cancer. 2010; 29:517–26.
crossref
2. Blanchard P, Lee A, Marguet S, Leclercq J, Ng WT, Ma J, et al. Chemotherapy and radiotherapy in nasopharyngeal carcinoma: an update of the MAC-NPC meta-analysis. Lancet Oncol. 2015; 16:645–55.
crossref
3. Wei WI, Sham JS. Nasopharyngeal carcinoma. Lancet. 2005; 365:2041–54.
crossref
4. Ludwig JA, Weinstein JN. Biomarkers in cancer staging, prognosis and treatment selection. Nat Rev Cancer. 2005; 5:845–56.
crossref
5. Lin JC, Wang WY, Chen KY, Wei YH, Liang WM, Jan JS, et al. Quantification of plasma Epstein-Barr virus DNA in patients with advanced nasopharyngeal carcinoma. N Engl J Med. 2004; 350:2461–70.
crossref
6. Coussens LM, Werb Z. Inflammation and cancer. Nature. 2002; 420:860–7.
crossref
7. Schultz DR, Arnold PI. Properties of four acute phase proteins: C-reactive protein, serum amyloid A protein, alpha 1-acid glycoprotein, and fibrinogen. Semin Arthritis Rheum. 1990; 20:129–47.
8. Chan DC, Chen CJ, Chu HC, Chang WK, Yu JC, Chen YJ, et al. Evaluation of serum amyloid A as a biomarker for gastric cancer. Ann Surg Oncol. 2007; 14:84–93.
crossref
9. Cho WC, Yip TT, Yip C, Yip V, Thulasiraman V, Ngan RK, et al. Identification of serum amyloid a protein as a potentially useful biomarker to monitor relapse of nasopharyngeal cancer by serum proteomic profiling. Clin Cancer Res. 2004; 10(1 Pt 1):43–52.
crossref
10. Howard BA, Wang MZ, Campa MJ, Corro C, Fitzgerald MC, Patz EF Jr. Identification and validation of a potential lung cancer serum biomarker detected by matrix-assisted laser desorption/ ionization-time of flight spectra analysis. Proteomics. 2003; 3:1720–4.
11. Liao Q, Zhao L, Chen X, Deng Y, Ding Y. Serum proteome analysis for profiling protein markers associated with carcinogenesis and lymph node metastasis in nasopharyngeal carcinoma. Clin Exp Metastasis. 2008; 25:465–76.
crossref
12. Pierce BL, Ballard-Barbash R, Bernstein L, Baumgartner RN, Neuhouser ML, Wener MH, et al. Elevated biomarkers of inflammation are associated with reduced survival among breast cancer patients. J Clin Oncol. 2009; 27:3437–44.
crossref
13. Tang LQ, Li CF, Chen QY, Zhang L, Lai XP, He Y, et al. High-sensitivity C-reactive protein complements plasma EpsteinBarr virus deoxyribonucleic acid prognostication in nasopharyngeal carcinoma: a large-scale retrospective and prospective cohort study. J Clin Oncol. 2009; 27:3437–44.
crossref
14. Xia WX, Ye YF, Lu X, Wang L, Ke LR, Zhang HB, et al. The impact of baseline serum C-reactive protein and C-reactive protein kinetics on the prognosis of metastatic nasopharyngeal carcinoma patients treated with palliative chemotherapy. PLoS One. 2013; 8:e76958.
crossref
15. An X, Wang FH, Ding PR, Deng L, Jiang WQ, Zhang L, et al. Plasma Epstein-Barr virus DNA level strongly predicts survival in metastatic/recurrent nasopharyngeal carcinoma treated with palliative chemotherapy. Cancer. 2011; 117:3750–7.
crossref
16. Yamada T. Serum amyloid A (SAA): a concise review of biology, assay methods and clinical usefulness. Clin Chem Lab Med. 1999; 37:381–8.
crossref
17. Malle E, De Beer FC. Human serum amyloid A (SAA) protein: a prominent acute-phase reactant for clinical practice. Eur J Clin Invest. 1996; 26:427–35.
crossref
18. Biran H, Friedman N, Neumann L, Pras M, Shainkin-Kestenbaum R. Serum amyloid A (SAA) variations in patients with cancer: correlation with disease activity, stage, primary site, and prognosis. J Clin Pathol. 1986; 39:794–7.
crossref
19. Liu DH, Wang XM, Zhang LJ, Dai SW, Liu LY, Liu JF, et al. Serum amyloid A protein: a potential biomarker correlated with clinical stage of lung cancer. Biomed Environ Sci. 2007; 20:33–40.
20. Wood SL, Rogers M, Cairns DA, Paul A, Thompson D, Vasudev NS, et al. Association of serum amyloid A protein and peptide fragments with prognosis in renal cancer. Br J Cancer. 2010; 103:101–11.
crossref
21. Vermaat JS, Gerritse FL, van der Veldt AA, Roessingh WM, Niers TM, Oosting SF, et al. Validation of serum amyloid alpha as an independent biomarker for progression-free and overall survival in metastatic renal cell cancer patients. Eur Urol. 2012; 62:685–95.
22. Cho WC, Yip TT, Cheng WW, Au JS. Serum amyloid A is elevated in the serum of lung cancer patients with poor prognosis. Br J Cancer. 2010; 102:1731–5.
crossref
23. Sung HJ, Ahn JM, Yoon YH, Rhim TY, Park CS, Park JY, et al. Identification and validation of SAA as a potential lung cancer biomarker and its involvement in metastatic pathogenesis of lung cancer. J Proteome Res. 2011; 10:1383–95.
crossref
24. Toriola AT, Cheng TY, Neuhouser ML, Wener MH, Zheng Y, Brown E, et al. Biomarkers of inflammation are associated with colorectal cancer risk in women but are not suitable as early detection markers. Int J Cancer. 2013; 132:2648–58.
crossref
25. Cocco E, Bellone S, El-Sahwi K, Cargnelutti M, Casagrande F, Buza N, et al. Serum amyloid A (SAA): a novel biomarker for uterine serous papillary cancer. Br J Cancer. 2009; 101:335–41.
crossref
26. Leung SF, Zee B, Ma BB, Hui EP, Mo F, Lai M, et al. Plasma Epstein-Barr viral deoxyribonucleic acid quantitation complements tumor-node-metastasis staging prognostication in nasopharyngeal carcinoma. J Clin Oncol. 2006; 24:5414–8.
crossref
27. Findeisen P, Zapatka M, Peccerella T, Matzk H, Neumaier M, Schadendorf D, et al. Serum amyloid A as a prognostic marker in melanoma identified by proteomic profiling. J Clin Oncol. 2009; 27:2199–208.
crossref
28. Pierce BL, Neuhouser ML, Wener MH, Bernstein L, Baumgartner RN, Ballard-Barbash R, et al. Correlates of circulating C-reactive protein and serum amyloid A concentrations in breast cancer survivors. Breast Cancer Res Treat. 2009; 114:155–67.
crossref

Fig. 1.
Cohort definition and exclusion. NPC, nasopharyngeal carcinoma; SAA, serum amyloid A; CRP, C-reactive protein; EBV, Epstein-Barr virus; PFS, progression-free survival; OS, overall survival; DMFS, distant metastasis-free survival; LRFS, locoregional relapse-free survival.
crt-2017-180f1.tif
Fig. 2.
Kaplan-Meier curves of progression-free survival according to different groups in 419 NPC patients. (A) Low-SAA (SAA ≤ 4.28 mg/L) and high-SAA (SAA > 4.28 mg/L) group. (B) Low-CRP (CRP ≤ 1.88 mg/L) and high-CRP (CRP > 1.88 mg/L) group. (C) Low-SAA & CRP (SAA ≤ 4.28 mg/L and CRP ≤ 1.88 mg/L) and high-SAA & CRP (SAA > 4.28 mg/L or CRP > 1.88 mg/L) group. (D) Low-EBV DNA (EBV DNA < 1,500 copies/mL) and high-EBV DNA (EBV DNA ≥ 1,500 copies/mL) group. NPC, nasopharyngeal carcinoma; SAA, serum amyloid A; CRP, C-reactive protein; EBV, Epstein-Barr virus.
crt-2017-180f2.tif
Table 1.
Relationship between SAA and CRP pretreatment and the clinical characteristics of the 419 NPC patients
Characteristic SAA (mg/L)
CRP (mg/L)
> 4.28 (n=208) ≤ 4.28 (n=211) p-value > 1.88 (n=209) ≤ 1.88 (n=210) p-value
Sex
 Male 166 147 0.017 47 59 0.187
 Female 42 64 162 151
Age (yr)
 ≤ 46 112 106 0.460 95 101 0.588
 > 46 96 105 114 109
WHO pathologic classification
 WHO II 5 9 0.290 9 5 0.273
 WHO III 203 202 200 205
ECOG
 0 7 8 0.350 5 10 0.089
 1 199 203 202 200
 2 2 0 2 0
Tumour stage
 T1-2 45 45 0.939 31 59 0.001
 T3-4 163 166 178 151
Node stage
 N0-1 96 134 < 0.001 99 131 0.002
 N2-3 112 77 110 79
Clinical stage
 Stage I 6 4 0.018 3 7 0.001
 Stage II 14 24 11 27
 Stage III 110 125 114 121
 Stage IVa 48 43 54 37
 Stage IVb 30 15 27 18
Treatment
 Radiotherapy 20 30 0.147 19 31 0.074
 Chemotherapy+radiotherapy 188 181 190 179
Radiotherapy
 2DRT/3DCRT 69 57 0.170 68 58 0.273
 IMRT 139 154 141 152
Smoking
 No 132 138 0.678 131 139 0.453
 Yes 76 73 78 71
Chronic HBV infection
 No 192 199 0.412 199 192 0.121
 Yes 16 12 10 18
Cardiac disease
 No 189 198 0.252 193 194 0.989
 Yes 19 13 16 16
Diabetes mellitus
 No 204 204 0.372 205 203 0.364
 Yes 4 7 4 7
Family history of NPC
 No 185 189 0.835 189 185 0.441
 Yes 23 22 20 25
EBV DNA (copy/mL)
 < 1,500 77 111 0.001 81 107 0.012
 ≥ 1,500 131 100 123 103
Local-regional relapse
 No 184 197 0.081 191 190 0.746
 Yes 24 14 18 20
Distant metastasis
 No 159 177 0.056 157 179 0.009
 Yes 49 34 52 31
Deaths
 No 180 198 0.012 184 194 0.135
 Yes 28 13 25 16

SAA, serum amyloid A; CRP, C-reactive protein; NPC, nasopharyngeal carcinoma; WHO, World Health Organization; ECOG, Eastern Cooperative Oncology Group; 2DRT, two-dimensional radiotherapy; 3DCRT, three-dimensional conformal radiotherapy; IMRT, intensity-modulated radiotherapy; HBV, hepatitis B virus; EBV, Epstein-Barr virus.

Table 2.
Five-year survival rate in the 419 NPC with high or low SAA, CRP, and EBV
Factor PFS
OS
DMFS
LRFS
Percentage p-value Percentage p-value Percentage p-value Percentage p-value
SAA (mg/L)
 > 4.28 64.5 0.013 79.5 0.025 75.0 0.069 87.8 0.080
 ≤ 4.28 73.1 91.0 82.0 90.5
CRP (mg/L)
 > 1.88 65.2 0.064 82.8 0.060 72.3 0.009 91.0 0.826
 ≤ 1.88 73.3 86.7 84.5 88.3
SAA and CRP (mg/L)
 SAA > 4.28 or CRP > 1.88 65.2 0.004 81.2 0.037 74.7 0.016 88.8 0.091
 SAA ≤ 4.28 and CRP ≤ 1.88 75.9 91.8 86.0 89.5
EBV DNA (copy/mL)
 ≥ 1,500 62.2 0.000 80.5 0.015 72.4 0.000 87.7 0.035
 < 1,500 77.8 90.0 85.8 91.8

NPC, nasopharyngeal carcinoma; SAA, serum amyloid A; CRP, C-reactive protein; EBV, Epstein-Barr virus; PFS, progression-free survival; OS, overall survival; DMFS, distant metastasis-free survival; LRFS, locoregional relapse-free survival.

Table 3.
Multivariate Cox proportional hazards analysis of 419 patients with NPC
Variable Univariate analysis
Multivariate analysis
HRa) 95% CI p-valuea) HRa) 95% CI p-valuea)
PFS
 Sex 1.504 0.946-2.392 0.085 - - -
 Age 0.874 0.608-1.256 0.468 - - -
 Smoking 1.429 0.991-2.062 0.056 - - -
 Chronic HBV infection 1.037 0.874-1.229 0.679 - - -
 Cardiac disease 0.971 0.473-1.991 0.935 - - -
 Diabetes mellitus 0.908 0.781-1.057 0.213 - - -
 Family history of NPC 1.142 0.653-1.998 0.641 - - -
 Tumour stage 2.048 1.190-3.523 0.010 1.903 1.100-3.290 0.021
 Node stage 1.864 1.291-2.694 0.001 1.498 1.002-2.241 0.049
 SAA 1.593 1.100-2.305 0.014 - - -
 CRP 1.414 0.979-2.038 0.065 - - -
 EBV DNA 2.260 1.521-3.358 0.000 1.788 1.157-2.764 0.009
OS
 Sex 1.310 0.604-2.841 0.495 - - -
 Age 1.055 0.570-1.954 0.864 - - -
 Smoking 1.172 0.625-2.197 0.620 - - -
 Chronic HBV infection 1.106 0.854-1.433 0.444 - - -
 Cardiac disease 2.163 0.841-5.568 0.110 - - -
 Diabetes mellitus 1.008 0.865-1.174 0.923 - - -
 Family history of NPC 1.123 0.439-2.870 0.809 - - -
 Tumour stage 1.328 0.608-2.901 0.476 - - -
 Node stage 3.438 1.711-6.910 0.001 3.438 1.711-6.910 0.001
 SAA 2.095 1.083-4.050 0.028 - - -
 CRP 1.818 0.967-3.420 0.064 - - -
 EBV DNA 2.308 1.156-4.610 0.018 - - -

NPC, nasopharyngeal carcinoma; HR, hazard ratio; CI, confidence interval; PFS, progression-free survival; HBV, hepatitis B virus; SAA, serum amyloid A; CRP, C-reactive protein; EBV, Epstein-Barr virus; OS, overall survival.

a) We calculated hazard ratios and p-values with an adjusted multivariate Cox proportional hazards regression model, including sex (male vs. female), age (> 46 years vs. ≤ 46 years), smoking (yes vs. no), chronic hepatitis B virus infection (yes vs. no), cardiac disease (yes vs. no), diabetes mellitus (yes vs. no), family history of nasopharyngeal carcinoma (yes vs. no), tumour stage (T1+T2 vs. T3+T4), node stage (N0+N1 vs. N2+N3), SAA level (> 4.28 mg/L vs. ≤ 4.28 mg/L), CRP level (> 1.88 mg/L vs. ≤ 1.88 mg/L), and EBV-DNA (≥ 1,500 copies/mL vs. < 1,500 copies/mL) as covariates. We selected variables with the forward stepwise approach. Only variables that were significantly associated with survival are presented.

TOOLS
Similar articles