Introduction
Materials and Methods
1. Study population
2. Statistical analysis
3. Ethical statement
Results
Table 1.
1. Overall survival
Table 3.
2. Progression-free survival
Table 4.
3. Nomograms
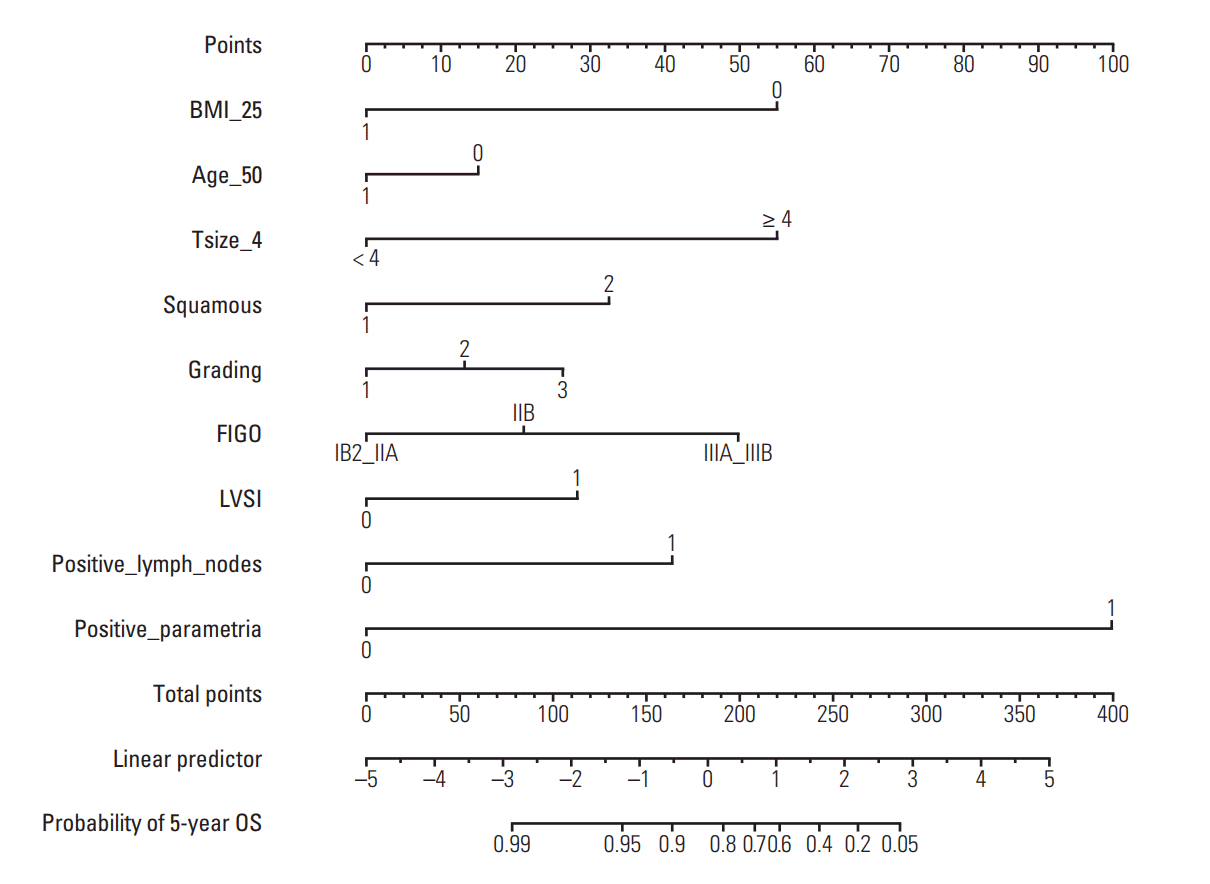
 | Fig. 3.Five-year overall survival nomogram. BMI_25 indicates body mass index ≥ 25 (1) or < 25 (0). Age_50 indicates age ≥ 50 (1) or < 50 (0) at diagnosis. Tsize_4 indicates clinical tumor size ≥ 4 (1) or < 4 (0). Squamous indicates squamous cell carcinoma (1) or other tumor histologies (2). LVSI indicates presence (1) or absence (0) of lymphovascular space invasion. Positive_lymph_nodes indicates pathological positive (1) or negative (0) locoregional lymph nodes. Positive_parametria indicates pathological positive (1) or negative (0) parametria. To use, find patient’s BMI on BMI_25 axis, then draw straight line upward to points axis to determine how many points patient receives for BMI. Do this again for other axes, each time drawing straight line upward toward points axis. Sum points received for each variable, and find sum on total points axis. Draw straight line down to survival-probability axis to find patient’s probability of 5-year OS. BMI, body mass index; FIGO, International Federation of Gynecology and Obstetrics; OS, overall survival. |
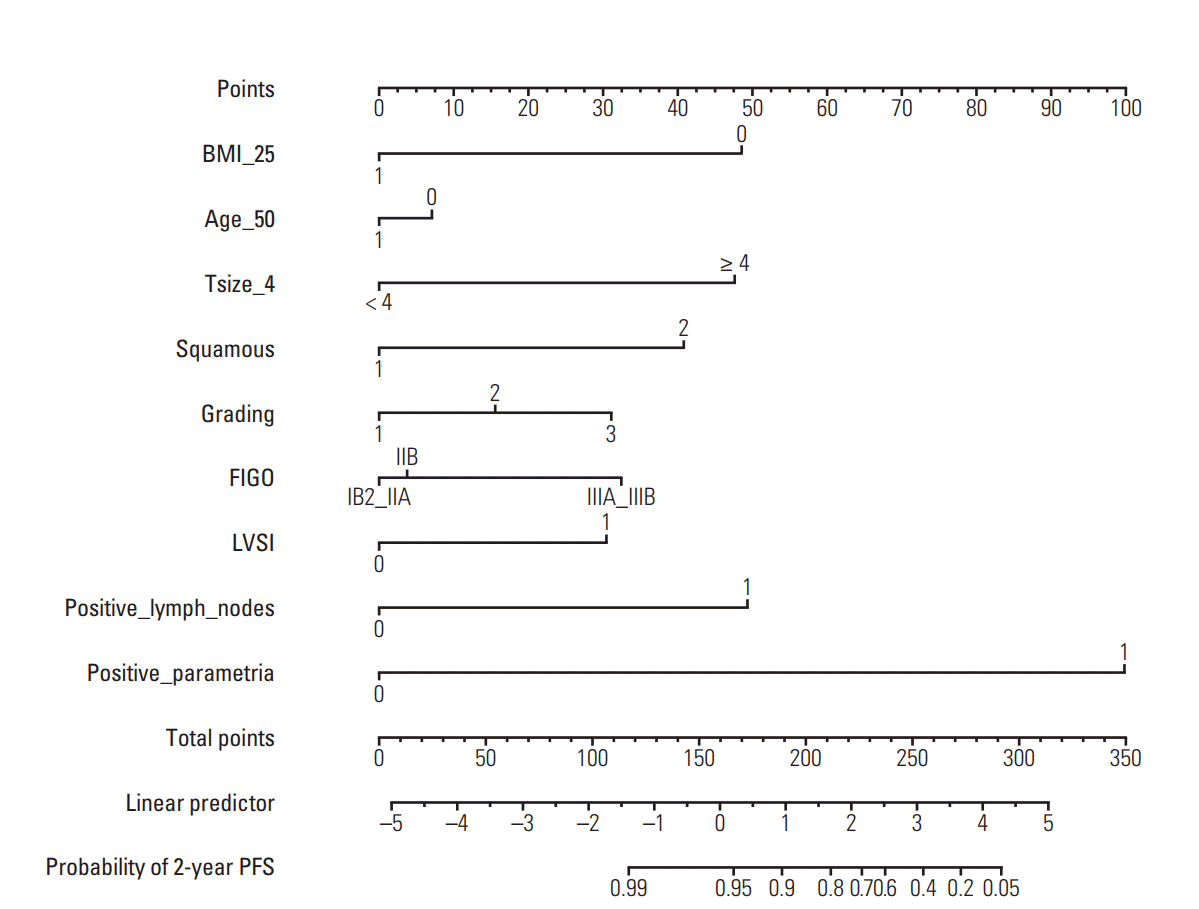
 | Fig. 4.Two-year progression-free survival nomogram. BMI_25 indicates body mass index ≥ 25 (1) or < 25 (0). Age_50 indicates age ≥ 50 (1) or < 50 (0) at diagnosis. Tsize_4 indicates clinical tumor size ≥ 4 (1) or < 4 (0). Squamous indicates squamous cell carcinoma (1) or other tumor histologies (2). LVSI indicates presence (1) or absence (0) of lymphovascular space invasion. Positive_lymph_nodes indicates pathological positive (1) or negative (0) locoregional lymph nodes. Positive_parametria indicates pathological positive (1) or negative (0) parametria. To use, find patient’s BMI on BMI_25 axis, then draw straight line upward to points axis to determine how many points patient receives for BMI. Do this again for other axes, each time drawing straight line upward toward points axis. Sum points received for each variable, and find sum on total points axis. Draw straight line down to survival-probability axis to find patient’s probability of 2-year PFS. BMI, body mass index; FIGO, International Federation of Gynecology and Obstetrics; PFS, progression-free survival. |


 PDF
PDF Citation
 Print
Print


 XML Download