Abstract
Purpose
We investigated B-cell lymphoma 2 (BCL2) regulation across DNA, RNA, protein, and methylation status according to molecular subtype of breast cancer using The Cancer Genome Atlas (TCGA) database.
Materials and Methods
We analyzed clinical and biological data on 1,096 breast cancers from the TCGA database. Biological data included reverse phase protein array (RPPA), mRNA sequencing (mRNA-seq), mRNA microarray, methylation, copy number alteration linear, copy number alteration nonlinear, and mutation data.
Results
The luminal A and luminal B subtypes showed upregulated expression of RPPA and mRNAseq and hypomethylation compared to the human epidermal growth factor receptor 2 (HER2) and triple-negative subtypes (all p < 0.001). No mutations were found in any subjects. High mRNA-seq and high RPPA were strongly associated with positive estrogen receptor, positive progesterone receptor (all p < 0.001), and negative HER2 (p < 0.001 and p=0.002, respectively). Correlation analysis revealed a strong positive correlation between protein and mRNA levels and a strong negative correlation between methylation and protein and mRNA levels (all p < 0.001). The high BCL2 group showed superior overall survival compared to the low BCL2 group (p=0.006).
Conclusion
The regulation of BCL2 was mainly associated with methylation across the molecular subtypes of breast cancer, and luminal A and luminal B subtypes showed upregulated expression of BCL2 protein, mRNA, and hypomethylation. Although copy number alteration may have played a minor role, mutation status was not related to BCL2 regulation. Upregulation of BCL2 was associated with superior prognosis than downregulation of BCL2.
B-cell lymphoma 2 (BCL2) is the founding member of the BCL2 family of regulator proteins that regulate cell death (apoptosis), either by inducing or inhibiting apoptotic cell death [1,2]. BCL2 is known to be a key anti-apoptotic protein. BCL2 is located at position 18q21.33 and it encodes the BCL2 protein, which is an integral outer mitochondrial membrane protein that blocks apoptotic death of some cells such as lymphocytes (https://www.ncbi.nlm.nih.gov/gene/596). Although BCL2 was initially identified as an oncogene in cases of human follicular B-cell lymphoma with a t(14;18) chromosome translocation [3,4], it has also been reported to be associated with a variety of neoplasms including leukemia, breast cancer, lung cancer, gastric cancer, colorectal cancer, pancreatic cancer, prostate cancer, bladder cancer, and melanoma, among others [5-10].
In breast cancer, BCL2 has been reported to be a favorable prognostic factor, especially in the luminal A subtype [11-15]. Although BCL2 is well known as an anti-apoptotic oncogene in lymphoma [16], it may be both oncogenic and tumor suppressive in specific cell types or under specific conditions. It has been postulated that BCL2 may play a favorable prognostic role in breast cancer as its tumor suppressive effect is more prominent than its oncogenic effect. Although an increasing number of papers based on clinicopathologic data have presented accumulating evidence that BCL2 plays is a favorable prognostic factor in breast cancer [11,12], the biological mechanisms related to BCL2 as a prognostic factor in breast cancer remain largely unknown. As most papers have reported the clinical significance of BCL2 in view of protein expression as assessed by immunohistochemistry (IHC), a large amount remains unknown in terms of mRNA, DNA, and epigenetics. Currently, the molecular subtypes of breast cancer as defined by the expression of hormone receptor (HR) and human epidermal growth factor receptor 2 (HER2) are widely accepted in clinical practice. Although several papers have reported the clinical significance of the BCL2 protein according to the molecular subtypes of breast cancer [14,15], the mechanisms of BCL2 regulation across DNA, RNA, protein, and epigenetics remain largely unknown.
The Cancer Genome Atlas (TCGA) Research Network has profiled and analyzed large numbers of human tumors, including breast cancers, to uncover molecular aberrations at the DNA, RNA, protein, and epigenetic levels [17]. Since TCGA Research Network published comprehensive molecular portraits of breast cancer including invasive ductal breast cancer and invasive lobular breast cancer [18,19], increasing number of papers have reported results on breast cancer using TCGA database [20,21].
In this study, we investigated molecular aberrations in BCL2 across DNA, RNA, protein, and methylation status according to the molecular subtypes of breast cancer using TCGA database. We tried to infer the relationship across clinical and biological parameters, which could be involved in BCL2 regulation, according to the molecular subtypes of breast cancer.
All TCGA data and information were acquired from TCGA homepage (https://cancergenome.nih.gov/), genomic data commons data portal (https://gdc-portal.nci.nih.gov/), Firebrowse (http://firebrowse.org/), and cBioPortal (http://www.cbioportal.org/). In particular, cBioPortal currently contains datasets from 150 cancer genomics studies including nine breast cancer studies. We downloaded a dataset on breast invasive carcinoma (TCGA, Provisional; access date, Feb 12, 2017) for this study. This dataset includes clinical data on 1,096 breast cancer patients and biological data on reverse phase protein array (RPPA), mRNA sequencing (mRNA-seq), mRNA microarray, methylation, copy number alteration (CNA) linear, CNA nonlinear, and mutation status. According to TCGA publication guidelines (http://cancergenome.nih.gov/publications/publicationguidelines), the data are unrestricted and not limited in terms of usage for publication, and no specific permission is needed for investigators to publish using these data.
We defined patient age as the age at the time of the diagnosis of primary breast cancer and the TNM staging was described according to the 6th edition of the American Joint Committee on Cancer. We defined HR status as positive when the IHC tests for either the estrogen receptor or the progesterone receptor were positive and as negative when both tests were negative. We defined HER2 as negative when the IHC results were negative or 1+ and as positive when the results were 3+; when the results were 2+, we defined the positivity of HER2 according to the results of fluorescence in situ hybridization analysis. We classified the molecular subtypes into one of four categories: luminal A (HR positive and HER2 negative), luminal B (HR positive and HER2 positive), HER2 (HR negative and HER2 positive), and triple negative (TN) (HR negative and HER2 negative) based on HR and HER2 expression.
RPPA data represent protein expression measured with the RPPA method and data are provided as log2 values of raw data. For mRNA expression, two data sets were analyzed: mRNA-seq data as median values of raw data by Illumina RNA sequencing (San Diego, CA) ver. 2 RSEM, and mRNA microarray data as median values of raw data by Agilent microarray analysis (Palo Alto, CA). Methylation data are provided as beta values of raw data and the probe most strongly anti-correlated with expression was measured for genes with multiple methylation probes. For this study, only human methylation 450 data were used, as human methylation 27 data do not contain information on BCL2. CNA linear data represent copy number variation according to Affymetrix SNP6 and data are provided as relative linear values for each gene. CNA nonlinear data represent copy number variation by GISTIC 2.0 values of ‒2, ‒1, 0, 1, and 2 represent homozygous deletion, hemizygous deletion, neutral or no change, gain, and high level amplification, respectively. Mutation data were generated by whole exome sequencing and data are provided in a mutation annotation format. Sample numbers and types according to biologic data were described in S1 Table. The expression level of each biological parameter was classified into high expression or low expression by the mean value of each biological parameter.
We used the two-sample t test to determine the difference in the expression levels of the biological parameters and Pearson’s chi-square test to determine the differences in clinicopathologic characteristics between groups. For multiple comparisons, Bonferroni correction was applied. We used the Pearson correlation coefficient to evaluate bivariate correlation among the biological parameters. All survival analyses were carried out with respect to overall survival, and the time durations was defined as the time from initial diagnosis to death from any cause. We used Kaplan-Meier estimation to analyze survival rates and the log-rank test to determine the significance of the differences between two survival curves. A Cox-proportional hazards model was used for the univariate and multivariate analyses, and hazard ratio was calculated using a 95% confidence interval (CI). We conducted all statistical analyses using IBM SPSS Statistics ver. 20.0 (IBM Inc., Armonk, NY) and R software ver. 3.3.2 (R Foundation for Statistical Computing, Vienna, Austria). All tests were two-sided, and we took a p-value of less than 0.05 to indicate statistical significance.
The total number of subjects was 1,096, and their mean age was 58.5±13.2 years (median, 58 years; range, 26 to 90 years). Regarding race, 756 white Americans (69.0%), 183 African Americans (16.7%), and 61 Asian Americans (5.6%) were included in the study. Regarding histologic type, 784 invasive ductal carcinomas (71.5%), 202 invasive lobular carcinomas (18.4%), 17 mucinous carcinomas (1.6%), nine metaplastic carcinomas (0.8%), and six medullary carcinomas (0.5%) were included in the dataset. Regarding operation type, 247 lumpectomies (22.5%), 321 modified radical mastectomies (29.3%), and 200 simple mastectomies (18.2%) were performed. The mean follow-up period was 40.9±39.1 months (median, 28 months; range, 0 to 283 months) and the total number of deaths during the period in question was 152 (13.9%). The clinicopathologic characteristics of the study subjects are summarized in Table 1.
The number of patients classified into each subtype was 599 (54.7%), 154 (14.1%), 39 (3.6%), and 160 (14.6%) for luminal A, luminal B, HER2, and TN, respectively. The distribution of T, N, M, stage, sex, and menopausal status according to molecular subtype are given in Table 2. Notably, male patients accounted for five luminal A subtypes (0.8%), six luminal B subtypes (3.9%), and one unknown subtype (0.7%). None of the male patients were classified into the HER2 or TN subtypes. Although there was a tendency for the proportion of patients to increase as the N stage or stage advanced amongst those with the HER2 subtype, no other significant associations were observed between molecular subtype and clinicopathologic features.
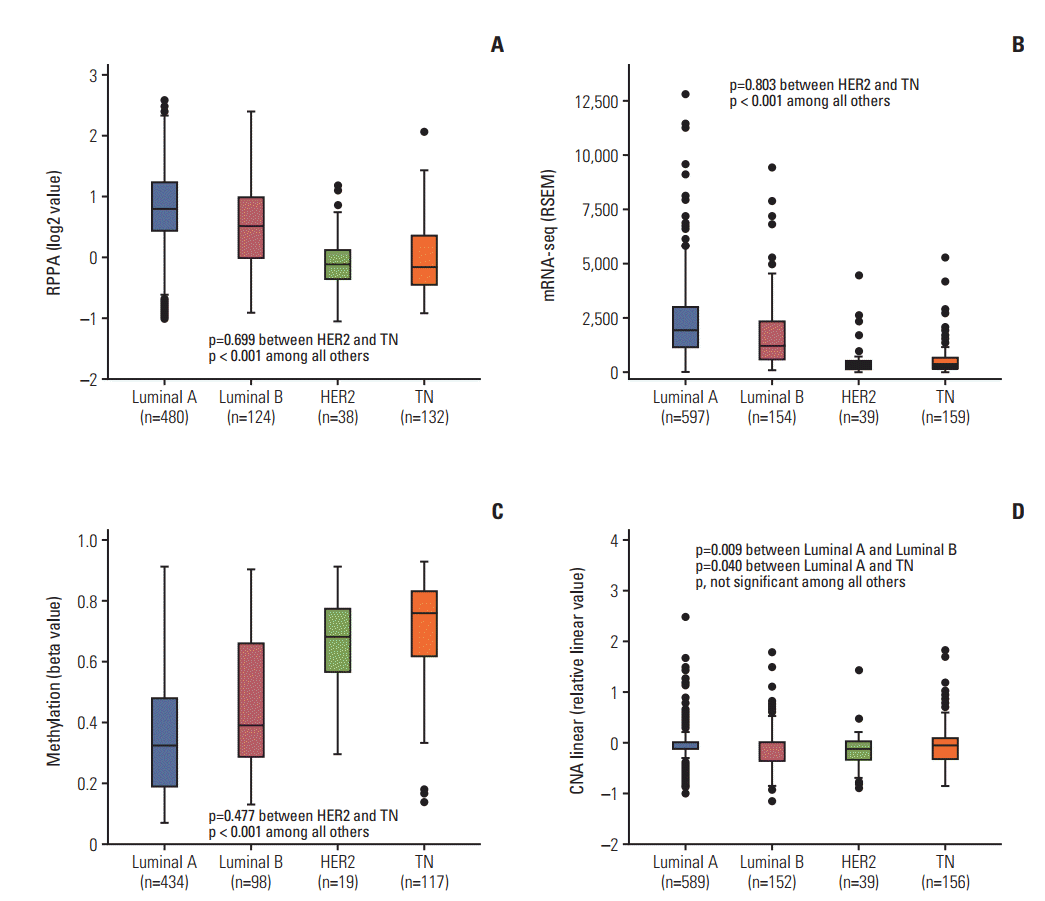
Fig. 1 depicts the expression patterns of RPPA, mRNA-seq, methylation, and CNA linear according to molecular subtype of breast cancer. The luminal A and luminal B subtypes showed upregulated expression of RPPA and mRNA-seq and hypomethylation compared to the HER2 and TN subtypes (all p < 0.001). The luminal A subtype showed a greater degree of upregulation of RPPA and mRNA-seq and a greater degree of hypomethylation than did the luminal B subtype (all p < 0.001). No differences were observed between the HER2 and TN subtypes regarding the expression of RPPA, mRNA-seq, or methylation. Regarding CNA linear, the luminal A subtype showed a higher mean value than did the luminal B subtype (p=0.009) or the TN subtype (p=0.040) by t test, but it lost statistical significance by multiple comparison (S2 Table). The expression of mRNA microarray and CNA nonlinear showed similar patterns to those of mRNA-seq and CNA linear (S3 Fig.). No BCL2 mutation was found in any of the subjects.
The number of patients in the low mRNA-seq group and the high mRNA-seq group was 660 (60.4%) and 432 (39.6%), respectively, and the number in the low RPPA group and the high RPPA group was 420 (47.4%) and 466 (52.6%), respectively (Table 1). Although more advanced T stage was associated with low mRNA-seq (78.9% and 67.1% for T2-4 in low mRNA-seq and high mRNA-seq, respectively; p=0.001) and low RPPA (81.9% and 73.0% for T2-4 in low RPPA and high RPPA, respectively; p=0.015), M stage, sex, and meno-pausal status were not associated with the expression of mRNA-seq or RPPA. Although more advanced N stage and stage were associated with low mRNA-seq (51.5% and 50.5% for N1-3 in low mRNA-seq and high mRNA-seq, respectively; p=0.007 and 85.5% and 76.6% for stage 2-4 in low mRNA-seq and high mRNA-seq, respectively; p=0.001), they were not associated with the expression of RPPA. Notably, the expression of mRNA-seq and high RPPA were strongly associated with estrogen receptor (ER) and progesterone receptor (PR) such that high mRNA-seq and high RPPA were strongly associated with positive ER and positive PR (63.0% and 90.0% for positive ER in low mRNA-seq and high mRNA-seq, respectively; 52.9% and 80.6% for positive PR in low mRNA-seq and high mRNA-seq, respectively; 55.0% and 87.3% for positive ER in low RPPA and high RPPA, respectively; 43.1% and 77.3% for positive PR in low RPPA and high RPPA, respectively; all p < 0.001). High mRNA-seq and high RPPA were also associated with negative HER2 (66.5% and 73.8% for negative HER2 in low mRNA-seq and high mRNA-seq, respectively; p < 0.001 and 64.8% and 73.6% for negative HER2 in low RPPA and high RPPA, respectively; p=0.002).
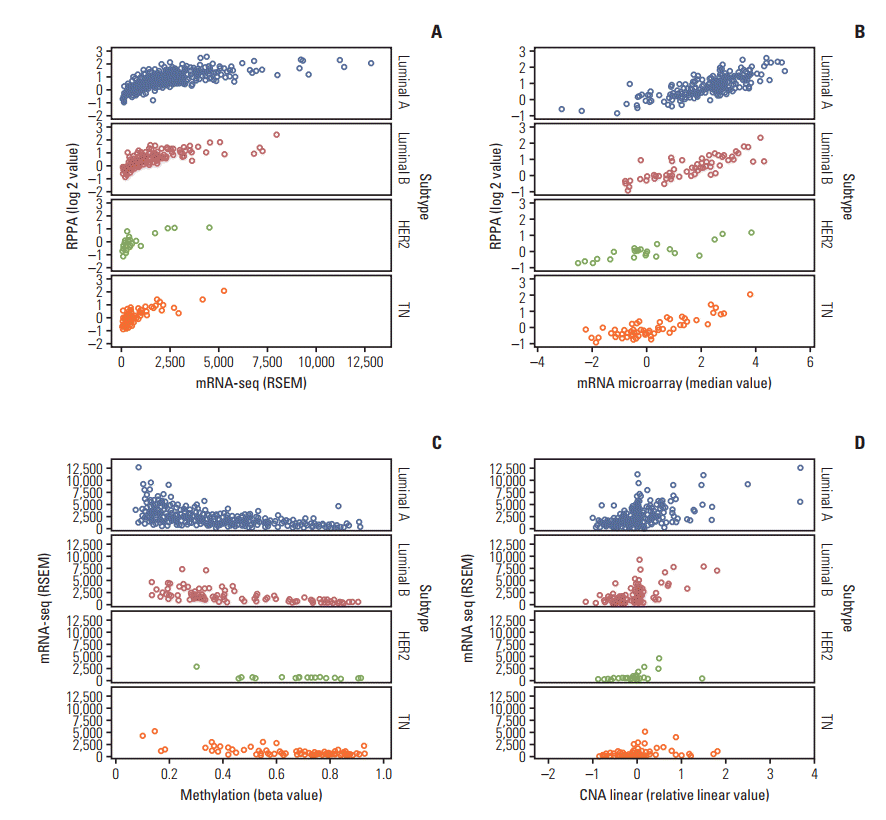
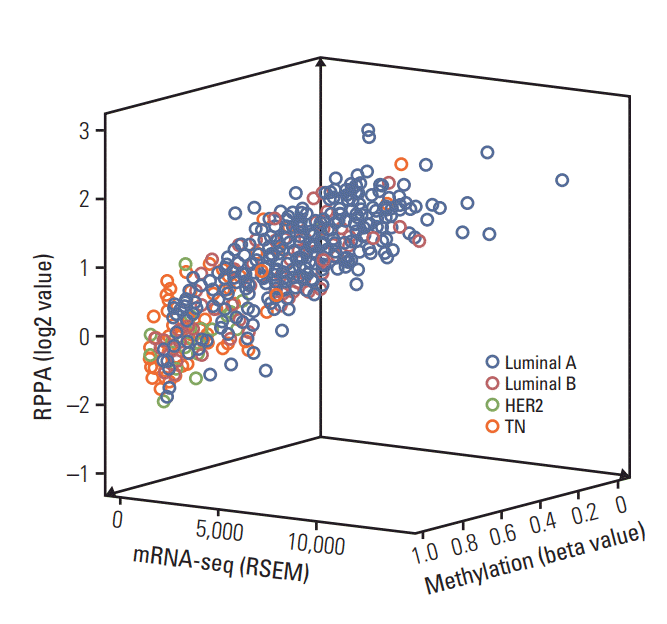
Fig. 2 shows scatter plots created using data on RPPA, mRNA-seq, mRNA microarray, methylation, and CNA linear according to molecular subtype of breast cancer. Positive correlations were observed between RPPA and mRNA-seq, between RPPA and mRNA microarray, and between mRNAseq and CNA linear. A negative correlation was observed between mRNA-seq and methylation. S4 Fig. depicts scatter plots for all of the biological parameters and Fig. 3 shows a 3-dimensional scatter plot of RPPA, mRNA-seq, and methylation. A strong correlation was found among RPPA, mRNAseq, methylation, and CNA linear in non-selected breast cancer patients (all p < 0.001) (Table 3). The luminal A and luminal B subtypes showed a strong correlation among all of the biological parameters (all p < 0.001) except for a correlation between methylation and CNA linear (p=0.008) in the luminal B subtype. The HER2 subtype showed strong correlations among most of the biological parameters, but weak correlations were observed between RPPA and methylation (p=0.034), RPPA and CNA linear (p=0.002), mRNA-seq and methylation (p=0.009), mRNA-seq and CNA linear (p=0.016), and methylation and CNA linear (p=0.015). The TN subtype showed significant correlations among all of the biological parameters except for the correlation between methylation and CNA linear, and a weak correlation was observed between RPPA and CNA linear (p=0.001). S5 Table shows the results of correlation analysis among all of the biological parameters.
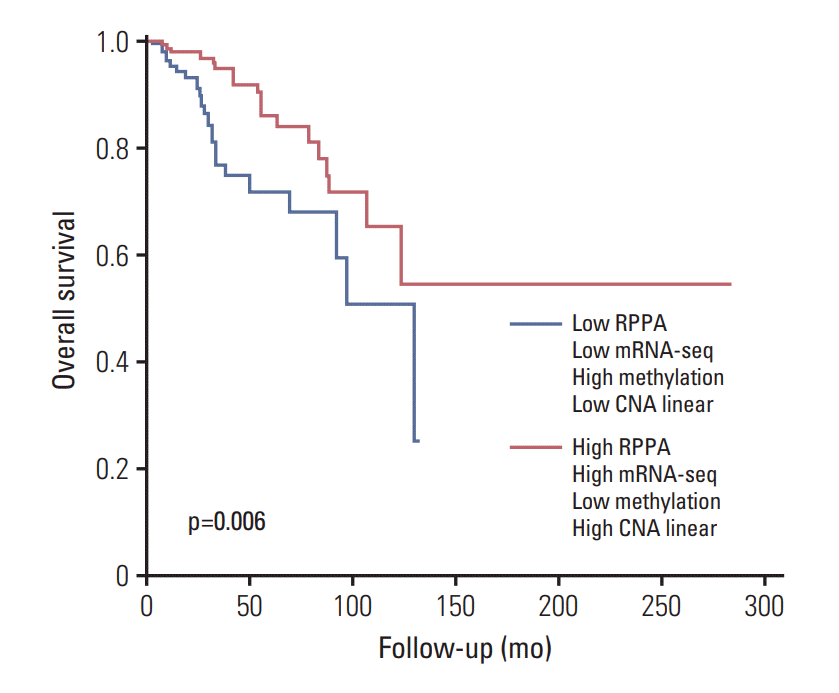
The subjects were categorized into a low BCL2 group and a high BCL2 group according to the expression levels of RPPA, mRNA-seq, methylation, and CNA linear. The low BCL2 group was defined as RPPA low, mRNA-seq low, methylation high, and CNA linear low. The high BCL2 group was defined as RPPA high, mRNA-seq high, methylation low, and CNA linear high. The high BCL2 group (n=171) had a superior overall survival rate in comparison to the low BCL2 group (n=114) (5-year survival rates were 86.1% and 71.8% for the high BCL2 group and the low BCL2 group, respectively; p=0.006) (Fig. 4). Seventy-three percent of luminal subtype patients and 91.1% of non-luminal subtype patients were classified into the high BCL2 group and the low BCL2 group, respectively. Notably, 27.0% of luminal subtype patients and only 8.9% of non-luminal subtype patients were classified into the low BCL2 group and the high BCL2 group, respectively (S6 Table). BCL2 group was a significant factor by univariate analysis (hazard ratio, 0.426; 95% CI, 0.228 to 0.797; p=0.008) and it was still a significant independent factor by multivariate analysis (hazard ratio, 0.362; 95% CI, 0.149 to 0.884; p=0.026) after being adjusted with node positivity, metastasis, and menopausal status which were also significant factors by univariate analysis (S7 Table).
In this study, we analyzed molecular aberrations in BCL2 across DNA, RNA, protein, and methylation status by analyzing TCGA database, and we attempted to reveal the relationship across clinical and biological parameters associated with BCL2 regulation according to the molecular subtypes of breast cancer.
This study showed that the expression levels of BCL2 protein (RPPA) and mRNA (mRNA-seq, mRNA microarray) were upregulated in the luminal A and luminal B subtypes compared to the HER2 and TN subtypes. Hypomethylation was observed in the luminal A and luminal B subtypes compared to the HER2 and TN subtypes. Although CNA (CNA linear or CNA nonlinear) showed a tendency towards increased amplification in the luminal A subtype compared to the other subtypes, no prominent findings were observed. In this study, no BCL2 mutation was found in any subject. These findings suggest that increased expression of BCL2 protein or mRNA in the luminal A or luminal B subtypes could mainly be associated with hypomethylation of BCL2, and that copy number amplification of BCL2 might have little association with BCL2 regulation in breast cancer. BCL2 regulation was irrespective of mutation status. Hwang et al. [14] reported that BCL2 protein expression as assessed by IHC was positive in 88.8%, 76.4%, 18.3%, and 39.8% of cases with the luminal A, luminal B, HER2, and TN subtypes, respectively. Seong et al. [15] reported that BCL2 protein expression was positive in 74.0%, 10.7%, 2.8%, and 12.5% of cases with the luminal A, luminal B, HER2, and TN subtypes, respectively. TCGA Network reported that, amongst those with RPPA-defined luminal tumors, there was high protein expression of ER, PR, androgen receptor, BCL2, GATA binding protein 3, and inositol polyphosphate-4-phosphatase type II B, defining mostly luminal A cancers and a second more heterogeneous protein subgroup comprising both luminal A and luminal B cancers. They also reported that luminal mRNA subtype/HER2-positive tumors showed higher expression of the luminal gene cluster, including GATA binding protein 3, BCL2, and estrogen receptor 1, than did HER2 mRNA subtype/HER2-positive tumors [18]. Little has been revealed about methylation, CNA, and mutations in BCL2 in breast cancer in previous reports.
The expression levels of BCL2 protein and mRNA were strongly associated with the status of ER, PR, and HER2; high expression of protein or mRNA was strongly associated with ER/PR and negatively correlated with HER2. Previous papers reported associations between the expression of BCL2 and ER, PR, and HER2 [14,22-25]. Bouchalova et al. [22] reported that 86% of breast cancer patients with positive BCL2 protein expression were positive for ER as assessed by IHC and 69% of patients negative for BCL2 protein expression were also negative for ER. Hwang et al. [14] reported that BCL2 protein expression was positive in 81.0%, 69.8%, and 12.4% of breast cancer patients who were positive for ER, PR, and HER2, respectively, and that BCL2 protein expression was positive in 18.1%, 29.9%, and 74.2% of patients negative for ER, PR, and HER2, respectively. Although a negative association has been reported between BCL2 protein expression and stage of breast cancer [13,14,26,27], this study showed a weak or absent association between cancer stage and expression of BCL2 protein or mRNA.
Scatter plots depicting the biological parameters showed a strong positive correlation between protein and mRNA levels and a strong negative correlation between methylation and mRNA levels. Correlation analysis also revealed a strong positive correlation between protein and mRNA levels and a strong negative correlation between methylation and protein or mRNA levels. CNA showed a weak positive correlation with protein and mRNA levels and a weak negative correlation with methylation status. These findings also suggest that the expression of BCL2 protein or mRNA is strongly correlated with methylation and that CNA plays a minor role in BCL2 regulation in breast cancer. Regarding the molecular subtypes of breast cancer, the luminal A and luminal B subtypes showed strong correlations among all of the biological parameters, except for a weak correlation between methylation and CNA in the luminal B subtype. The HER2 subtypes showed relatively weak correlations among the biological parameters compared to the luminal A and luminal B subtypes. The HER2 subtype showed weak correlations between CNA and the other biological parameters including RPPA, mRNA, and methylation. The HER2 subtype also showed a weak correlation between methylation and the other biological parameters. The TN subtype showed a weak correlation between CNA and RPPA and no correlation between CNA and methylation level. We could not find reference papers that described correlations among the biological parameters related to BCL2 in breast cancer.
Survival analysis in this study revealed that the high BCL2 group showed a superior overall survival rate compared to the low BCL2 group. Not only BCL2 group was a significant prognostic factor by univariate analysis, but also it was a significant independent prognostic factor by multivariate analysis. The survival difference according to BCL2 expression was not so prominent by survival analysis using this TCGA dataset of breast cancer. While the extreme patient groups of both ends in the spectrum of the subjects according to BCL2 expression only showed the survival difference, simple groupings of the whole subjects into two groups according to BCL2 expression did not show the survival difference in this study. The high BCL2 group was significantly associated with the luminal A and luminal B subtypes and the low BCL2 group was mostly assigned to the HER or TN subtypes. High BCL2 protein expression has been reported to be associated with favorable prognosis in patients with breast cancer. Hwang et al. reported that BCL2 protein expression as assessed by IHC was a powerful independent prognostic factor in patients with breast cancer, and they also reported that favorable clinicopathologic features and a strong correlation with the hormonal receptor may be causes of the superior survival rate in patients with BCL2-positive breast cancer [13]. BCL2 protein expression was reported to have different prognostic importance in different molecular subtypes of breast cancer. Although Dawson et al. [11] reported that BCL2 is an independent favorable prognostic factor for all subtypes of early-stage breast cancer including TNBC, Seong et al. [15] reported that BCL2 was an independent favorable prognosticator only in patients with the luminal A subtype. Hwang et al. [14] reported that BCL2 was a strong favorable prognostic factor in those with the luminal A subtype and a marginally significant favorable prognostic factor in patients with the luminal B subtype. They also reported that BCL2 had no prognostic importance in patients with the HER2 and TN subtypes [14]. We could not find any publications that report the prognostic roles of mRNA, CNA, or methylation of BCL2 in breast cancer.
In this study, we attempted to identify the clinical significance of BCL2 aberrations in breast cancer by an analysis of the clinical and biologic information available in TCGA database. This study has several limitations. First, as the number of subjects was relatively small, the statistical power might be limited, especially in the subgroup analyses. Second, the results of this study were not externally validated, thus necessitating further studies. Third, this study did not analyze the interactions between BCL2 and other related genes.
In conclusion, the regulation of BCL2 was mainly associated with methylation across the molecular subtypes of breast cancer, and luminal A and luminal B subtypes showed upregulated expression of BCL2 protein, mRNA and hypomethylation. Although CNA could play a minor role in regulation of BCL2, mutation was not related to BCL2 regulation. Upregulation of BCL2 was associated with superior prognosis in comparison to downregulation of BCL2 in breast cancer.
Electronic Supplementary Material
Supplementary materials are available at Cancer Research and Treatment website (http://www.e-crt.org).
ACKNOWLEDGMENTS
We appreciate valuable discussion from the members of the Boramae Hospital Breast Cancer Study group (BBS). Ki-Tae Hwang, MD, PhD, Department of Surgery; Bo Kyung Koo, MD, PhD, Department of Internal Medicine; Young A Kim, MD, PhD, Department of Pathology; Jongjin Kim, MD, Department of Surgery; Eun Youn Roh, MD, PhD, Department of Laboratory Medicine; Sung Bae Park, MD, Department of Neurosurgery; Jin Hyun Park, MD, MS, Department of Internal Medicine; Han Mo Sung, RN, Department of Surgery; So Won Oh, MD, PhD, Department of Nuclear Medicine; Sohee Oh, PhD, Department of Biostatistics; Jong Yoon Lee, MD, MS, Department of Radiology; Ji Hyun Chang, MD, PhD, Department of Radiation Oncology; Se Hee Jung, MD, PhD, Department of Rehabilitation Medicine; Young Jun Chai, MD, MS, Department of Surgery; In Sil Choi, MD, PhD, Department of Internal Medicine; A Jung Chu, MD, Department of Radiology; Kyu Ri Hwang, MD, PhD; Department of Obstetrics and Gynecology; Eunjoo Hwang, Department of Surgery.
All BBS members are from Seoul National University Boramae Medical Center (20 Boramae-ro 5-gil, Donggak-gu, Seoul 07061, Republic of Korea).
The results of this study are in whole or part based upon data generated by the TCGA Research Network (http://cancergenome.nih.gov/).
This work was supported by a multidisciplinary research grantin-aid from the Seoul Metropolitan Government Seoul National University Boramae Medical Center (02-2016-8).
References
1. Ebrahim AS, Sabbagh H, Liddane A, Raufi A, Kandouz M, Al-Katib A. Hematologic malignancies: newer strategies to counter the BCL-2 protein. J Cancer Res Clin Oncol. 2016; 142:2013–22.
2. Czabotar PE, Lessene G, Strasser A, Adams JM. Control of apoptosis by the BCL-2 protein family: implications for physiology and therapy. Nat Rev Mol Cell Biol. 2014; 15:49–63.
3. Tsujimoto Y, Finger LR, Yunis J, Nowell PC, Croce CM. Cloning of the chromosome breakpoint of neoplastic B cells with the t(14;18) chromosome translocation. Science. 1984; 226:1097–9.
4. Cleary ML, Smith SD, Sklar J. Cloning and structural analysis of cDNAs for bcl-2 and a hybrid bcl-2/immunoglobulin transcript resulting from the t(14;18) translocation. Cell. 1986; 47:19–28.
5. Tzifi F, Economopoulou C, Gourgiotis D, Ardavanis A, Papa-georgiou S, Scorilas A. The role of BCL2 family of apoptosis regulator proteins in acute and chronic leukemias. Adv Hematol. 2012; 2012:524308.
6. Martin B, Paesmans M, Berghmans T, Branle F, Ghisdal L, Mascaux C, et al. Role of Bcl-2 as a prognostic factor for survival in lung cancer: a systematic review of the literature with meta-analysis. Br J Cancer. 2003; 89:55–64.
7. Cheng H, Wang X, Li T, Chen L. Bcl-2 expression and patient survival in gastric cancer: a systematic review of the literature with meta-analysis. Med Oncol. 2015; 32:389.
8. Zhao L, Yu N, Guo T, Hou Y, Zeng Z, Yang X, et al. Tissue biomarkers for prognosis of prostate cancer: a systematic review and meta-analysis. Cancer Epidemiol Biomarkers Prev. 2014; 23:1047–54.
9. Correia C, Lee SH, Meng XW, Vincelette ND, Knorr KL, Ding H, et al. Emerging understanding of Bcl-2 biology: implications for neoplastic progression and treatment. Biochim Biophys Acta. 2015; 1853:1658–71.
10. Delbridge AR, Grabow S, Strasser A, Vaux DL. Thirty years of BCL-2: translating cell death discoveries into novel cancer therapies. Nat Rev Cancer. 2016; 16:99–109.
11. Dawson SJ, Makretsov N, Blows FM, Driver KE, Provenzano E, Le Quesne J, et al. BCL2 in breast cancer: a favourable prognostic marker across molecular subtypes and independent of adjuvant therapy received. Br J Cancer. 2010; 103:668–75.
12. Callagy GM, Webber MJ, Pharoah PD, Caldas C. Meta-analysis confirms BCL2 is an independent prognostic marker in breast cancer. BMC Cancer. 2008; 8:153.
13. Hwang KT, Woo JW, Shin HC, Kim HS, Ahn SK, Moon HG, et al. Prognostic influence of BCL2 expression in breast cancer. Int J Cancer. 2012; 131:E1109–19.
14. Hwang KT, Han W, Kim J, Moon HG, Oh S, Song YS, et al. Prognostic influence of BCL2 on molecular subtypes of breast cancer. J Breast Cancer. 2017; 20:54–64.
15. Seong MK, Lee JY, Byeon J, Sohn YJ, Seol H, Lee JK, et al. Bcl- 2 is a highly significant prognostic marker of hormone-receptor- positive, human epidermal growth factor receptor-2-negative breast cancer. Breast Cancer Res Treat. 2015; 150:141–8.
16. McDonnell TJ, Korsmeyer SJ. Progression from lymphoid hyperplasia to high-grade malignant lymphoma in mice transgenic for the t(14; 18). Nature. 1991; 349:254–6.
17. Cancer Genome Atlas Research Network, Weinstein JN, Collisson EA, Mills GB, Shaw KR, Ozenberger BA, et al. The Cancer Genome Atlas Pan-Cancer analysis project. Nat Genet. 2013; 45:1113–20.
18. Cancer Genome Atlas Network. Comprehensive molecular portraits of human breast tumours. Nature. 2012; 490:61–70.
19. Ciriello G, Gatza ML, Beck AH, Wilkerson MD, Rhie SK, Pastore A, et al. Comprehensive molecular portraits of invasive lobular breast cancer. Cell. 2015; 163:506–19.
20. Chang JT, Wang F, Chapin W, Huang RS. Identification of microRNAs as breast cancer prognosis markers through The Cancer Genome Atlas. PLoS One. 2016; 11:e0168284.
21. Ma CX, Ellis MJ. The Cancer Genome Atlas: clinical applications for breast cancer. Oncology (Williston Park). 2013; 27:1263–9.
22. Bouchalova K, Kharaishvili G, Bouchal J, Vrbkova J, Megova M, Hlobilkova A. Triple negative breast cancer: BCL2 in prognosis and prediction. Review. Curr Drug Targets. 2014; 15:1166–75.
23. Park SH, Kim H, Song BJ. Down regulation of bcl2 expression in invasive ductal carcinomas is both estrogen- and progesterone- receptor dependent and associated with poor prognostic factors. Pathol Oncol Res. 2002; 8:26–30.
24. Bhargava V, Kell DL, van de Rijn M, Warnke RA. Bcl-2 immunoreactivity in breast carcinoma correlates with hormone receptor positivity. Am J Pathol. 1994; 145:535–40.
25. Doglioni C, Dei Tos AP, Laurino L, Chiarelli C, Barbareschi M, Viale G. The prevalence of BCL-2 immunoreactivity in breast carcinomas and its clinicopathological correlates, with particular reference to oestrogen receptor status. Virchows Arch. 1994; 424:47–51.
Table 1.
Table 2.
Table 3.
Group |
RPPA |
mRNA-seq |
Methylation |
CNA linear |
||||
---|---|---|---|---|---|---|---|---|
Coefficienta) | p-value | Coefficienta) | p-value | Coefficienta) | p-value | Coefficienta) | p-value | |
RPPA | ||||||||
All | - | - | 0.737 | < 0.001 | –0.682 | < 0.001 | 0.338 | < 0.001 |
Luminal A | - | - | 0.684 | < 0.001 | –0.547 | < 0.001 | 0.357 | < 0.001 |
Luminal B | - | - | 0.694 | < 0.001 | –0.713 | < 0.001 | 0.456 | < 0.001 |
HER2 | - | - | 0.742 | < 0.001 | –0.488 | 0.034 | 0.481 | 0.002 |
TN | - | - | 0.746 | < 0.001 | –0.584 | < 0.001 | 0.299 | 0.001 |
mRNA-seq | ||||||||
All | 0.737 | < 0.001 | - | - | –0.648 | < 0.001 | 0.450 | < 0.001 |
Luminal A | 0.684 | < 0.001 | - | - | –0.551 | < 0.001 | 0.502 | < 0.001 |
Luminal B | 0.694 | < 0.001 | - | - | –0.587 | < 0.001 | 0.572 | < 0.001 |
HER2 | 0.742 | < 0.001 | - | - | –0.581 | 0.009 | 0.382 | 0.016 |
TN | 0.746 | < 0.001 | - | - | –0.661 | < 0.001 | 0.291 | < 0.001 |
Methylation | ||||||||
All | –0.682 | < 0.001 | –0.648 | < 0.001 | - | - | –0.186 | < 0.001 |
Luminal A | –0.547 | < 0.001 | –0.551 | < 0.001 | - | - | –0.184 | < 0.001 |
Luminal B | –0.713 | < 0.001 | –0.587 | < 0.001 | - | - | –0.269 | 0.008 |
HER2 | –0.488 | 0.034 | –0.581 | 0.009 | - | - | –0.547 | 0.015 |
TN | –0.584 | < 0.001 | –0.661 | < 0.001 | - | - | –0.104 | 0.268 |
CNA linear | ||||||||
All | 0.338 | < 0.001 | 0.450 | < 0.001 | –0.186 | < 0.001 | - | - |
Luminal A | 0.357 | < 0.001 | 0.502 | < 0.001 | –0.184 | < 0.001 | - | - |
Luminal B | 0.456 | < 0.001 | 0.572 | < 0.001 | –0.269 | 0.008 | - | - |
HER2 | 0.481 | 0.002 | 0.382 | 0.016 | –0.547 | 0.015 | - | - |
TN | 0.299 | 0.001 | 0.291 | < 0.001 | –0.104 | 0.268 | - | - |