Introduction
Materials and Methods
1. Patients
2. Treatment and follow-up
3. Statistical analysis
Results
1. Demographic and clinicopathological characteristics
Table 1.
| Category | No. |
ANRI |
χ2 | r | p-value | |
|---|---|---|---|---|---|---|
| ≤ 6.7 (n=94) | > 6.7 (n=90) | |||||
| Age (yr) | ||||||
| ≤ 60 | 117 | 59 (50.4) | 58 (49.6) | 0.056 | - | 0.813 |
| > 60 | 67 | 35 (52.2) | 32 (47.8) | |||
| Sex | ||||||
| Female | 85 | 40 (47.1) | 45 (52.9) | 1.026 | - | 0.311 |
| Male | 99 | 54 (54.5) | 45 (45.5) | |||
| Preoperative symptom | ||||||
| No | 51 | 26 (51.0) | 25 (49.0) | 0.000 | - | 0.986 |
| Yes | 133 | 68 (51.1) | 65 (48.9) | |||
| Cirrhosis | ||||||
| No | 138 | 70 (50.7) | 68 (49.3) | 0.029 | - | 0.865 |
| Yes | 46 | 24 (52.2) | 22 (47.8) | |||
| HBsAg | ||||||
| Negative | 133 | 67 (50.4) | 66 (49.6) | 0.097 | - | 0.755 |
| Positive | 51 | 27 (52.9) | 24 (47.1) | |||
| Tumor number | ||||||
| Single | 121 | 60 (49.6) | 61 (50.4) | 0.318 | - | 0.573 |
| Multiple | 63 | 34 (54.0) | 29 (46.0) | |||
| Tumor size (cm)a) | ||||||
| ≤ 6 | 97 | 42 (43.3) | 55 (56.7) | 4.980 | –0.165 | 0.026 |
| > 6 | 87 | 52 (59.8) | 35 (40.2) | |||
| Capsulation | ||||||
| No | 111 | 58 (52.3) | 53 (47.7) | 0.152 | - | 0.697 |
| Yes | 73 | 36 (49.3) | 37 (50.7) | |||
| Differentiationb) | ||||||
| W+M | 125 | 60 (48.0) | 65 (52.0) | 1.487 | - | 0.223 |
| P | 59 | 34 (57.6) | 25 (42.4) | |||
| Lymph node metastasis | ||||||
| No | 111 | 51 (45.9) | 60 (54.1) | 2.959 | - | 0.085 |
| Yes | 73 | 43 (58.9) | 30 (41.1) | |||
| Vascular invasion | ||||||
| No | 174 | 90 (52.0) | 83 (48.0) | 1.015 | - | 0.314 |
| Yes | 11 | 4 (36.4) | 7 (63.6) | |||
| TNMc) | ||||||
| I+II | 79 | 39 (49.4) | 40 (50.6) | 0.164 | - | 0.686 |
| III+IV | 105 | 55 (52.4) | 50 (47.6) | |||
| Resection margin | ||||||
| R0 | 108 | 60 (55.6) | 48 (44.4) | 2.089 | - | 0.148 |
| R1 | 76 | 34 (44.7) | 42 (55.3) | |||
| Biliary-intestinal anastomosis | ||||||
| No | 158 | 83 (52.5) | 75 (47.5) | 0.934 | - | 0.334 |
| Yes | 26 | 11 (42.3) | 15 (57.7) | |||
| Complication | ||||||
| No | 155 | 79 (51.0) | 76 (49.0) | 0.006 | - | 0.940 |
| Yes | 29 | 15 (51.7) | 14 (48.3) | |||
| Intraoperative blood loss (mL)a) | ||||||
| ≤ 400 | 104 | 55 (52.9) | 49 (47.1) | 0.309 | - | 0.578 |
| > 400 | 80 | 39 (48.8) | 41 (51.2) | |||
| Recurrence | ||||||
| No | 21 | 3 (14.3) | 18 (85.7) | 12.848 | –0.264 | < 0.001 |
| Yes | 163 | 91 (55.8) | 72 (44.2) | |||
| WBC (×109/L) | ||||||
| ≤ 10 | 148 | 63 (42.6) | 85 (57.4) | 21.971 | –0.346 | < 0.001 |
| > 10 | 36 | 31 (86.1) | 5 (13.9) | |||
| Neutrophil (×109/L)a) | ||||||
| ≤ 4.55 | 93 | 30 (32.3) | 63 (67.7) | 26.679 | –0.381 | < 0.001 |
| > 4.55 | 91 | 64 (70.3) | 27 (29.7) | |||
| Platelet (×109/L) | ||||||
| ≤ 300 | 139 | 66 (47.5) | 73 (52.5) | 2.956 | - | 0.086 |
| > 300 | 45 | 28 (62.2) | 17 (37.8) | |||
| AST (U/L) | ||||||
| ≤ 37 | 133 | 89 (66.9) | 44 (33.1) | 48.122 | 0.511 | < 0.001 |
| > 37 | 51 | 5 (9.8) | 46 (90.2) | |||
| ALT (U/L) | ||||||
| ≤ 80 | 158 | 91 (57.6) | 67 (42.4) | 18.952 | 0.321 | < 0.001 |
| > 80 | 26 | 3 (11.5) | 23 (88.5) | |||
| γ-GT (U/L) | ||||||
| ≤ 50 | 50 | 24 (48.0) | 26 (52.0) | 0.262 | - | 0.609 |
| > 50 | 134 | 70 (52.2) | 64 (47.8) | |||
| AFP (μg/L) | ||||||
| ≤ 200 | 176 | 89 (50.6) | 87 (49.4) | 0.436 | - | 0.509 |
| > 200 | 8 | 5 (62.5) | 3 (37.5) | |||
| CEA (μg/L) | ||||||
| ≤ 5.0 | 107 | 53 (49.5) | 54 (50.5) | 0.247 | - | 0.619 |
| > 5.0 | 77 | 41 (53.2) | 36 (46.8) | |||
| CA19-9 (U/mL) | ||||||
| ≤ 35 | 65 | 37 (56.9) | 28 (43.1) | 1.370 | - | 0.242 |
| > 35 | 119 | 57 (47.9) | 62 (52.1) | |||
ANRI, aspartate aminotransferase/neutrophil count ratio index; ICC, intrahepatic cholangiocarcinoma; HBsAg, hepatitis B surface antigen; W+M, well+moderated differentiation; P, poor differentiation; WBC, white blood cell; AST, aspartate aminotransferase; ALT, alanine transaminase; γ-GT, γ-glutamyl transpeptidase; AFP, α-fetoprotein; CEA, carcinoembryonic antigen; CA19-9, carbohydrate antigen 19-9.
2. Determination of an ANRI cut-off value
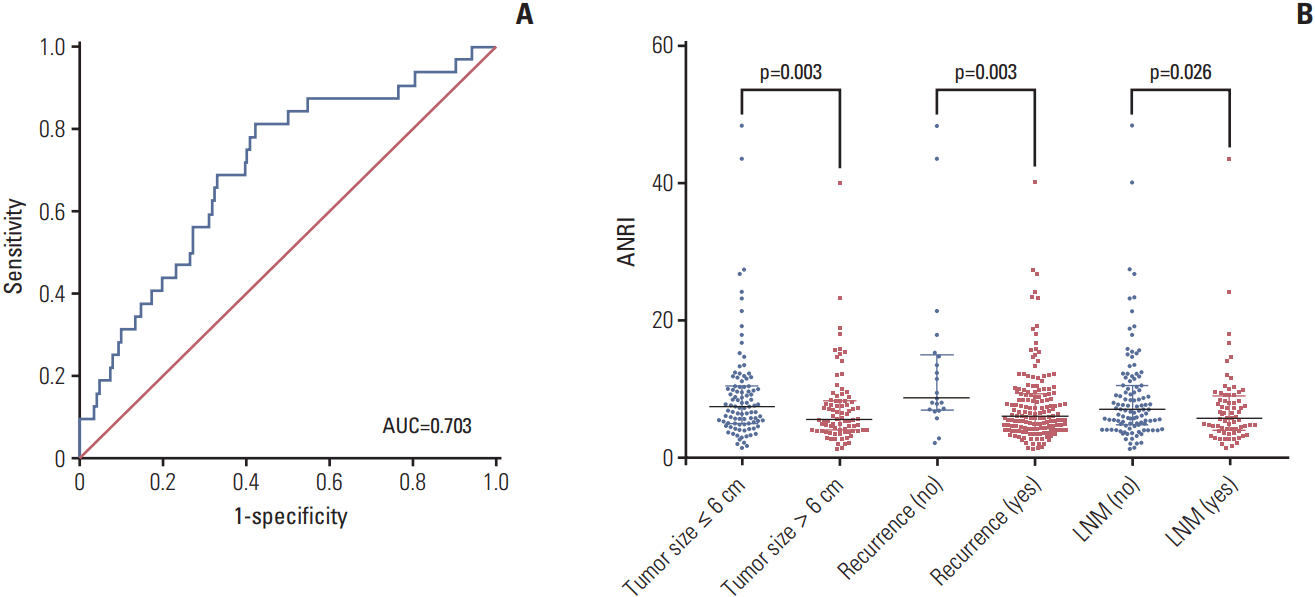 | Fig. 1.Receiver operating characteristic (ROC) curve and distribution of preoperative aspartate aminotransferase/neutrophil count ratio index (ANRI) in different intrahepatic cholangiocarcinoma (ICC) subgroups. (A) ROC analysis was performed to determine the optimal cut-off value of ANRI in patients with ICC after hepatectomy (cut-off value=6.7). The area under the ROC curve for survival status was 0.703 (95% confidence interval, 0.604 to 0.802; p < 0.001), with a sensitivity of 81.3% and a specificity of 57.9%. (B) Comparison of preoperative ANRI in ICC subgroups, stratified by tumor size, recurrence, and lymph node metastasis (LNM). The proportions of ICC patients with declined preoperative ANRI along with tumor size > 6 cm, recurrence, and with LNM are much higher than those with tumor size ≤ 6 cm, without recurrence, and without LNM, respectively (all p < 0.05, Mann-Whitney U test). AUC, area under the curve. |
3. Relationship between ANRI and clinicopathological characteristics in ICC
4. Distribution of ANRI according to tumor size, recurrence, and lymph node metastasis
5. Prognostic factors for ICC
Table 2.
| Category | No. |
OS |
p-value |
DFS |
p-value | ||
|---|---|---|---|---|---|---|---|
| 1-Year (%) | 3-Year (%) | 1-Year (%) | 3-Year (%) | ||||
| Age (yr) | |||||||
| ≤ 60 | 117 | 34.2 | 13.4 | 0.723 | 20.5 | 10.9 | 0.437 |
| > 60 | 67 | 41.8 | 11.2 | 25.4 | 11.9 | ||
| Sex | |||||||
| Female | 85 | 47.1 | 15.6 | 0.014 | 30.6 | 14.6 | 0.035 |
| Male | 99 | 28.3 | 8.1 | 15.2 | 8.5 | ||
| Preoperative symptom | |||||||
| No | 51 | 41.2 | 16.7 | 0.464 | 27.5 | 10.5 | 0.575 |
| Yes | 133 | 35.3 | 10.1 | 20.3 | 11.4 | ||
| Cirrhosis | |||||||
| No | 138 | 39.1 | 12.6 | 0.303 | 23.9 | 11.7 | 0.268 |
| Yes | 46 | 30.4 | 8.6 | 17.4 | 9.9 | ||
| HBsAg | |||||||
| Negative | 133 | 36.8 | 13.1 | 0.916 | 23.3 | 11.9 | 0.465 |
| Positive | 51 | 37.3 | 9.5 | 19.6 | 9.8 | ||
| Child-Pugh class | |||||||
| A | 164 | 36.0 | 11.3 | 0.272 | 20.7 | 9.5 | 0.148 |
| B | 20 | 45.0 | 25.0 | 35.0 | 16.7 | ||
| No. of tumors | |||||||
| Single | 121 | 43.0 | 15.3 | 0.003 | 28.1 | 13.8 | 0.001 |
| Multiple | 63 | 25.4 | 5.5 | 11.1 | 6.3 | ||
| Tumor size (cm)a) | |||||||
| ≤ 6 | 97 | 46.4 | 17.6 | 0.006 | 33.0 | 16.2 | < 0.001 |
| > 6 | 87 | 26.4 | 7.9 | 10.3 | 5.7 | ||
| Tumor differentiation | |||||||
| Well+moderated | 125 | 42.4 | 16.4 | 0.002 | 25.6 | 13.20 | 0.02 |
| Poor | 59 | 25.4 | 6.1 | 15.3 | 7.60 | ||
| Capsulation | |||||||
| Noncapsulated | 111 | 35.1 | 8.4 | 0.206 | 21.6 | 9.30 | 0.647 |
| Capsulated | 73 | 39.7 | 17.7 | 23.3 | 14.10 | ||
| Vascular invasion | |||||||
| No | 173 | 38.2 | 13.6 | 0.112 | 22.5 | 12.10 | 0.114 |
| Yes | 11 | 18.2 | 0.0 | 18.2 | 0.0 | ||
| TNM | |||||||
| I+II | 79 | 46.8 | 18.2 | 0.002 | 32.9 | 19.6 | 0.003 |
| III+IV | 105 | 29.5 | 6.1 | 14.3 | 5.3 | ||
| Resection margin | |||||||
| R0 | 108 | 42.6 | 20.1 | 0.001 | 28.7 | 17.0 | 0.001 |
| R1 | 76 | 28.9 | 0.0 | 13.2 | 2.60 | ||
| Lymph node metastasis | |||||||
| No | 111 | 43.2 | 17.7 | 0.003 | 29.7 | 15.5 | 0.011 |
| Yes | 73 | 27.4 | 3.9 | 11.0 | 5.1 | ||
| Biliary-intestinal anastomosis | |||||||
| No | 158 | 38.0 | 13.0 | 0.504 | 23.4 | 11.2 | 0.607 |
| Yes | 26 | 30.8 | 13.5 | 15.4 | 11.5 | ||
| Complication | |||||||
| No | 155 | 38.1 | 12.8 | 0.389 | 23.9 | 11.8 | 0.127 |
| Yes | 29 | 31.0 | 23.0 | 13.8 | 9.2 | ||
| Intraoperative blood loss (mL)a) | |||||||
| ≤ 400 | 104 | 42.3 | 13.5 | 0.068 | 25.0 | 12.4 | 0.024 |
| > 400 | 80 | 30.0 | 12.1 | 18.7 | 10.0 | ||
| WBC (×109/L) | |||||||
| ≤ 10 | 148 | 39.2 | 13.9 | 0.214 | 24.3 | 11.9 | 0.088 |
| > 10 | 36 | 27.8 | 10.0 | 13.9 | 8.3 | ||
| Neutrophil (×109/L)a) | |||||||
| ≤ 4.55 | 93 | 44.1 | 17.1 | 0.034 | 28.0 | 13.7 | 0.031 |
| > 4.55 | 91 | 29.7 | 9.1 | 16.5 | 8.8 | ||
| Platelet (×109/L) | |||||||
| ≤ 300 | 139 | 37.4 | 13.0 | 0.754 | 22.3 | 11.0 | 0.963 |
| > 300 | 45 | 35.6 | 14.7 | 22.2 | 12.3 | ||
| AST (U/L) | |||||||
| ≤ 37 | 133 | 36.1 | 8.9 | 0.284 | 21.1 | 7.6 | 0.425 |
| > 37 | 51 | 39.2 | 20.3 | 25.5 | 16.3 | ||
| ALT (U/L) | |||||||
| ≤ 80 | 158 | 36.7 | 9.8 | 0.083 | 20.3 | 8.5 | 0.092 |
| > 80 | 26 | 38.5 | 34.6 | 34.6 | 26.9 | ||
| γ-GT (U/L) | |||||||
| ≤ 50 | 50 | 48.0 | 12.3 | 0.275 | 28.0 | 9.9 | 0.292 |
| > 50 | 134 | 32.8 | 13.5 | 20.1 | 10.1 | ||
| AFP (μg/L) | |||||||
| ≤ 200 | 176 | 36.9 | 13.1 | 0.658 | 22.7 | 11.2 | 0.259 |
| > 200 | 8 | 37.5 | 0.0 | 12.5 | 0.0 | ||
| CEA (μg/L) | |||||||
| ≤ 5 | 107 | 44.9 | 17.7 | 0.008 | 29.9 | 13.4 | 0.001 |
| > 5 | 77 | 26.0 | 6.6 | 11.7 | 5.5 | ||
| CA19-9 (U/mL) | |||||||
| ≤ 35 | 65 | 43.1 | 12.0 | 0.324 | 24.6 | 8.3 | 0.554 |
| > 35 | 119 | 33.6 | 13.9 | 21.0 | 11.2 | ||
| ANRI | |||||||
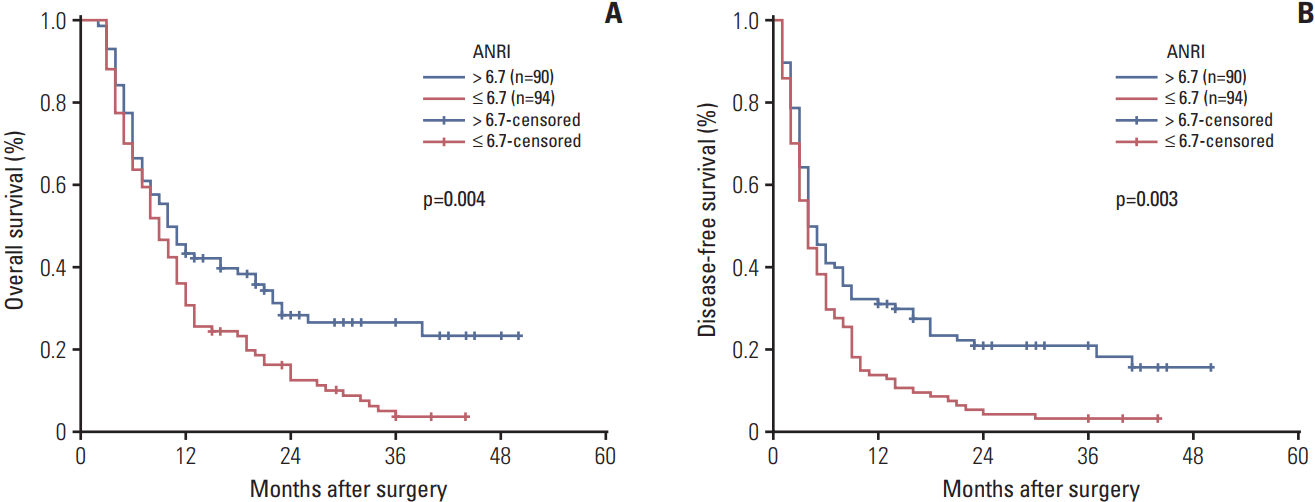
| ≤ 6.7 | 94 | 30.9 | 3.8 | 0.004 | 13.8 | 3.2 | 0.003 |
| > 6.7 | 90 | 43.3 | 26.6 | 31.1 | 20.9 | ||
ICC, intrahepatic cholangiocarcinoma; OS, overall survival; DFS, disease-free survival; HBsAg, hepatitis B surface antigen; WBC, white blood cell; AST, aspartate aminotransferase; ALT, alanine transaminase; γ-GT, γ-glutamyl transpeptidase; AFP, α-fetoprotein; CEA, carcinoembryonic antigen; CA19-9, carbohydrate antigen 19-9; ANRI, aspartate aminotransferase/neutrophil count ratio index.
Table 3.
Variables with p < 0.05 calculated by Kaplan-Meier method (log-rank test) were used in multivariate analysis (Cox proportional hazards model, Backward stepwise). ICC, intrahepatic cholangiocarcinoma; OS, overall survival; DFS, disease-free survival; HR, hazard ratio; CI, confidence interval; W+M, well+moderated differentiation; P, poor differentiation; ANRI, aspartate aminotransferase/neutrophil count ratio index.
6. OS and DFS according to ANRI
7. Prognostic values of ANRI in various subgroups of ICC
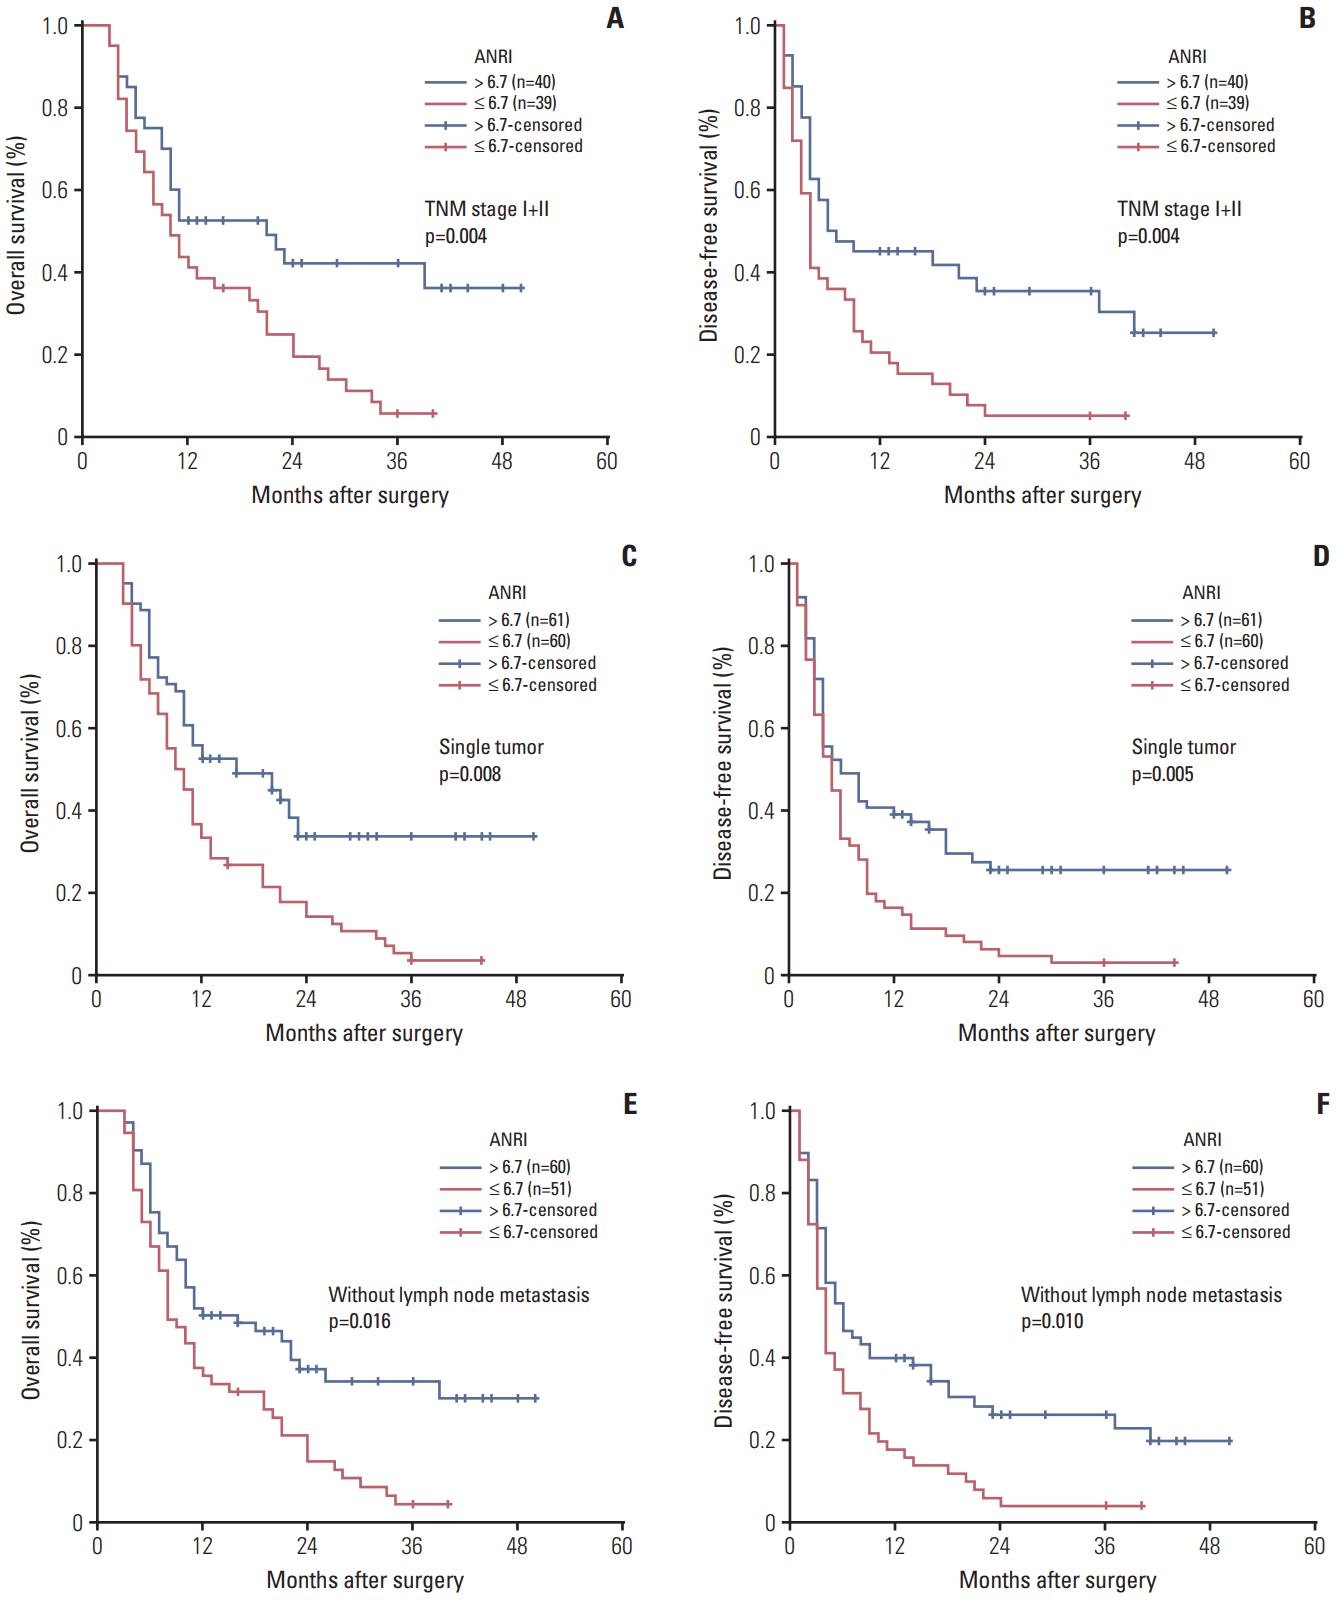 | Fig. 3.Kaplan-Meier survival curves of patients with intrahepatic cholangiocarcinoma after hepatectomy stratified by TNM stage I+II (A, B), single tumor status (C, D), and without lymph node metastasis (E, F). p-values were obtained by log-rank tests. ANRI, aspartate aminotransferase/neutrophil count ratio index. |
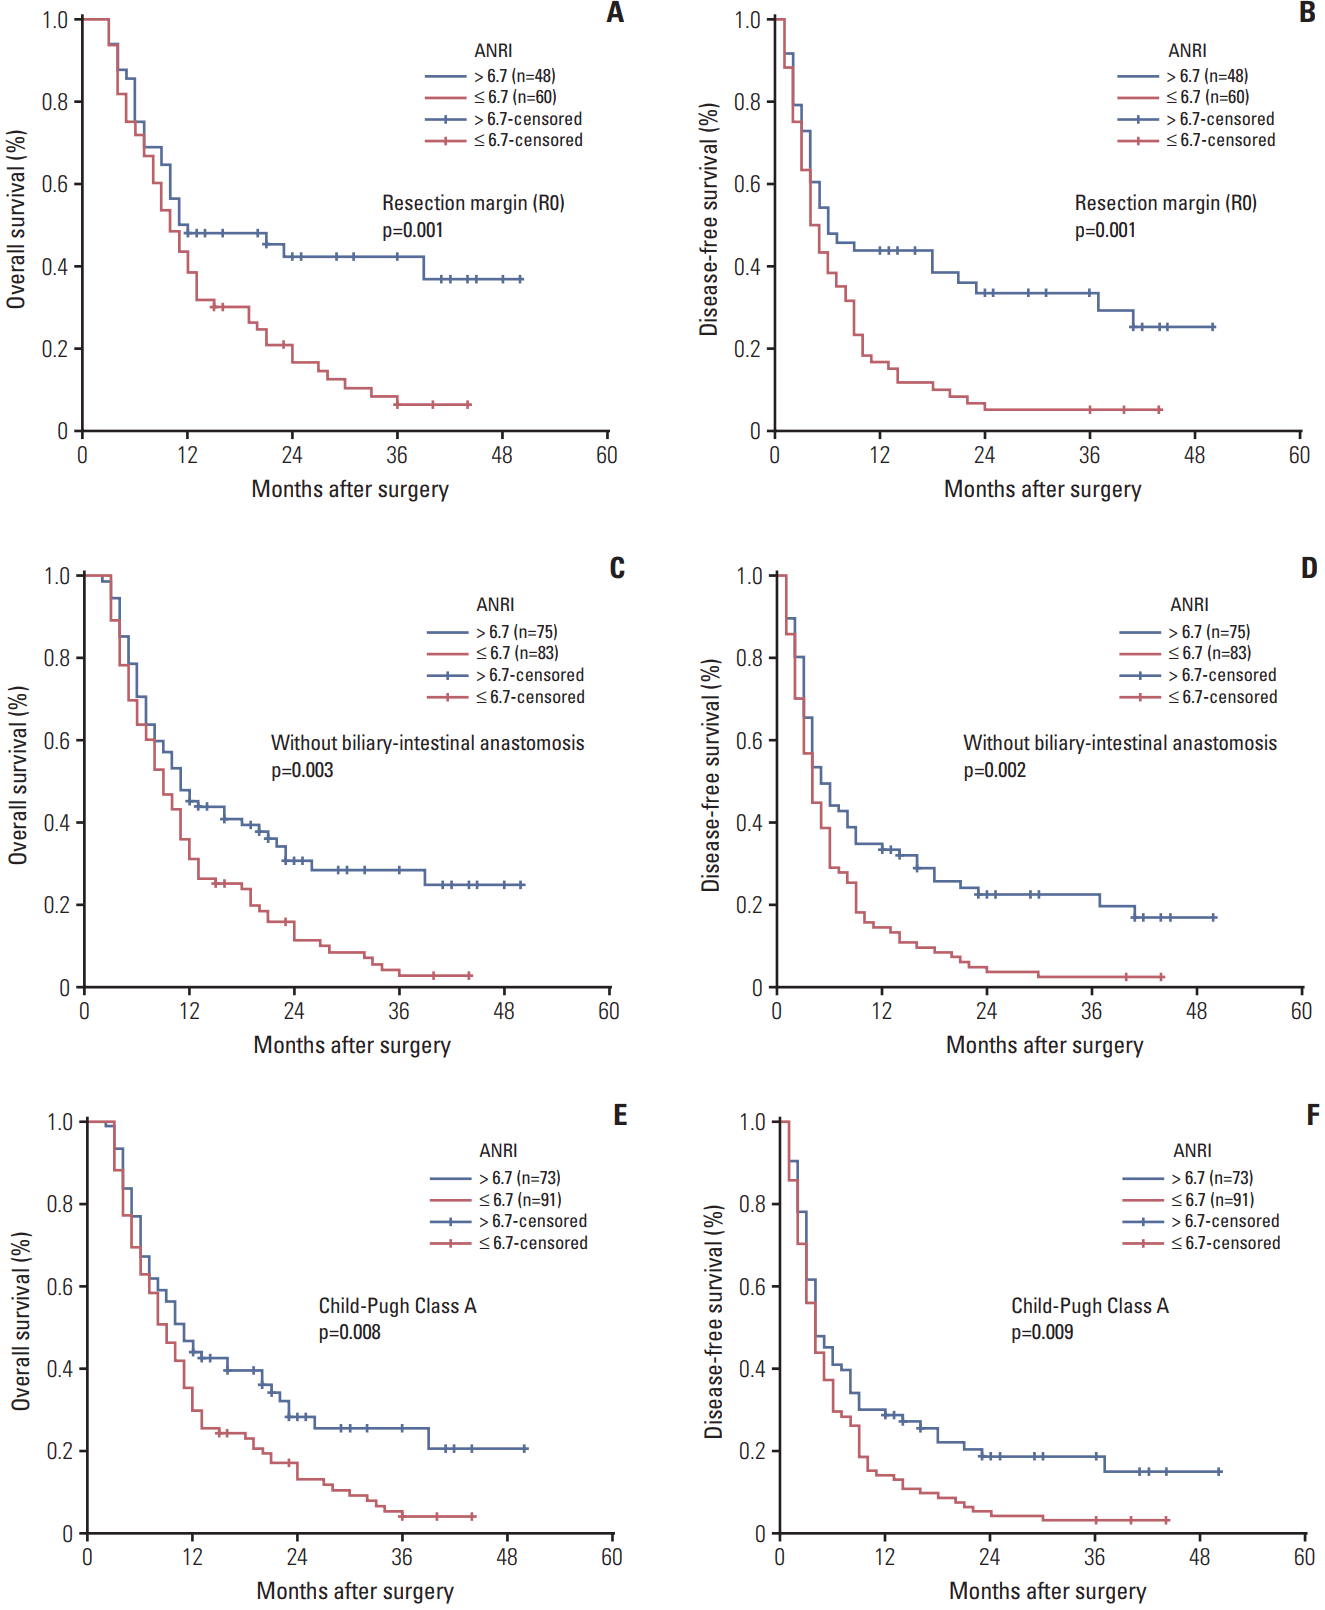 | Fig. 4.Kaplan-Meier survival curves of patients with intrahepatic cholangiocarcinoma after hepatectomy stratified by R0 resection margin (A, B), without biliary-intestinal anastomosis (C, D), and Child-Pugh Class A (E, F). p-values were obtained by log-rank tests. ANRI, aspartate aminotransferase/ neutrophil count ratio index. |
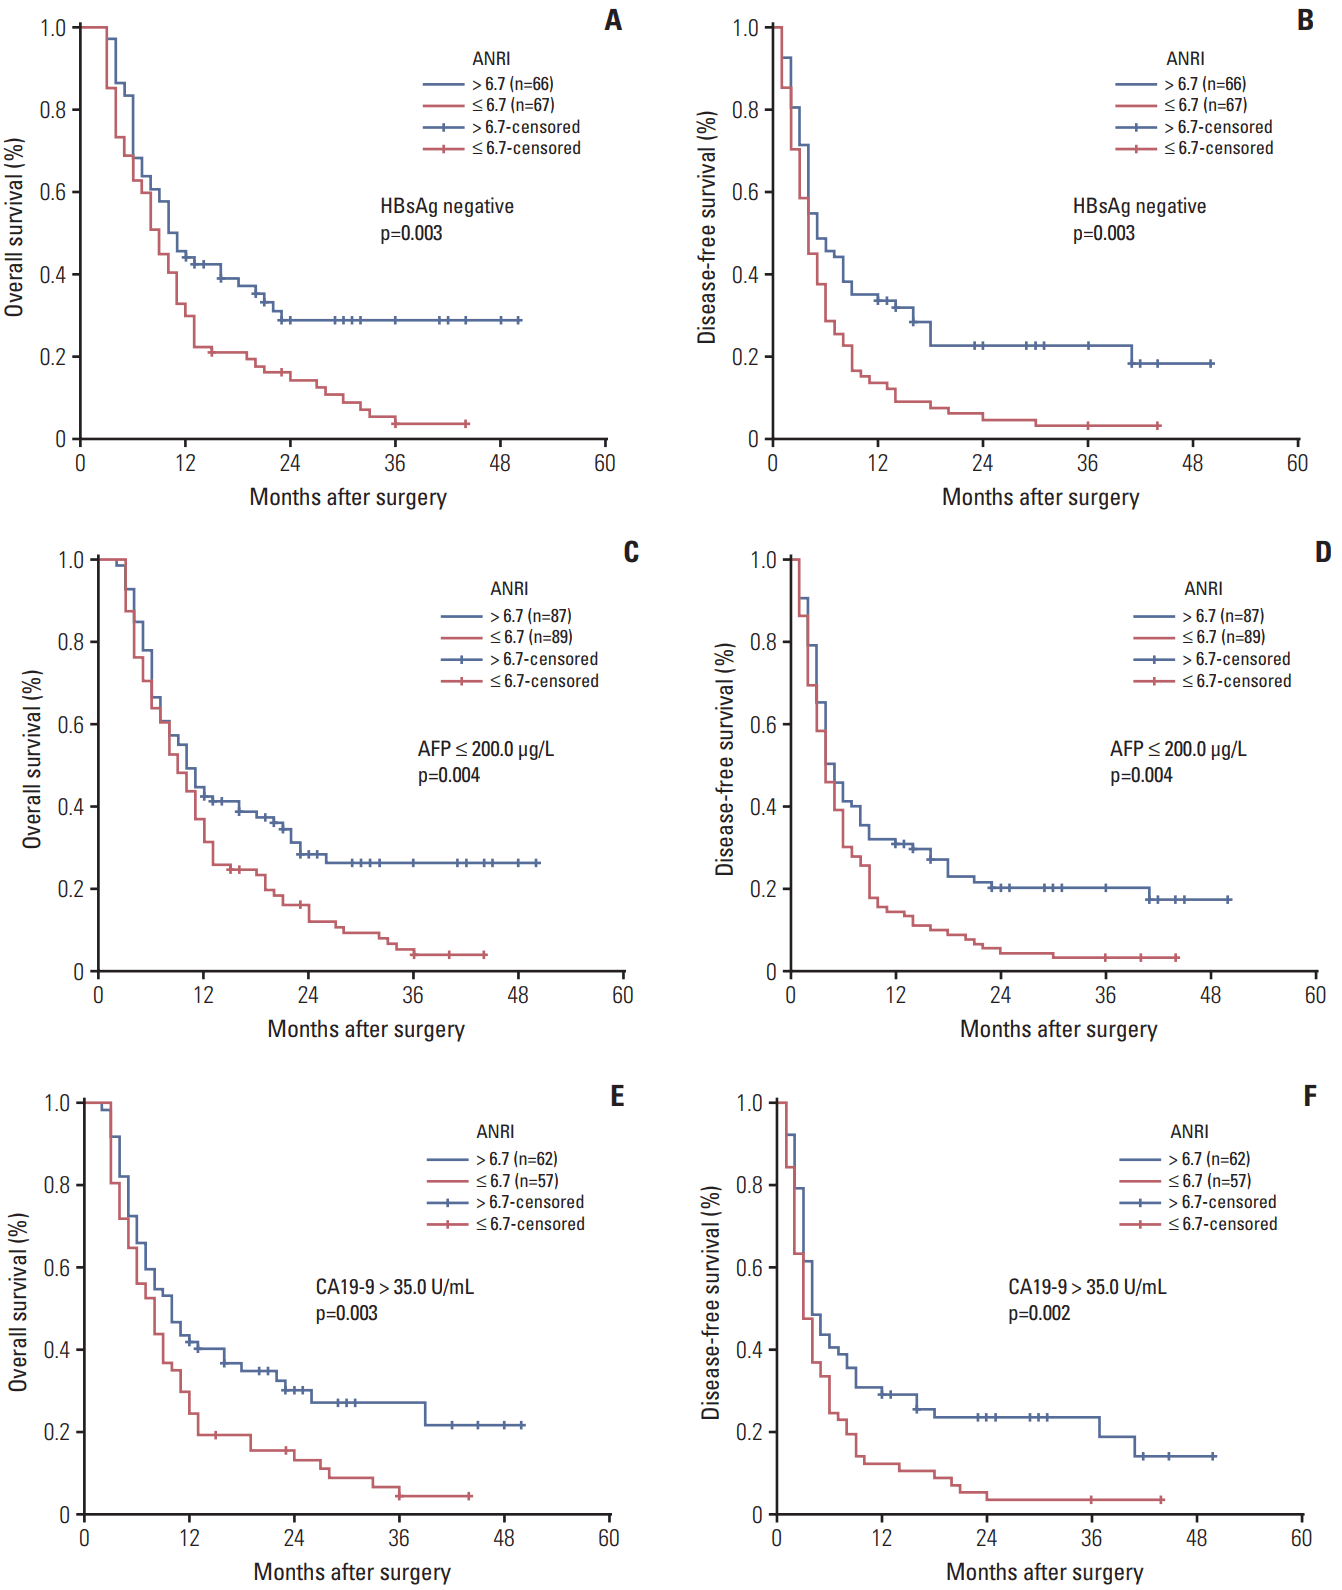 | Fig. 5.Kaplan-Meier survival curves of patients with intrahepatic cholangiocarcinoma after hepatectomy stratified by serum hepatitis B surface antigen (HBsAg) negative (A, B), α-fetoprotein (AFP) ≤ 200.0 μg/L (C, D), and carbohydrate antigen 19-9 (CA19-9) > 35.0 U/mL (E, F). p-values were obtained by log-rank tests. ANRI, aspartate aminotransferase/neutrophil count ratio index. |


 PDF
PDF Citation
 Print
Print


 XML Download