Abstract
Purpose
Everolimus only inhibits mammalian target of rapamycin complex 1 (mTORC1), whereas Ku0063794 inhibits both mTORC1 and mTORC2. Although they have similar anticancer effects, their combination has a synergistic effect against hepatocellular carcinoma (HCC) cells. We aimed to determine the mechanism underlying the synergistic effects of everolimus and Ku0063794 associated with autophagy in HCC cells.
Materials and Methods
We compared the effects of everolimus and Ku0063794, individually or in combination, on both the in vitro and in vivo models of HCCs.
Results
HepG2 cells treated with both agents had significantly lower rates of cell proliferation and higher apoptosis than the individual monotherapies (p < 0.05). Autophagic studies consistently indicated that, unlike the monotherapies, the combination therapy significantly reduced autophagy (p < 0.05). Autophagic blockage directly promoted the pro-apoptotic effects of combination therapy, suggesting autophagy as the survival mechanism of HCC cells. Unlike the monotherapies, combination therapy showed the potential to inhibit sirtuin 1 (SIRT1), the positive regulator of autophagy. SIRT1 overexpression abrogated the autophagy-inhibiting and pro-apoptotic effects of combination therapy. In a nude mouse xenograft model, the shrinkage of tumors was more prominent in mice treated with combination therapy than in mice treated with the respective monotherapies (p < 0.05). The immunohistochemical and immunofluorescence stains of the tumor obtained from the xenograft model showed that combination therapy had the potential of reducing autophagy and promoting apoptosis.
Hepatocellular carcinoma (HCC) is the third leading cancer causing death worldwide with a 5-year survival rate of 10%, leading to 250,000 to 1,000,000 deaths per year [1,2]. Aberrant mammalian target of rapamycin (mTOR) signaling has been detected in up to 48% of HCC patients, and correlates with poor prognosis [3]. In mTOR signaling, the proliferation signal is passed to two sets of effector molecules: Akt (a mammalian target of rapamycin complex 1 [mTORC1] downstream molecule), and S6K1 and 4EBP1 (mTORC2 downstream molecules) [4,5]. It was reported that everolimus, an mTORC1 inhibitor, failed to provide more significant anticancer effects against HCC compared to other chemotherapeutic agents [6,7]. One plausible explanation for this phenomenon is that everolimus only inhibits mTORC1, thereby allowing proliferative signaling via mTORC2 [5]; uninhibited mTORC2 signaling might interfere with the anticancer effects of everolimus by allowing Akt activation, which has been consistently inhibited by mTORC2. However, we previously found that the similar anti-HCC effects had been obtained by the regimens blocking either mTORC1 (everolimus) or mTORC2 (Ku0063794) [8]. Moreover, we unexpectedly detected that combining everolimus with Ku0063794 exhibited a synergistic anticancer effect in HCC cells.
Since autophagy essentially involves cell survival, effects on autophagy should be considered when determining the efficacy of antitumor agents. Autophagy is a specialized intracellular process for degrading and recycling cellular macromolecules to maintain cellular homeostasis [9,10]. It can contribute to cell survival or death, depending on its level of activity; an appropriate level of autophagic activity protects cells by recycling intracellular macromolecules or organelles, whereas excessive autophagy may lead to cell damage, ultimately causing cell death [11]. mTOR signaling is known to control the autophagic machinery [10,12]. Under unstimulated conditions, autophagy is consistently inhibited by mTOR signaling; however, blocking of mTOR signaling, possibly by starvation or the treatment with an mTOR inhibitor, can trigger autophagy [13].
Recent studies have indicated that sirutuin 1 (SIRT1) is a key player in the autophagic process [14,15]. SIRT1 belongs to the histone deacetylase class III family [16,17]. They are involved in the post-translational modification of translated proteins. SIRT1-mediated autophagy essentially involves cell proliferation, metabolism, and resistance to stress [14,18,19]. SIRT1 can promote autophagy by deacetylating not only essential autophagy-related proteins, such as Atg5, Atg7, and Atg8, but also numerous transcription factors, including p53, nuclear factor κB, FoxO3, E2F1, histone H4, FoxO1, S6K, and tuberous sclerosis complex 2 [15,18]. Subsequently, after deacetylation, these transcription factors can activate autophagy-related genes. We previously demonstrated that, unlike individual monotherapy which failed to inhibit SIRT1 expression, combining everolimus with Ku0063794 significantly inhibited SIRT1 expression in a dose-dependent manner [8]. In this further study, we investigated the effects of everolimus and Ku0063794, individually or in combination, on autophagy. Subsequently, we attempted to determine the mechanism of their synergistic combination therapy effect in relation to SIRT1-mediated autophagy in HCC cells. Subsequently, we attempted to determine the mechanism by which the synergistic combination therapy effect acts in relation to SIRT1-mediated autophagy in HCC cells.
Everolimus and Ku0063794 were obtained from Selleckem (Houston, TX). Bafilomycin A1, monodansylcadaverine (MDC) and acridine orange were purchased from Sigma-Aldrich (St. Louis, MO). pcDNA and pcDNA-sirtus1 (SIRT1) were obtained from Addgene (Cambridge, MA). Lipofectamine 2000 was purchased from Invitrogen (Carlsbad, CA).
The HepG2 HCC cell lines were obtained from KCLB (Korean Cell Line Bank, Seoul, Korea). HepG2 cells were maintained in Dulbecco's modified Eagle's medium‒high glucose medium (Thermo Fisher Scientific, Carlsbad, CA). The medium was supplemented with 10% fetal bovine serum (GibcoBRL, Carlsbad, CA) and 1% antibiotics (Thermo Fisher Scientific) at 37°C in a humidified atmosphere with 5% CO2 in an incubator.
Cell proliferation was evaluated with a 2-(4-iodophenyl)-3-(4-nitrophenyl)-5-(2,4-disulfophenyl)-2H-tetrazolium (water soluble tetrazolium salt, WST-1) assay using the EZ-Cytox Cell Proliferation Assay kit (Itsbio, Seoul, Korea) according to the manufacturer’s instruction. Briefly, HepG2 cells were plated in 96-well plates and cultured overnight (1×10⁴ cells per well). The cells were treated with everolimus and Ku0063794 at different concentrations (100, 250, 500, 1,000, and 2,000 nM) for 24 hours, 48 hours, and 72 hours, respectively. The reagent provided in the EZ-Cytox Cell Proliferation Assay kit was then added to each well. Absorbance was measured at 450 nm using a microplate reader (model 680, Bio-Rad, Hercules, CA).
HepG2 cells and liver tissues were lysed using the EzRIPA Lysis kit (ATTO Corp., Tokyo, Japan), and quantified using Bradford reagent (Bio-Rad). Proteins were visualized by western analysis using incubations in the following primary antibodies (1:1,000 dilution) at 4°C overnight and in horseradish peroxidase (HRP)‒conjugated secondary antibodies (1:2,000 dilution) for 1 hour at 25°C. Primary antibodies included antibodies against p-mTORSer2448, p-p70S6K, LC3-phosphatidylethanolamine conjugate (LC3B), p62, B-cell lymphoma-extra large (Bcl-xL), cleaved poly(ADP-ribose) polymerase (c-PARP), cleaved caspase-3 (c-caspase 3), cleaved caspase-9 (c-caspase 9), myeloid cell leukemia-1 (Mcl-1), Bcl-2 like protein 11 (Bim), SIRT1, and β-actin (all from Cell Signaling Technology, Danvers, MA). The secondary antibodies were HRP-conjugated (Cell Signaling Technology). Specific immune complexes were detected using the Western Blotting Plus Chemiluminescence Reagent (Millipore, Bedford, MA). The Band Analysis tools of ImageLab software (Bio-Rad) were used to determine the density of the bands in all blots. β-Actin was used as normalization control.
HepG2 cells were cultured on Lab-Tek chamber slides (Thermo Fisher Scientific, Hemel Hempstead, UK) and were given an IRI conditioning with or without 100 nM everolimus for 5 hours. Subsequently, HepG2 cells were stained with either 1 μg/mL acridine orange or with 0.05 mM MDC at 37°C for 30 minutes, respectively. The autophagic vesicular organelles were observed using a confocal laser scanning microscope (LSM5 Live, Zeiss, Oberkochen, Germany).
Green fluorescent protein (GFP)-LC3 (Addgene) was transiently transfected into HepG2 cells with Lipofectamine 2000 transfection reagent (Invitrogen). The cells were then treated with and without 100 nM everolimus and 1 μM Ku0063794 for 24 hours and were observed using a confocal laser scanning microscope. To quantify autophagy, the number of cells with punctate GFP-LC3 was counted.
HepG2 cells were plated in 6-well plates (2×10⁵ cells/well) and transiently transfected with 1 μg pcDNA-SIRT1 (Addgene) per well mixed with the Lipofectamine 2000 transfection reagent, according to the manufacturer’s instructions. After incubation for 5 hours, the medium was changed to complete culture medium, and the cells were incubated at 37°C in a CO2 incubator for 48 hours before harvesting.
BALB/c nude mice (6-week-old) were used for comparative modeling of subcutaneous tumor growth. HepG2 cells (5×10⁶) were subcutaneously injected into each mouse. The mice were weighed twice a week. Fourteen days after tumor cell injection, all mice had measurable tumors. Mice were then randomly grouped (n=5 per group) and treated intraperitoneally with normal saline (control), everolimus (0.5 mg/kg in 100 μL normal saline, 3 times a week), Ku00-63794 (1 mg/kg in 100 μL in normal saline, 3 times a week), and a combination of both agents (0.5 mg/kg everolimus combined with 1 mg/kg Ku0063794 in 100 μL normal saline, 3 times a week) for 28 days. Tumor size was measured twice weekly via caliper, and tumor volume was calculated using the formula length×width2×0.5236 [20]. After the completion of treatment, all mice were euthanized.
For immunofluorescence and immunohistochemical analysis, formalin-fixed, paraffin-embedded tissue sections were deparaffinized, rehydrated in an ethanol series and subjected to epitope retrieval using standard procedures. Antibodies to c-caspase 3 and cytosolic LC3B were used for immunofluorescence, and antibodies to c-caspase 3 and SIRT1 were used for immunohistochemical stains. The samples were then examined under a laser-scanning microscope (Eclipse TE300, Nikon, Tokyo, Japan) to analyze the expression of c-caspase 3 and LC3B.
All data were analyzed using SPSS ver. 11.0 software (SPSS Inc., Chicago, IL) and are presented as the mean±standard deviation (SD). Statistical comparisons between the mean values of the two groups were performed using the Mann-Whitney U test. p-values of < 0.05 were considered statistically significant.
Fig. 1A shows the structures of everolimus and Ku0063794. We investigated the combined effects of everolimus and Ku0063794 on the proliferation of HepG2 cells (Fig. 1B). Combining both agents resulted in a significant reduction of HepG2 cell proliferation in both a dose- and time-dependent manner (p < 0.05). Fig. 1C shows the comparison of HepG2 cell proliferation at the concentrations of everolimus (100 nM) and Ku0063794 (1 μM) determined in this experiment.
We then investigated the effects of everolimus and Ku0063794, singly or in combination, on the expression of mTOR downstream molecules. Higher concentrations of singly administered everolimus and Ku0063794 tended to reduce the expression of p-mTOR and p-p70S6K (Fig. 2A and B). By contrast, combining both agents facilitated the synergistic mTOR-inhibiting capability, as demonstrated by stronger dose-dependent inhibition of p-mTOR and p-p70S6K (Fig. 2C). Fig. 2D represents the expression of mTOR downstream molecules at the concentrations of everolimus (100 nM) and Ku0063794 (1 μM) used in this experiment.
Next, we determined the expression of markers reflecting pro-apoptosis (c-PARP and c-caspase 3) and anti-apoptosis (Mcl-1) depending on mono- or combination regimens (Fig. 3A). Western blot analysis revealed that each monotherapy promoted the pro-apoptotic effect, as demonstrated by the elevation of c-PARP and c-caspase 3 and the reduction of Mcl-1. The combination therapy appeared to potentiate the pro-apoptotic effects of individual monotherapies, as demonstrated by the more prominent up- and down-regulation of these markers, mostly in a dose-dependent manner (p < 0.05). Fig. 3B represents the expression of the markers related to pro-apoptosis (c-PARP, c-caspase 9, c-caspase 3, and Bim) and anti-apoptosis (Bcl-xL and Mcl-1) at the concentrations of everolimus (100 nM) and Ku0063794 (1 μM) determined in this experiment.
Flow cytometric analysis also revealed that the number of annexin V‒positive cells (early and late apoptotic cells) was significantly higher in HepG2 cells treated with combination therapy compared to cells treated with the monotherapies (p < 0.05) (Fig. 2C).
Autophagy is a key mechanism that regulates cell survival or death [9,21,22]. Thus, to understand the basis of synergistic potentiation by combination therapy, we investigated the effects of each therapy on autophagy. Western blot analyses showed that everolimus or Ku0063794 monotherapies increased autophagy, as evidenced by the dose-dependent higher expression of LC3B and the lower expression of p62. However, paradoxically, combination therapy decreased autophagy, as evidenced by the lower expression of LC3B and the higher expression of p62 (p < 0.05) (Fig. 4A and B).
We further validated the effects of the individual therapies on autophagy in HepG2 cells using MDC staining, acridine orange staining, and GFP-LC3 puncta-formation assays (Fig. 3C). The results consistently showed that, although the individual monotherapies increased the formation of autophagic vacuoles (positive MDC, acridine orange staining, and GFP-LC3 puncta-positive cells), the combination therapy significantly decreased their formation, indicating a reduction in autophagy (p < 0.05).
To determine the role of autophagy, the expression of apoptosis-associated markers was investigated after pharmacological blockage of autophagy using bafilomycin A1 (Fig. 4D). Western blot analysis verified successful autophagic blockage by bafilomycin A1, as demonstrated by higher expression levels of LC3B and p63. Autophagic blockage directly promoted the pro-apoptotic effects of combination therapy, as demonstrated by the higher expression of pro-apoptotic proteins (c-PARP, c-caspase 3, and Bim) and the lower expression of anti-apoptotic proteins (Mcl-1 and Bcl-xL). These results suggest that combination therapy promoted the apoptosis of HCC cells by downregulating autophagy, the essential survival mechanism of HCC cells.
SIRT1 regulates a variety of physiological processes including autophagy, stress responses, metabolism, apoptosis, and aging [23]. We found that, although individual monotherapies failed to inhibit SIRT1 expression, the combined use of everolimus or Ku0063794 had the potential to inhibit SIRT1 expression (Fig. 5A). To determine the role of SIRT1 in relation with autophagy more precisely, we generated SIRT1-overexpressing HepG2 cells. Western blot analysis showed the successful generation of SIRT1-overexpressing HepG2 cells, which had been established by transfection with pcDNA-SIRT1 (Fig. 5B). We also found that transfection with pcDNA-SIRT1 promoted autophagy, as demonstrated by the higher expression of LC3B and the lower expression of p62.
Subsequently, we investigated the effects of SIRT1 overexpression on the autophagy-inhibiting and pro-apoptotic potentials of combination therapy (Fig. 5C). Overexpression of SIRT1 abrogated the autophagy-inhibiting potential of combination therapy, which was manifested by the higher expression of LC3B and the lower expression of p62. SIRT1 overexpression also abrogated the pro-apoptotic potential of combination therapy, which was manifested by lower expression of pro-apoptotic proteins (c-PARP, c-caspase-3, and Bim) and higher expression of Mcl-1. Taken altogether, we conclude that the combined use of everolimus and Ku0063794 suppressed autophagy and promoted the apoptosis of HepG2 cells by downregulating SIRT1 expression.
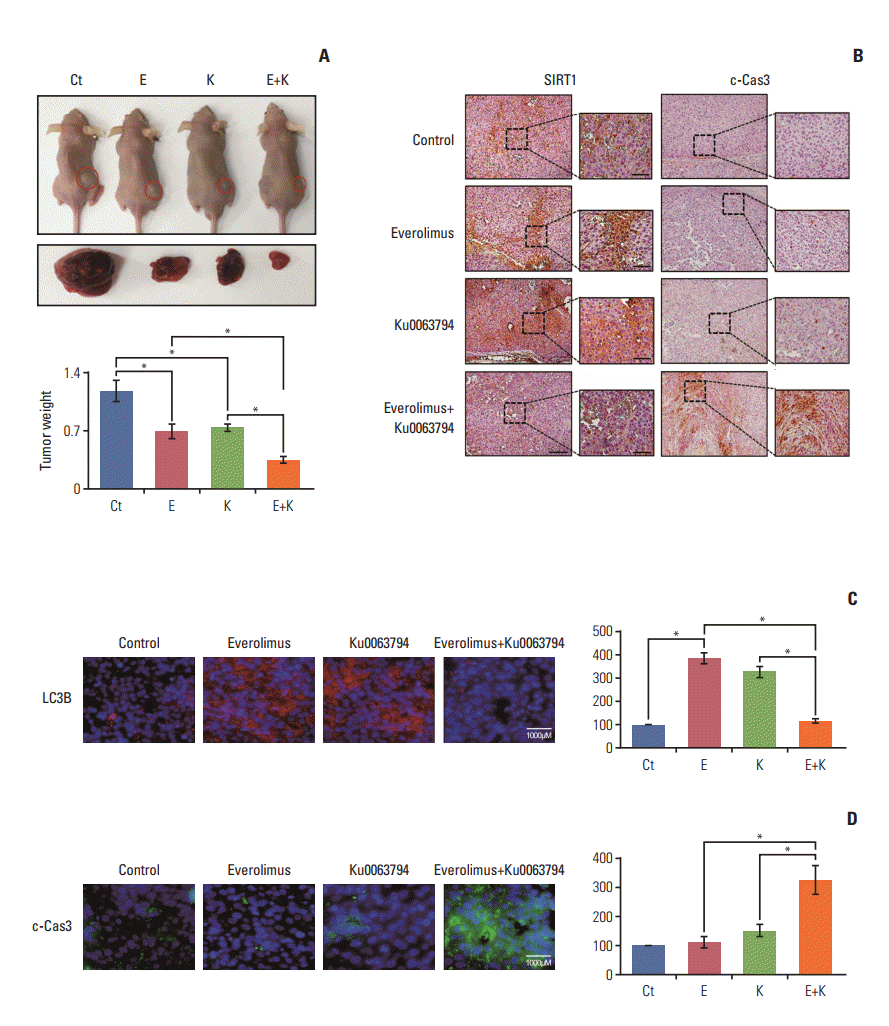
We examined the potential of everolimus and Ku0063794, individually or in combination, to inhibit the growth of HepG2 cells in the nude mouse tumor xenograft model. After everolimus (0.5 mg/kg/day) and Ku0063794 (1 mg/kg/day) had been administered intraperitoneally every day for 3 weeks, the mice were euthanized and the tumors were collected. Images of the tumors before and after necropsy showed that tumor shrinkage was more prominent in mice treated with combination therapy than in mice treated with individual monotherapies (Fig. 6A). In addition, there was a greater reduction in tumor weight in the mice treated with combination therapy than in those treated with individual monotherapies (p < 0.05).
Finally, we performed histological and molecular investigations of the tumor cell mass obtained from the xenograft model. Immunohistochemical staining of SIRT1 and c-caspase 3 revealed that the combination group exhibited a marked reduction in SIRT1 and an increase in c-caspase 3 (Fig. 6B). Subsequently, immunofluorescence of LC3B and c-caspase 3 revealed that combination therapy resulted in a significant reduction of LC3B and a significant increase in c-caspase 3 (p < 0.05) (Fig. 6C). Taken altogether, the data presented here demonstrated the pro-apoptotic, SIRT1-inhibiting, and autophagic inhibiting potentials of combination therapy in tumor tissues obtained from the xenograft model.
We previously reported that combined treatment with everolimus and Ku0063794 resulted in the synergistic enhancement of pro-apoptotic effect against HCC cells [8]. In this study, we identified the mechanism of this synergistic effect in relation to autophagy. We found that whereas individual monotherapies increased autophagy, the combined use of everolimus and Ku0063794 paradoxically decreased autophagy in HCC cells. Autophagic blockade directly promoted the pro-apoptotic effects of combination therapy, identifying autophagy as a survival mechanism in HCC cells. Furthermore, unlike monotherapies, combination therapy showed the potential to inhibit SIRT1, which is known to promote autophagy. Taken together, these data suggest that the combination of everolimus and Ku0063794 potentiates anticancer effects on HCCs through a decrease in autophagy, which is prompted by SIRT1 downregulation.
Autophagy induces cell survival or death, depending on the levels of cellular stress [21]. Our study showed that the reduction in autophagy following combination therapy led to an increase in apoptosis in HCC cells. Treating HepG2 cells with bafilomycin A1 (an autophagy inhibitor) potentiated the pro-apoptotic effects of combination therapy. This suggests that autophagy functions as a survival mechanism in the HCC cells used in our experiment. Thus, anti-HCC strategies would be directed towards greater autophagy inhibition, the pro-survival mechanism of cancer cells. A good example is a regimen used to treat colorectal cancer that combines oxaliplatin with an autophagy inhibitor, such as chloroquine or hydroxychloroquine [24,25]. In this regimen, the autophagy inhibitor potentiates the anticancer effects of oxaliplatin, possibly by inhibiting the pro-survival mechanism of autophagy. Likewise, our experiments revealed that the combined use of everolimus and Ku0063794 promoted anticancer effects against HCC cells by downregulating autophagy.
We found that combining everolimus and Ku0063794 decreased autophagy, as evidenced by the lower expression of LC3B and the higher expression of p62. Since mTOR signaling inhibits autophagy, mTOR inhibitors have proautophagic properties. The autophagy initiation step is mediated by ULK1 complex, which is composed of ULK1/ULK2, Atg13, and FIP200 [12,26]. mTOR signaling tightly regulates this ULK1 complex [10]. mTORC1 inhibits autophagy by direct phosphorylation of Atg13 and ULK1 at S757 under nutrient-rich conditions. However, nutrientdeficient conditions or an mTOR inhibitor can lead to a separation of mTOR and ULK1 complex, resulting in the dephosphorylation of Atg13 and ULK1. This again leads to dephosphorylation-mediated activation of ULK1 (and ULK2), and ULK1-mediated phosphorylation of Atg13, FIP200, and ULK1 itself, which elicits autophagy [27,28]. In keeping with the literature, our study showed that autophagy of HCC cells was promoted by everolimus or Ku00-63794 monotherapy. However, autophagy was decreased by combining both agents. To explain this phenomenon, we investigated the expression of SIRT1 which is known to be essential for the autophagic process.
In our study, combination therapy appeared to decrease autophagy by decreasing SIRT1, thereby promoting anticancer effects. A number of studies have validated that SIRT1 promotes autophagy [14,15]. Of them, Lee et al. [19] reported that SIRT1 formed molecular complexes with essential autophagy-related proteins, such as Atg5, Atg7, and Atg8, and thus promoted autophagy by deacetylating these proteins. In addition, the absence of SIRT1 caused autophagy impairment, followed by increased levels of SQSTM1/p62 and inhibition of autophagosome formation. Likewise, they also showed that, as with Atg5–/– mice, SIRT1–/– mice exhibited deficiencies in energy metabolism as well as the accumulation of damaged organelles. Their results suggest that SIRT1 promotes autophagy at the level of post-translational processing. In this study, we showed that, although individual monotherapies failed to inhibit SIRT1 expression, the combined use of everolimus or Ku0063794 had the potential of inhibiting SIRT1 expression. We also showed that combination therapy promoted the apoptosis of HCC cells by downregulating autophagy, the essential survival mechanism in HCC cells. Since the effect of SIRT1 on raising autophagy has been validated, we could conclude that combination therapy decreased autophagy by decreasing SIRT1, thereby promoting anticancer effects.
Interestingly, we found that combining both agents abrogated the SIRT1-promoting effects of individual monotherapies. It is known that mTOR signaling suppresses SIRT1 expression [29,30]. Back et al. [29] reported that cellular stress mTOR-dependently phosphorylated SIRT1 at serine 47, thereby inhibiting the deacetylase activity of SIRT1. They also showed that anticancer compounds, such as resveratrol or doxorubicin, mTOR-dependently inhibited SIRT1 deacetylase activity in tumor cells (human squamous cell carcinoma). However, the addition of an mTOR inhibitor (rapamycin) restored SIRT1 deacetylase activity in the presence of resveratrol, demonstrating the SIRT1-promoting effect of the mTOR inhibitor. Their results are in line with our study because we demonstrated that individual monotherapies or an mTOR inhibitor (everolimus or Ku0063794) promoted the expression of SIRT1 in HCC cells. However, combining both agents paradoxically decreased the expression of SIRT1, which needs to be further clarified.
In conclusion, we found that, unlike monotherapies, the combined use of everolimus and Ku0063794 decreased autophagy in HCC cells. In addition, unlike monotherapies, combination therapy showed the potential to inhibit SIRT1, the positive regulator of autophagy. The combination therapy thus promoted anticancer effects in HCCs by decreasing autophagy, which was prompted by SIRT1 downregulation. Therefore, when treating HCCs with everolimus, serious consideration must be given to combining it with Ku0063794 as a means of improving anticancer effects by inhibiting autophagy.
ACKNOWLEDGMENTS
We are grateful to Sang-Jin Jeon, Seong Su Won, Woo Joo Jeong, Jennifer Lee, and Nichole for their technical assistance.
References
1. Altekruse SF, McGlynn KA, Reichman ME. Hepatocellular carcinoma incidence, mortality, and survival trends in the United States from 1975 to 2005. J Clin Oncol. 2009; 27:1485–91.

3. Villanueva A, Chiang DY, Newell P, Peix J, Thung S, Alsinet C, et al. Pivotal role of mTOR signaling in hepatocellular carcinoma. Gastroenterology. 2008; 135:1972–83.

5. Sparks CA, Guertin DA. Targeting mTOR: prospects for mTOR complex 2 inhibitors in cancer therapy. Oncogene. 2010; 29:3733–44.

6. Yamanaka K, Petrulionis M, Lin S, Gao C, Galli U, Richter S, et al. Therapeutic potential and adverse events of everolimus for treatment of hepatocellular carcinoma: systematic review and meta-analysis. Cancer Med. 2013; 2:862–71.
7. Zhu AX, Abrams TA, Miksad R, Blaszkowsky LS, Meyerhardt JA, Zheng H, et al. Phase 1/2 study of everolimus in advanced hepatocellular carcinoma. Cancer. 2011; 117:5094–102.

8. Kim JO, Kim KH, Song IS, Cheon KS, Kim OH, Lee SC, et al. Potentiation of the anticancer effects of everolimus using a dual mTORC1/2 inhibitor in hepatocellular carcinoma cells. Oncotarget. 2017; 8:2936–48.

9. Hamacher-Brady A, Brady NR, Gottlieb RA. The interplay between pro-death and pro-survival signaling pathways in myocardial ischemia/reperfusion injury: apoptosis meets autophagy. Cardiovasc Drugs Ther. 2006; 20:445–62.

10. Ravikumar B, Sarkar S, Davies JE, Futter M, Garcia-Arencibia M, Green-Thompson ZW, et al. Regulation of mammalian autophagy in physiology and pathophysiology. Physiol Rev. 2010; 90:1383–435.

11. Codogno P, Mehrpour M, Proikas-Cezanne T. Canonical and non-canonical autophagy: variations on a common theme of self-eating? Nat Rev Mol Cell Biol. 2011; 13:7–12.

12. Kamada Y, Funakoshi T, Shintani T, Nagano K, Ohsumi M, Ohsumi Y. Tor-mediated induction of autophagy via an Apg1 protein kinase complex. J Cell Biol. 2000; 150:1507–13.

13. Mehrpour M, Esclatine A, Beau I, Codogno P. Autophagy in health and disease. 1. Regulation and significance of autophagy: an overview. Am J Physiol Cell Physiol. 2010; 298:C776–85.

14. Jeong JK, Moon MH, Lee YJ, Seol JW, Park SY. Autophagy induced by the class III histone deacetylase Sirt1 prevents prion peptide neurotoxicity. Neurobiol Aging. 2013; 34:146–56.

18. Fullgrabe J, Klionsky DJ, Joseph B. Histone post-translational modifications regulate autophagy flux and outcome. Autophagy. 2013; 9:1621–3.

19. Lee IH, Cao L, Mostoslavsky R, Lombard DB, Liu J, Bruns NE, et al. A role for the NAD-dependent deacetylase Sirt1 in the regulation of autophagy. Proc Natl Acad Sci U S A. 2008; 105:3374–9.

20. Bradshaw-Pierce EL, Pitts TM, Kulikowski G, Selby H, Merz AL, Gustafson DL, et al. Utilization of quantitative in vivo pharmacology approaches to assess combination effects of everolimus and irinotecan in mouse xenograft models of colorectal cancer. PLoS One. 2013; 8:e58089.

22. Tang B, Dong X, Wei Z, Qiao H, Jiang H, Liu B, et al. Enhanced autophagy by everolimus contributes to the antirestenotic mechanisms in vascular smooth muscle cells. J Vasc Res. 2014; 51:259–68.

23. Bordone L, Guarente L. Calorie restriction, SIRT1 and metabolism: understanding longevity. Nat Rev Mol Cell Biol. 2005; 6:298–305.

24. Ding ZB, Hui B, Shi YH, Zhou J, Peng YF, Gu CY, et al. Autophagy activation in hepatocellular carcinoma contributes to the tolerance of oxaliplatin via reactive oxygen species modulation. Clin Cancer Res. 2011; 17:6229–38.

25. Shimizu S, Takehara T, Hikita H, Kodama T, Tsunematsu H, Miyagi T, et al. Inhibition of autophagy potentiates the antitumor effect of the multikinase inhibitor sorafenib in hepatocellular carcinoma. Int J Cancer. 2012; 131:548–57.

26. Xie Z, Klionsky DJ. Autophagosome formation: core machinery and adaptations. Nat Cell Biol. 2007; 9:1102–9.

27. Ganley IG, Lam du H, Wang J, Ding X, Chen S, Jiang X. ULK1.ATG13.FIP200 complex mediates mTOR signaling and is essential for autophagy. J Biol Chem. 2009; 284:12297–305.

28. Hosokawa N, Hara T, Kaizuka T, Kishi C, Takamura A, Miura Y, et al. Nutrient-dependent mTORC1 association with the ULK1-Atg13-FIP200 complex required for autophagy. Mol Biol Cell. 2009; 20:1981–91.

Fig. 1.
Effects of everolimus and Ku0063794, either individually or in combination, on cell proliferation and on the expression of mTOR downstream molecules in HepG2 cells. (A) Chemical structures of everolimus and Ku0063794. (B) Combining everolimus with a graduated concentration of Ku0063794 resulted in a significant dose- and time-dependent decrease in HepG2 cell proliferation. (C) Comparison of HepG2 cell proliferation at the concentrations of everolimus (100 μM) and Ku0063794 (1 μM) used in this experiment after 24-hour (top) and 48-hour (bottom) treatments, respectively. Values represent mean±standard deviation of three independent experiments. *p < 0.05. mTOR, mammalian target of rapamycin; Ct, control; E, everolimus; K, Ku0063794.
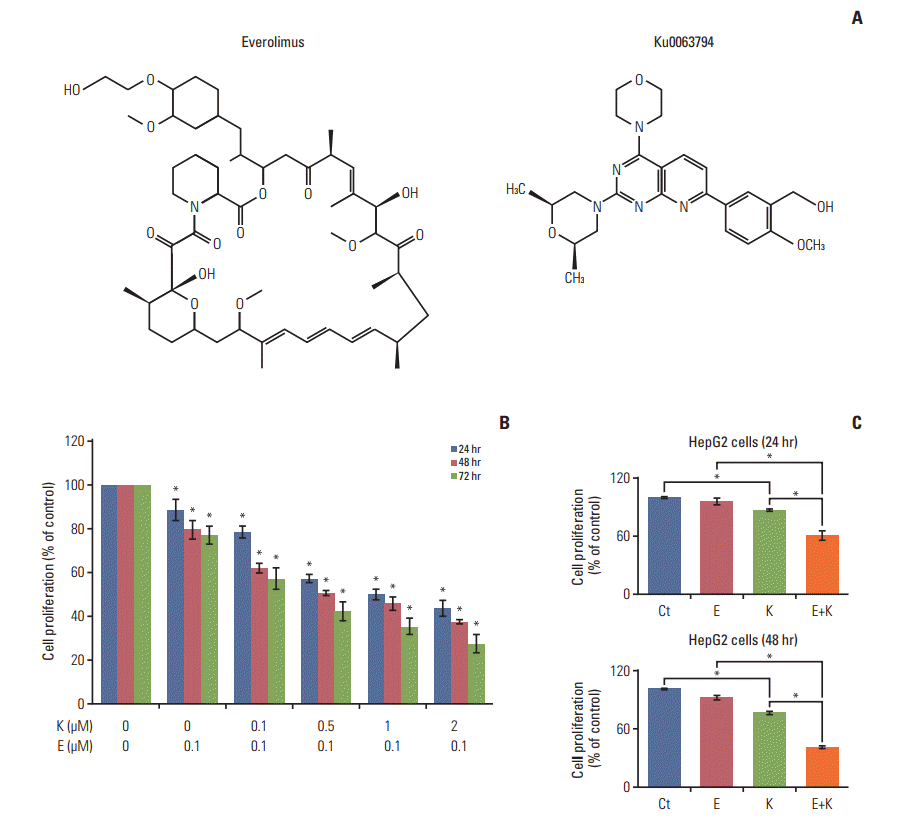
Fig. 2.
Effects of everolimus and Ku0063794, either individually or in combination, on the expression of mTOR downstream molecules in HepG2 cells. (A-C) Western blot analyses of the dose-dependent effects of everolimus (A) and Ku0063794 (B), and their combination (C) on the expression of mTOR downstream molecules. Higher concentrations of everolimus and Ku0063794 reduced the expression of p-mTOR and p-p70S6K. However, combining both agents resulted in a stronger dosedependent inhibition of p-mTOR and p-p70S6K. (D) Representative expression of mTOR downstream molecules at the concentrations of everolimus (100 nM) and Ku0063794 (1 μM) used in this experiment (left). Relative densities of these markers in each group (right). The Band Analysis tools of ImageLab software (Bio-Rad) were used to determine the density of the bands in all blots. β-Actin was used as a normalization control. Values represent mean±standard deviation of three independent experiments. *p < 0.05. mTOR, mammalian target of rapamycin.
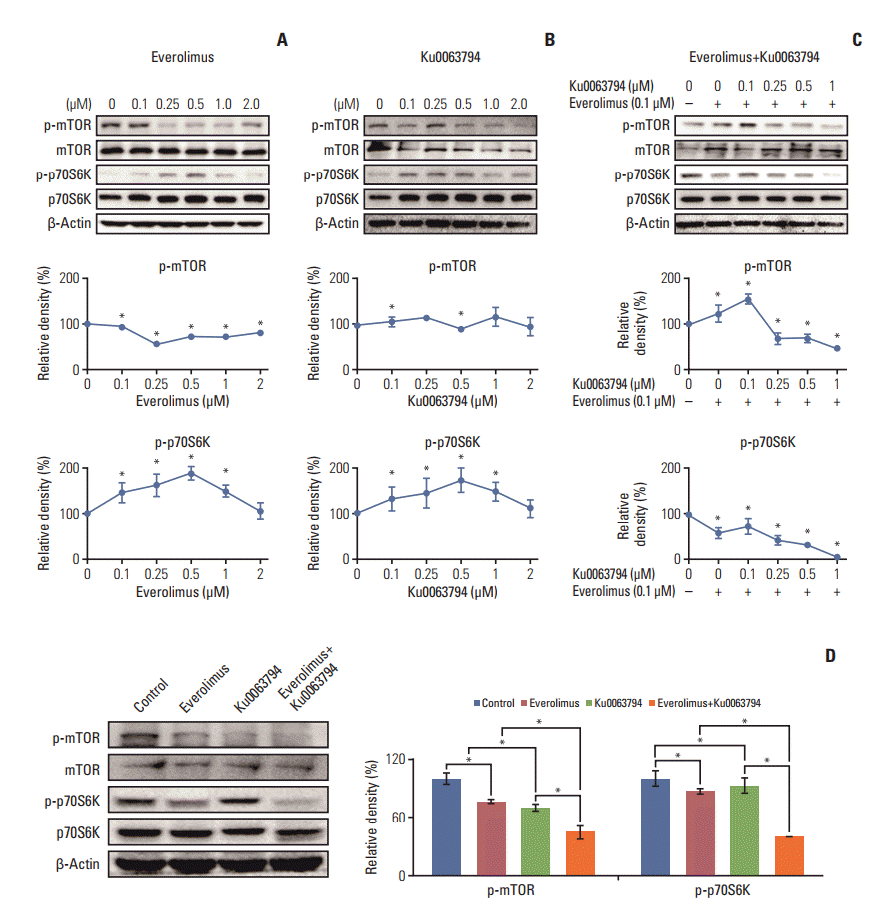
Fig. 3.
Effects of everolimus and Ku0063794, either individually or in combination, on apoptosis in HepG2 cells. (A) Western blot analyses showing the expression of markers reflecting apoptosis (c-PARP and c-Cas3) and anti-apoptosis (Mcl-1) depending on the treatment with everolimus (left) and Ku0063794 (middle), and their combination (right). Everolimus or Ku0063794 monotherapies increased the expression of c-PARP and c-Cas3, and reduced the expression of Mcl-1, mostly dose-dependently. The combination therapy appeared to potentiate the pro-apoptotic effects of individual monotherapies. ) (B) Representative expression of the markers related to pro-apoptosis (c-PARP, c-Cas9, c-Cas3, and Bim) and anti-apoptosis (Bcl-xL and Mcl-1) at the concentrations of everolimus (100 nM) and Ku0063794 (1 μM) used in this experiment. (C) Effects of everolimus and Ku0063794, either individually or in combination, on apoptosis using annexin V/PI staining and flow cytometry (top). Relative densities of these markers in each group (bottom). Apoptotic cells were expressed as the total percentage of annexin V–positive/PI-negative cells. The number of annexin V–positive cells (early and late apoptotic cells) was significantly higher in HepG2 cells treated with the combination compared to cells treated with the monotherapies. Band Analysis tools in ImageLab software (Bio-Rad) were used to determine the density of the bands in all blots. β-Actin was used as a normalization control. Values represent mean±standard deviation of three independent experiments. *p < 0.05. Bcl-xL, B-cell lymphoma-extra-large; Bim, Bcl-2-like protein 11; c-Cas, cleaved caspase; c-PARP, cleaved poly(ADP-ribose) polymerase; Ct, control; E, everolimus; K, Ku0063794; Mcl-1, myeloid cell leukemia-1; PI, propidium iodide.
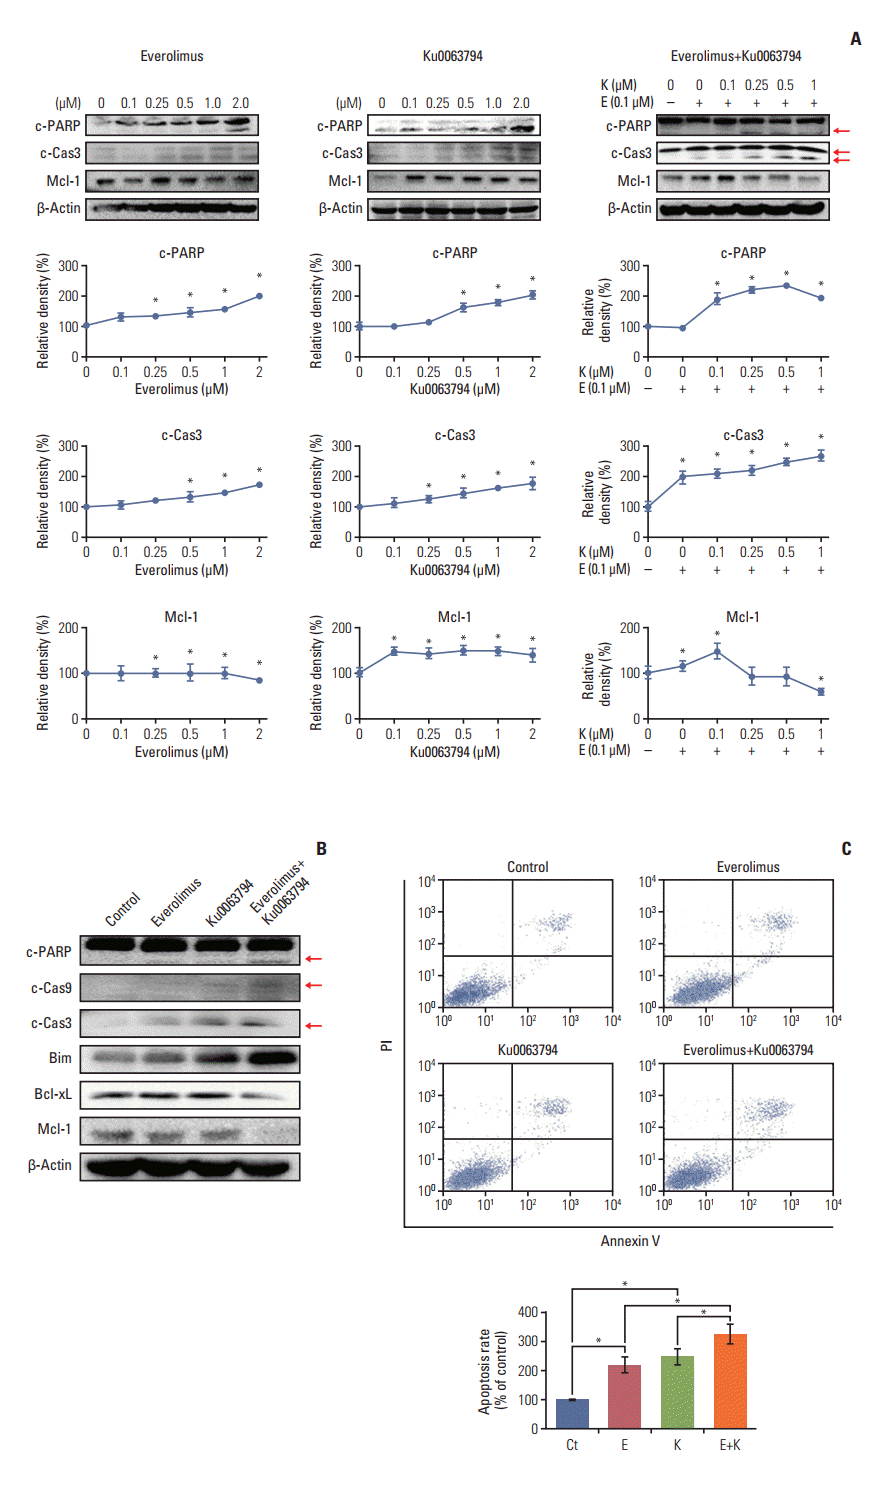
Fig. 4.
Effects of everolimus and Ku0063794, either individually or in combination, on autophagy in HepG2 cells. (A) Western blot analyses of the dose-dependent effects of everolimus (left), Ku0063794 (middle), and their combination (right) on the expression of autophagy markers (LC3B and p62). Whereas the everolimus and Ku0063794 monotherapies increased autophagy (higher expression of LC3B and lower expression of p62), the combination of both agents paradoxically decreased autophagy (lower expression of LC3B and higher expression of p62). An arrow indicates the band for LC3B form-II, and autophagosome marker. (B) Representative expression of autophagy markers at the concentrations of everolimus (100 nM) and Ku0063794 (1 μM) used in this experiment. Note the paradoxical reduction in autophagy (lower expression of LC3B and higher expression of p62) in the combination group. (C) Autophagy studies demonstrating autophagy levels according to treatment with everolimus and Ku0063794, either individually or in combination. To precisely quantify the levels of autophagy in each group, we performed immunofluorescence combined with flow cytometry with MDC (left), quantitative analysis of autophagy using acridine orange staining and flow cytometry (middle), and GFP-LC3 puncta staining (right) of HepG2 cells in each group. The levels of autophagy correlate with numbers of MDC-positive cells, acridine orange-positive cells, and LC3B punta-positive cells. Relative densities of these markers in each group (bottom) (magnification, ×600). The autophagy studies consistently indicated that, unlike the individual monotherapies, combination therapy significantly decreased the levels of autophagy. (D) Western blot analysis showing the effects of autophagy suppression by bafilomycin A1 on the expression of autophagy (LC3B and p62), pro-apoptosis (c-PARP, c-Cas3, and Bim), and anti-apoptosis (Mcl-1 and Bcl-xL) markers (left). Relative densities of these markers in each group (right). Successful autophagy inhibition by Baf A1 was demonstrated by the higher expression of both LC3B and p63. Autophagy inhibition promoted the pro-apoptotic effects of combination therapy, as demonstrated by the higher expression of pro-apoptotic markers and by the lower expression of anti-apoptotic markers. Arrows indicate the bands for the cleaved forms of PARP and caspase 3, respectively. The Band Analysis tools of ImageLab software (Bio-Rad) were used to determine the density of the bands in all blots. β-Actin was used as normalization control. Values represent mean±standard deviation of three independent experiments. *p < 0.05. Baf A1, bafilomycin A1; Bcl-xL, B-cell lymphoma-extra-large; Bim, Bcl-2 like protein 11; c-Cas3, cleaved caspase 3; c-PARP, cleaved poly(ADP-ribose) polymerase; Ct, control group; DMSO, dimethyl sulfoxide; E, everolimus; K, Ku0063794; LC3B, LC3-phosphatidylethanolamine conjugate; Mcl-1, myeloid cell leukemia-1; MDC, monodansylcadaverine.
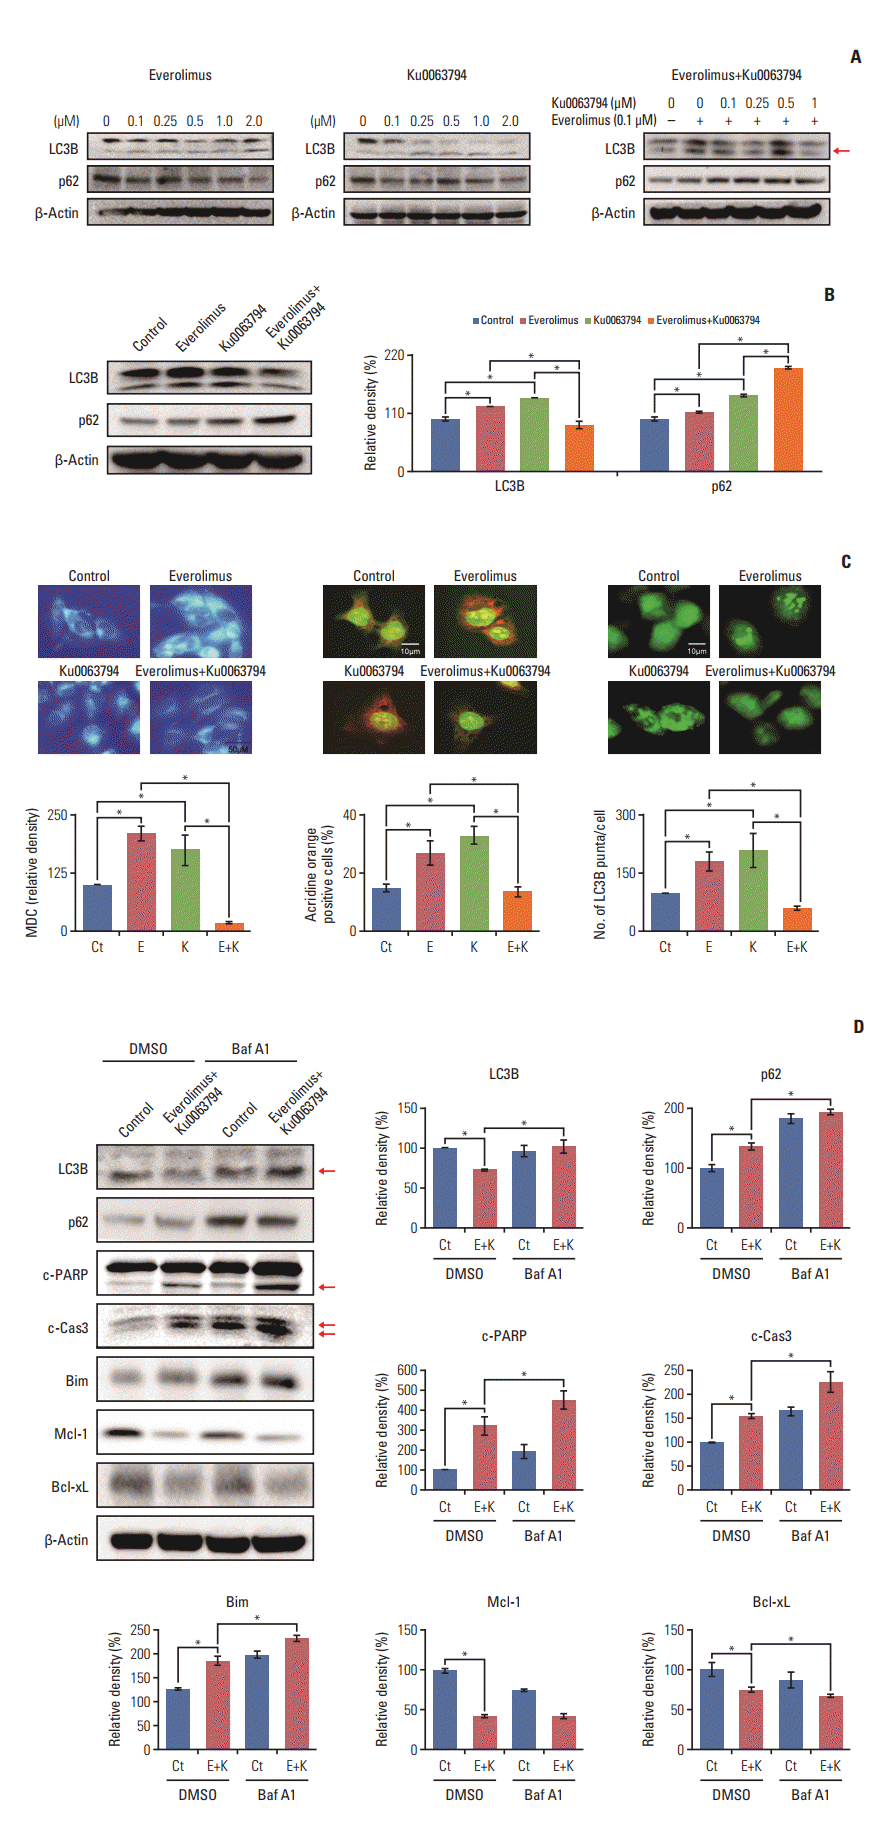
Fig. 5.
Determination of the role of SIRT-1 during autophagy of HepG2 cells. (A) Western blot analyses showing the effects of everolimus and Ku0063794, either individually or in combination, on the expression of SIRT1 (left). Relative densities of these markers in each group (right). Unlike the monotherapies, combination therapy significantly inhibited the expression of SIRT1. (B) Identification of successful transfection of pcDNA-SIRT1 into HepG2 cells as detected by Western blot analysis. Successful integration was identified by the higher expression of SIRT1. Transfection with pcDNA-SIRT1 promoted autophagy, as demonstrated by higher expression of LC3B and lower expression of p62. (C) SIRT1 overexpression assay to evaluate whether combination therapy increases HCC cell apoptosis by decreasing SIRT1 (left). Relative densities of these markers in each group (right). Overexpression of SIRT1 abrogated both autophagy-inhibiting and pro-apoptotic effects of combination therapy, which was manifested by higher expression of LC3B and lower expression of p62, and lower expression of pro-apoptotic markers (c-PARP, c-Cas3, and Bim) and higher expression of Mcl-1. These data suggest that combination therapy promotes apoptosis of HepG2 cells by downregulating SIRT1 expression. The Band Analysis tools of ImageLab software (Bio-Rad) were used to determine the density of the bands in all blots. β-Actin was used as normalization control. Values represent mean±standard deviation of three independent experiments. *p < 0.05. Ct, control group; Bim, Bcl-2 like protein 11; c-Cas3, cleaved caspase 3; c-PARP, cleaved poly(ADP-ribose) polymerase; E, everolimus; K, Ku0063794; LC3B, LC3-phosphatidylethanolamine conjugate; Mcl1, myeloid cell leukemia-1; SIRT1, sirtuin 1.
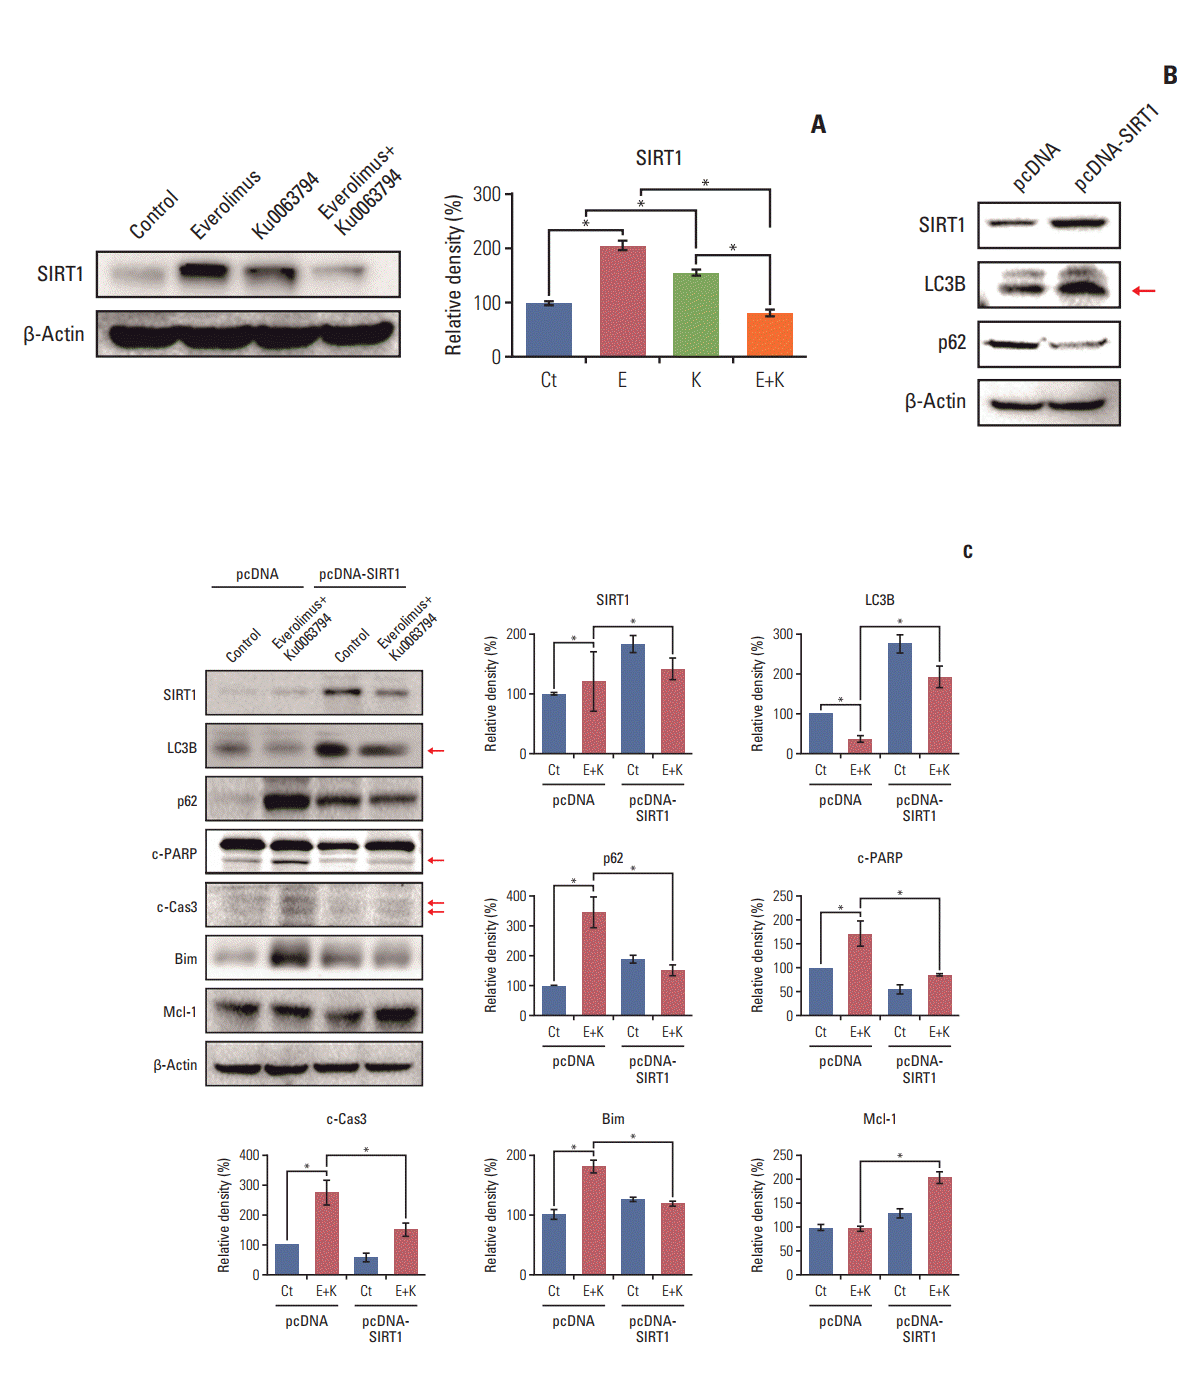
Fig. 6.
Validation of everolimus and Ku0063794 anticancer effects, either individually or in combination, in a nude mouse xenograft model. After everolimus (0.5 mg/kg/day) and Ku0063794 (1 mg/kg/day) were administered orally every day for 3 weeks, mice were euthanized and tumors were collected. (A) Morphological images and final tumor weights in the xenograft tumor model using HepG2 cells according to treatment with everolimus and Ku0063794, either individually or in combination. Tumor reduction was more pronounced in mice treated with combination therapy than in mice treated with the respective monotherapies (top). Final tumor weight at 3 weeks (bottom). Tumor weight was markedly reduced in the mice treated with combination therapy compared with the mice treated with individual monotherapies (p < 0.05). (B) The representative SIRT1 and c-Cas3 immunohistochemical stains of the tumor cell mass obtained from the xenograft model at 3 weeks. The combination group exhibited lower expression of SIRT1 and higher expression of c-Cas3. (C, D) The representative LC3B and c-Cas3 immunofluorescences of the tumor cell mass obtained from the xenograft model at 3 weeks. The combination group resulted in the significant reduction of LC3B and the significant increase of c-Cas3. Values represent mean±standard deviation of three independent experiments. *p < 0.05. c-Cas3, cleaved caspase 3; Ct, control; E, everolimus; K, Ku0063794; LC3B, LC3-phosphatidylethanolamine conjugate; SIRT1, sirtuin 1.


 PDF
PDF Citation
 Print
Print


 XML Download