Journal List > Cancer Res Treat > v.50(2) > 1153540

Lv, Huang, Chen, Zhou, Tang, Mao, Li, Lin, Ma, and Sun: A National Study of Survival Trends and Conditional Survival in Nasopharyngeal Carcinoma: Analysis of the National Population-Based Surveillance Epidemiology and End Results Registry

Abstract

Purpose

Conditional survival (CS) provides important information on survival for a period of time after diagnosis. Currently, information on CS patterns of patients with nasopharyngeal carcinoma (NPC) is lacking. We aimed to analyze survival rate over time and estimate CS for NPC patients using a national population-based registry.

Materials and Methods

Patients diagnosed with NPC between 1973 and 2007 with at least 5-year follow-up were identified from the Surveillance Epidemiology End Results registry. Traditional survival rates and crude CS estimateswere calculated using Kaplan-Meier analysis. Risk-adjusted survival curves were plotted from the proportional hazards model using the correct group prognosis method.

Results

registry. Traditional survival rates and crude CS estimateswere calculated using Kaplan-Meier analysis. Risk-adjusted survival curves were plotted from the proportional hazards model using the correct group prognosis method.

Results

For 7,713 patients analyzed, adjusted baseline 5-year overall survival improved significantly from 36.0% in patients diagnosed in 1973-1979, 41.7% in 1980-1989, 46.6% in 1990-1999, to 54.7% in 2000-2007 (p < 0.01). CS analysis demonstrated that for every additional year survived, adjusted probability of surviving the next 5 years increased from 66.7% (localized), 54.0% (regional), and 35.3% (distant) at the time of diagnosis, to 83.7% (localized), 75.0% (regional), and 62.2% (distant) for patients who had survived 5 years. Adjusted 5-year CS differed among age, sex, tumor histology, ethnicity, and stage subgroups initially, but converged with time.

Conclusion

Treatment outcomes of NPC patients have greatly improved over the decades. Increases in CS become more prominent in patients with distant disease than in those with localized or regional disease as patients survive longer. CS provides more dynamic prognostic information for patients who have survived a period of time after diagnosis.

Introduction

Nasopharyngeal carcinoma (NPC) is a unique head and neck cancer with a skewed racial and geographical distribution worldwide [1]. The age-standardized incidence rates range from 20 to 50 per 100,000 males in southern China to 0.5 per 100,000 in Caucasian populations [2,3]. The last two decades have witnessed great improvements in overall survival (OS) and progression-free survival in NPC, which can be attributed to the introduction of new technologies—such as intensity-modulated radiation therapy (IMRT)—as well as concurrent chemoradiotherapy (CCRT) and induction chemotherapy (IC) [4-6].
Five-year OS is commonly used to estimate the long-term prognosis of patients with NPC, and is usually measured from the time of diagnosis. However, the survival probabilities of patients who have survived for some time after treatment are not static. This is of major importance, as patients who have survived for a certain period after being diagnosed with NPC are often interested in their updated prognosis. Such dynamic prognostic information is valuable, as it can assist patients making important life-changing decisions, especially those whose initial prognosis was poor—for example, patients with locoregionally-advanced or metastatic NPC. In addition, such data could help healthcare providers (HCPs) to counsel patients and tailor subsequent surveillance and management strategies [7].
Conditional survival (CS), which is calculated after a given duration of survival using data for only individuals who have survived to that predefined time of interest, may represent the best tool to assess dynamic changes in prognosis [8]. Recently, various studies on CS patterns for different tumor types, such as melanoma, lung, gastric, and colon cancer, have provided important prognostic information for patients and HCPs [9-11]. Fuller et al. [12] reported an analysis of the CS patterns for all head and neck squamous cell carcinomas (HNSCCs), utilizing a cohort of patients from the Surveillance, Epidemiology, and End Results (SEER) registry diagnosed between 1973 and 1998. However, these patients were not treated using the modern treatment techniques currently available. Given the unique biological behavior, treatment patterns, and mode of failure of NPC [13], as well as the application of modern techniques such as IMRT and CCRT [14], up-to-date data on the patterns of CS for NPC are required.
In this study, we determined contemporary survival trends for NPC and CS patterns for surviving patients utilizing the updated population-based SEER registry (1973-2012). The aims of this study were to understand how survival changes over time and provide a general overview of the CS patterns for patients with NPC.

Materials and Methods

1. Data source, diagnostic codes, and study population

Data from the NCI SEER 17 program released in 2015 were obtained. The SEER collects cancer incidence and survival data from 18 regional population-based registries, which represent approximately 28% of the U.S. population [15].
The SEER registry routinely collects data on demographics, primary tumor site, tumor morphology, disease stage at diagnosis, first course of treatment, and vital status at last contact. Tumor site and histology were grouped according to the International Classification of Diseases for Oncology, third edition (ICD-O-3). All NPC cases (SEER site code 20060) were divided into four groups: keratinizing squamous cell carcinoma (ICD-O codes 8070 and 8071), differentiated non-keratinizing carcinoma (ICD-O codes 8072 and 8073), undifferentiated non-keratinizing carcinoma (ICD-O codes 8020, 8021, and 8082) and others (carcinoma not otherwise specified [NOS]; ICD-O code 8010) [16]. Staging was grouped into four broad categories according to the SEER historical staging classification: localized, regional, distant disease, and NOS. Localized disease was defined as an invasive neoplasm confined entirely to the organ of origin. Regional disease was defined as a neoplasm that has extended beyond the limits of the organ of origin directly into surrounding organs or tissues; into regional lymph nodes via the lymphatic system; or by a combination of extension and regional lymph nodes. Distant disease was defined as a neoplasm that has spread to parts of the body remote from the primary tumor by either direct extension or discontinuous metastasis to distant organs, tissues, or via the lymphatic system to distant lymph nodes. The seventh edition of the American Joint Committee on Cancer (AJCC)/Union for International Cancer Control staging for NPC was recorded from 2007 onwards in the SEER database, thus was not applicable to this study. Race was classified as White, Black, Chinese, or others. Treatment was classified as the use of radiation or not, as the use of chemotherapy was not recorded in the SEER database [17].
The patients included in the current study fulfilled the following criteria: (1) patients with invasive, malignant NPC diagnosed between 1973 and 2007; 2007 was selected as the final date to allow for a minimum of 5-year follow-up; (2) patients with complete data on age at diagnosis, sex, race, tumor histology, and SEER historical staging. Exclusion criteria are as follows: (1) in situdisease; (2) not the first or only occurrence of malignant disease; (3) reporting source was a nursing home, hospice, autopsy, or death certificate only.

2. Statistical analysis

Initially, we stratified the cohort by decade based on the year of diagnosis. Cox proportional hazards model was employed to calculate baseline adjusted OS and disease-specific survival (DSS), age, sex, histology, race, tumor extension, and use of radiation were included for adjustment. Survival curves were compared using the log-rank test. Hazard ratios in both univariate and multivariate were estimated for the crude and adjusted 5-year baseline OS rates, respectively.
Secondly, crude CS estimates were calculated using a previously described methodology [10]: CS(y|x), is the probability of surviving an additional y years, given that the patient has already survived x years. S(t) defines as the traditional actuarial life-table survival at time t. CS can be expressed as:
CS(yx)=S(x+y)/S(x).
For example, to calculate 5-year CS for a patient who has already survived 3 years, the survival rate at 5+3 years, S(8), is divided by the survival at 3 years, S(3).
Thirdly, to further evaluate the simultaneous effects of covariates on CS, covariate-adjusted survival rates were calculated from the proportional hazards model using the correct group prognosis method [18,19]. Covariates adjusted for in the prediction model were based on clinically relevant factors, including age (≤ 45 years vs. > 45 years); sex (male vs. female); race (White vs. Black vs. Chinese vs. other); histology (keratinizing squamous cell carcinoma vs. differentiated non-keratinizing carcinoma vs. undifferentiated non-keratinizing carcinoma vs. NOS); and SEER historical staging (localized vs. regional vs. metastasis vs. NOS). To further improve the reliability of the predictive model, we tested the additional inclusion of the following variables: year of diagnosis (1973-1979 vs. 1980-1989 vs. 1990-1999 vs. 2000-2007) and the use of radiation (‘yes’ vs. ‘no’ vs. ‘NOS’). The proportional hazards assumption was verified graphically on the basis of Schoenfeld residuals [20,21].
The primary endpoint was OS, defined as the time from the start of treatment to death from any cause. The secondary endpoint was DSS, defined as the time to death from NPC. Rates of change for CS were examined using Prism ver. 5.02 (GraphPad Software, La Jolla, CA). Statistical analyses were performed using SPSS ver. 19.0 software (IBM Corp., Armonk, NY) or STATA ver. 12.0 (Stata Corp., College Station, TX). All tests were two-sided with statistical significance set at p < 0.05.

Results

1. Patient characteristics and outcome improvements over the decades

A total of 7,713 patients with NPC diagnosed between 1973 and 2007 with at least 5-years follow-up were included in the final analysis; the baseline characteristics of the patients are detailed in Table 1. Median follow-up duration for the whole cohort was 62 months (range, 2.3 to 475 months). Overall, 5,202 of the 7,713 patients (67.5%) died from any cause and 3,719 of the 7,713 patients (48.2%) experienced disease-specific death during follow-up. For the entire cohort, 5-year OS and DSS were 51.0% and 57.8% respectively.
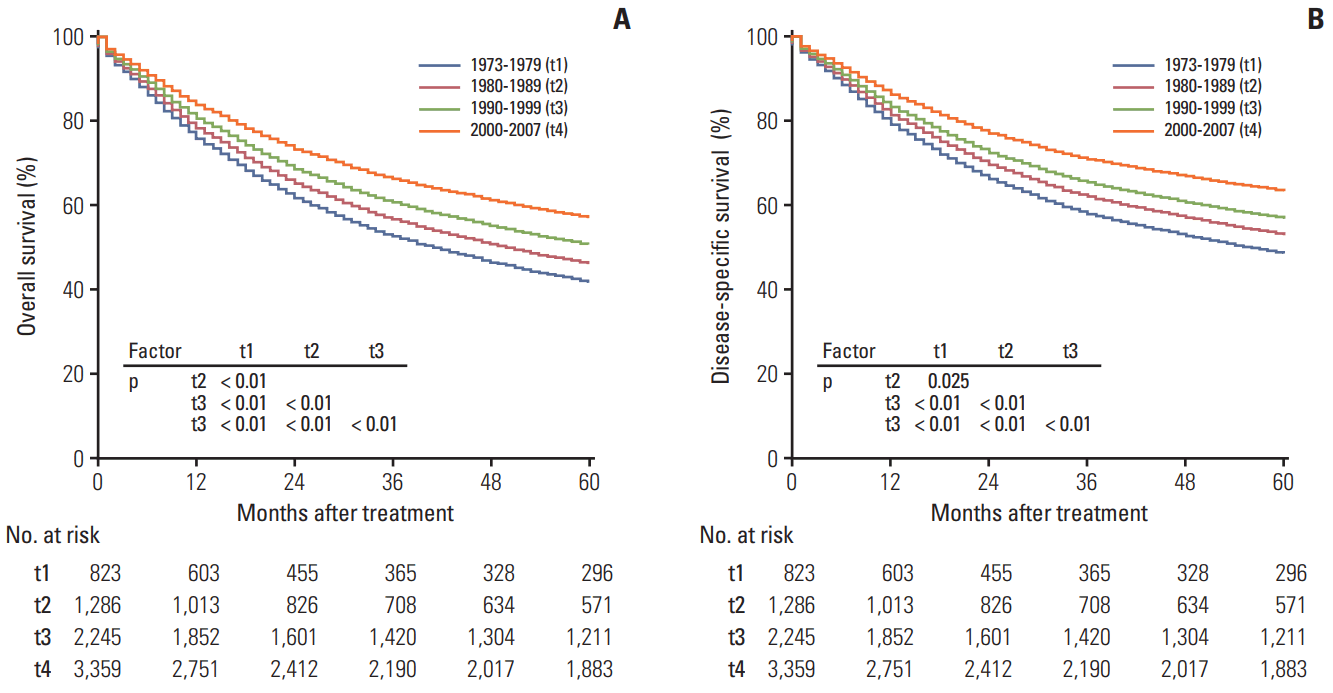
The adjusted baseline 5-year survival rates for patients with NPC at diagnosis improved over the decades, as shown in Fig. 1. Age, sex, histology, race, stage and use of radiation were included as covariates. Adjusted 5-year OS improved significantly from 36.0% in 1973-1979, 41.7% in 1980-1989, 46.6% in 1990-1999, to 54.7% in 2000-2007 (p < 0.01). Adjusted 5-year DSS showed a similar trend, improving from 41.8% in 1973-1979, 46.1% in 1980-1989, 50.8% in 1990-1999, to 57.2% in 2000-2007 (p < 0.05).

2. Crude CS and covariate-adjusted CS patterns in NPC

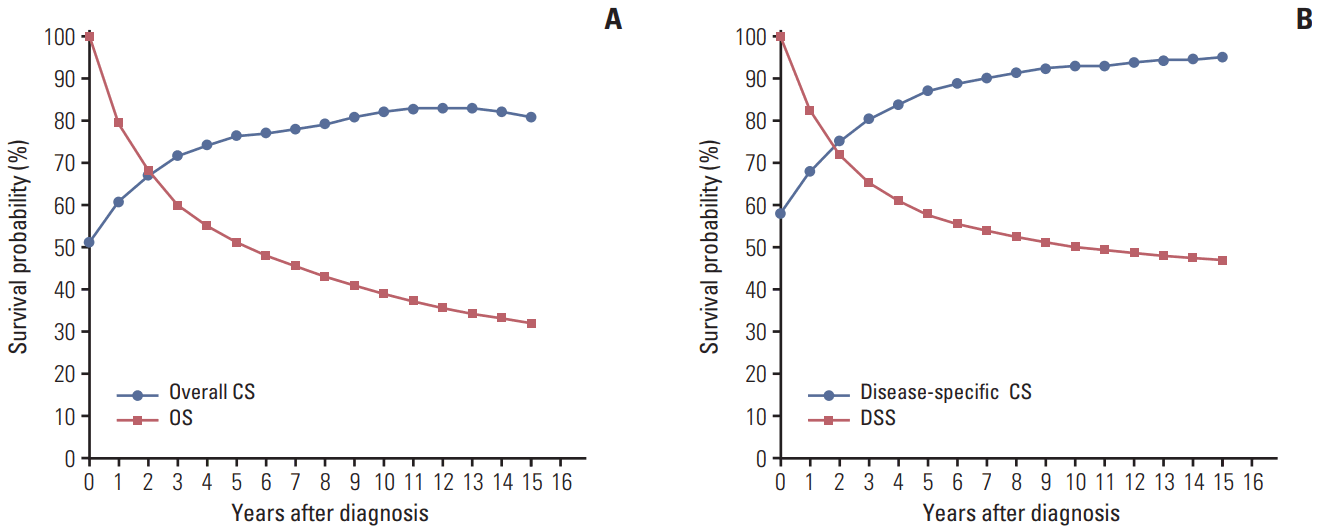
Fig. 2 presents the 5-year crude overall CS and disease-specific CS rates for patients with NPC. Although the initial OS rate was only 50.1%, there was a steady improvement in CS as time elapsed from diagnosis (p△slope, trend < 0.001), which plateaued at the ninth conditional year, with an OS rate of nearly 82% for long-term NPC survivors. Five-year disease-specific CS exhibited a similar pattern.
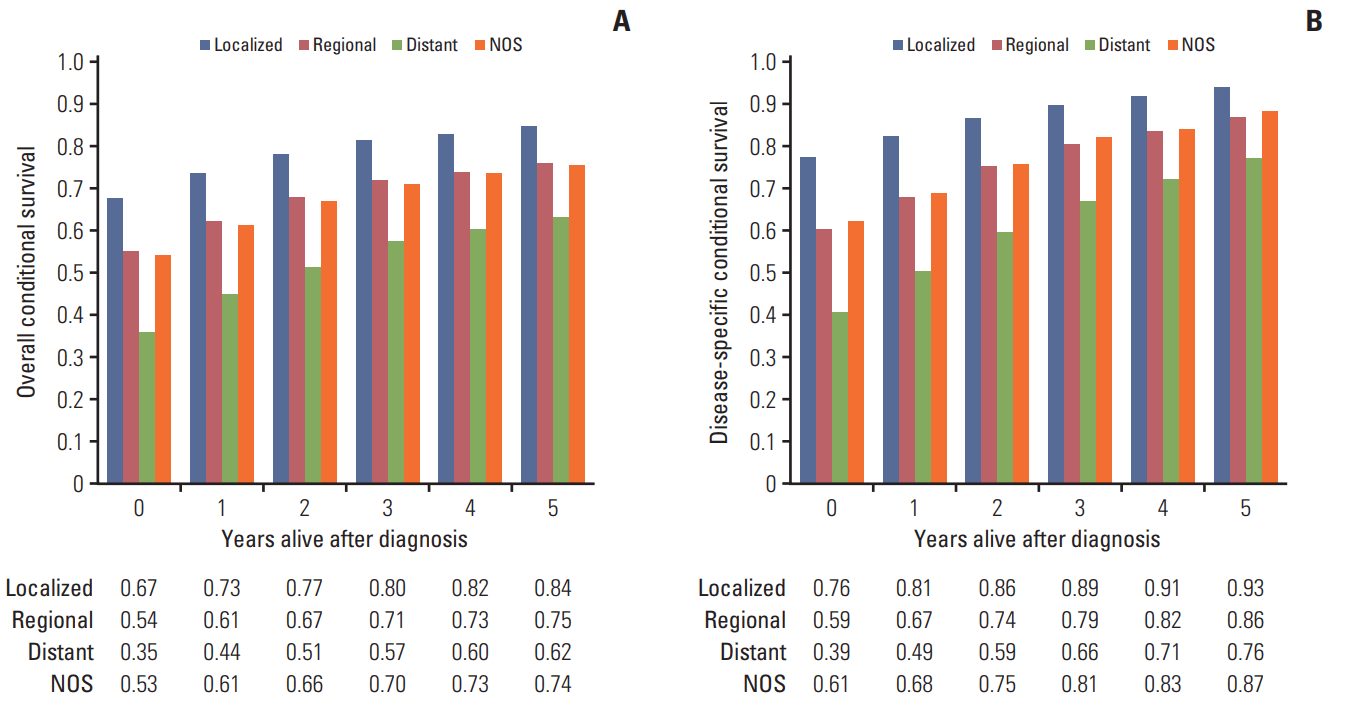
The extent of disease at diagnosis is a strong determinant of prognosis. Fig. 3A demonstrates the adjusted 5-year overall CS rates for patients with NPC stratified by tumor extension, age, sex, histology, race, year of diagnosis, and use of radiation. There was a relatively small gain in survival with each additional year survived for localized NPC, in which the probability of surviving the next 5 years increased from 66.7% at the time of diagnosis to 83.7% for patients who had survived 5 years. It was worth noting that the adjusted 5-year disease-specific death for localized NPC, which decreased to 11.3% at the third conditional year, equalized other cause of death (calculated as OS status minus DSS status, the data was not shown here) at the time point of third year. A much greater increase in survival was observed for patients with distant disease, as the CS rate increased from 35.3% initially to 62.2% by the fifth conditional year. However, only 522 of the 1,568 patients (33.3%) with distant disease survived for at least 5 years. The adjusted 5-year disease-specific CS rate followed the same pattern. Notably, for localized disease, the adjusted 5-year disease-specific CS became equal to other causes of death (defined as deaths not attributed to NPC) in the third conditional year (Fig. 3B).
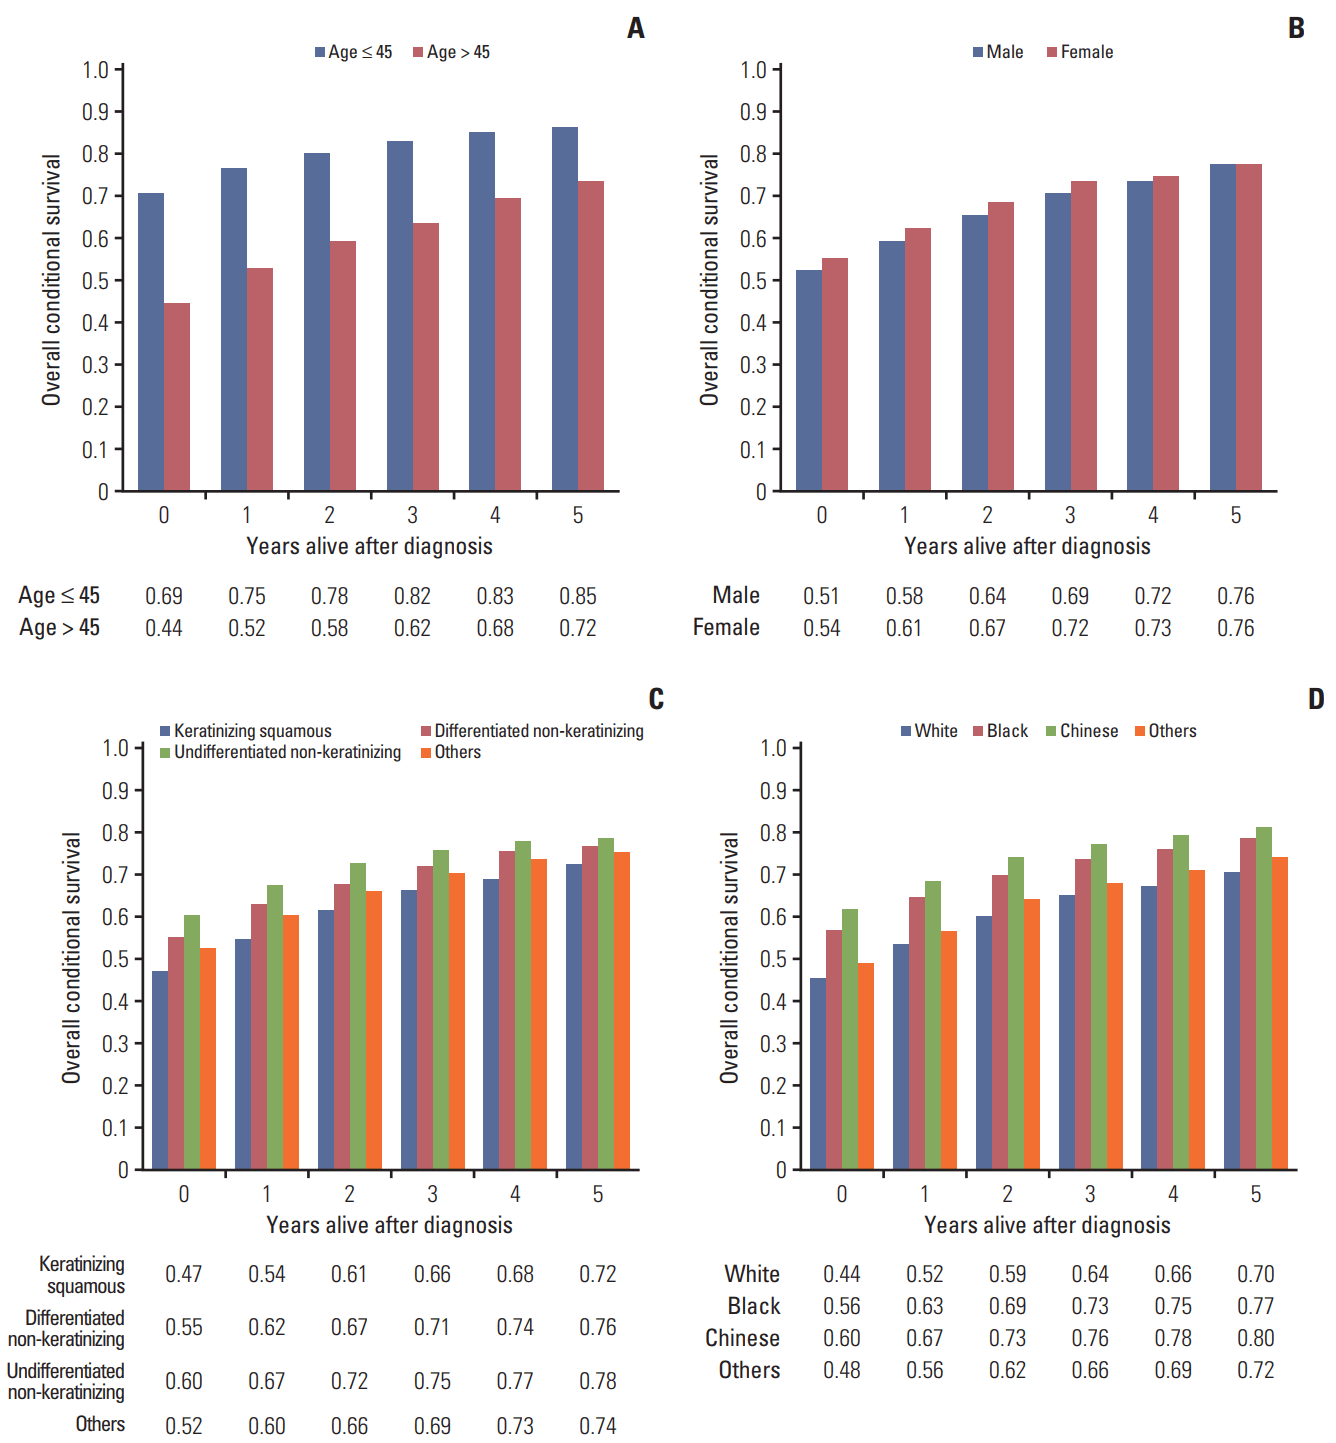
To further evaluate the individual contribution of other patient and tumor characteristics to CS, adjusted 5-year overall CS was also calculated in subgroup analysis of age, sex, histology, and race, with other clinically relevant variables included for adjustment. Adjusted 5-year overall CS for the two age groups was shown in Fig. 4A, after adjustment for sex, histology, race, tumor extension, year of diagnosis, and use of radiation. In all age groups, the survival probability increased with every successive year survived, with younger patients achieving better survival. However, these age-related differences generally diminished over time, as the absolute differences in expected adjusted CS decreased from 25.2% at diagnosis to 13.4% by the fifth year after diagnosis.
Adjusted 5-year overall CS rates for patients with NPC stratified by sex were shown in Fig. 4B, adjusted for age, histology, race, tumor extension, year of diagnosis, and use of radiation. Females tended to have a better prognosis than males at diagnosis; however, survival rates generally leveled as patients survived for longer.
The adjusted 5-year overall CS rates for the major histologic subtypes were shown in Fig. 4C. Age, sex, race, tumor extension, year of diagnosis, and use of radiation were included for adjustment. CS increased steadily with years already survived for all histologic types. Patients with undifferentiated non-keratinizing carcinoma had the best prognosis, which increased from 59.8% at diagnosis to 78.2% at the fifth conditional year. However, the influence of histology on CS decreased as patients survived longer.
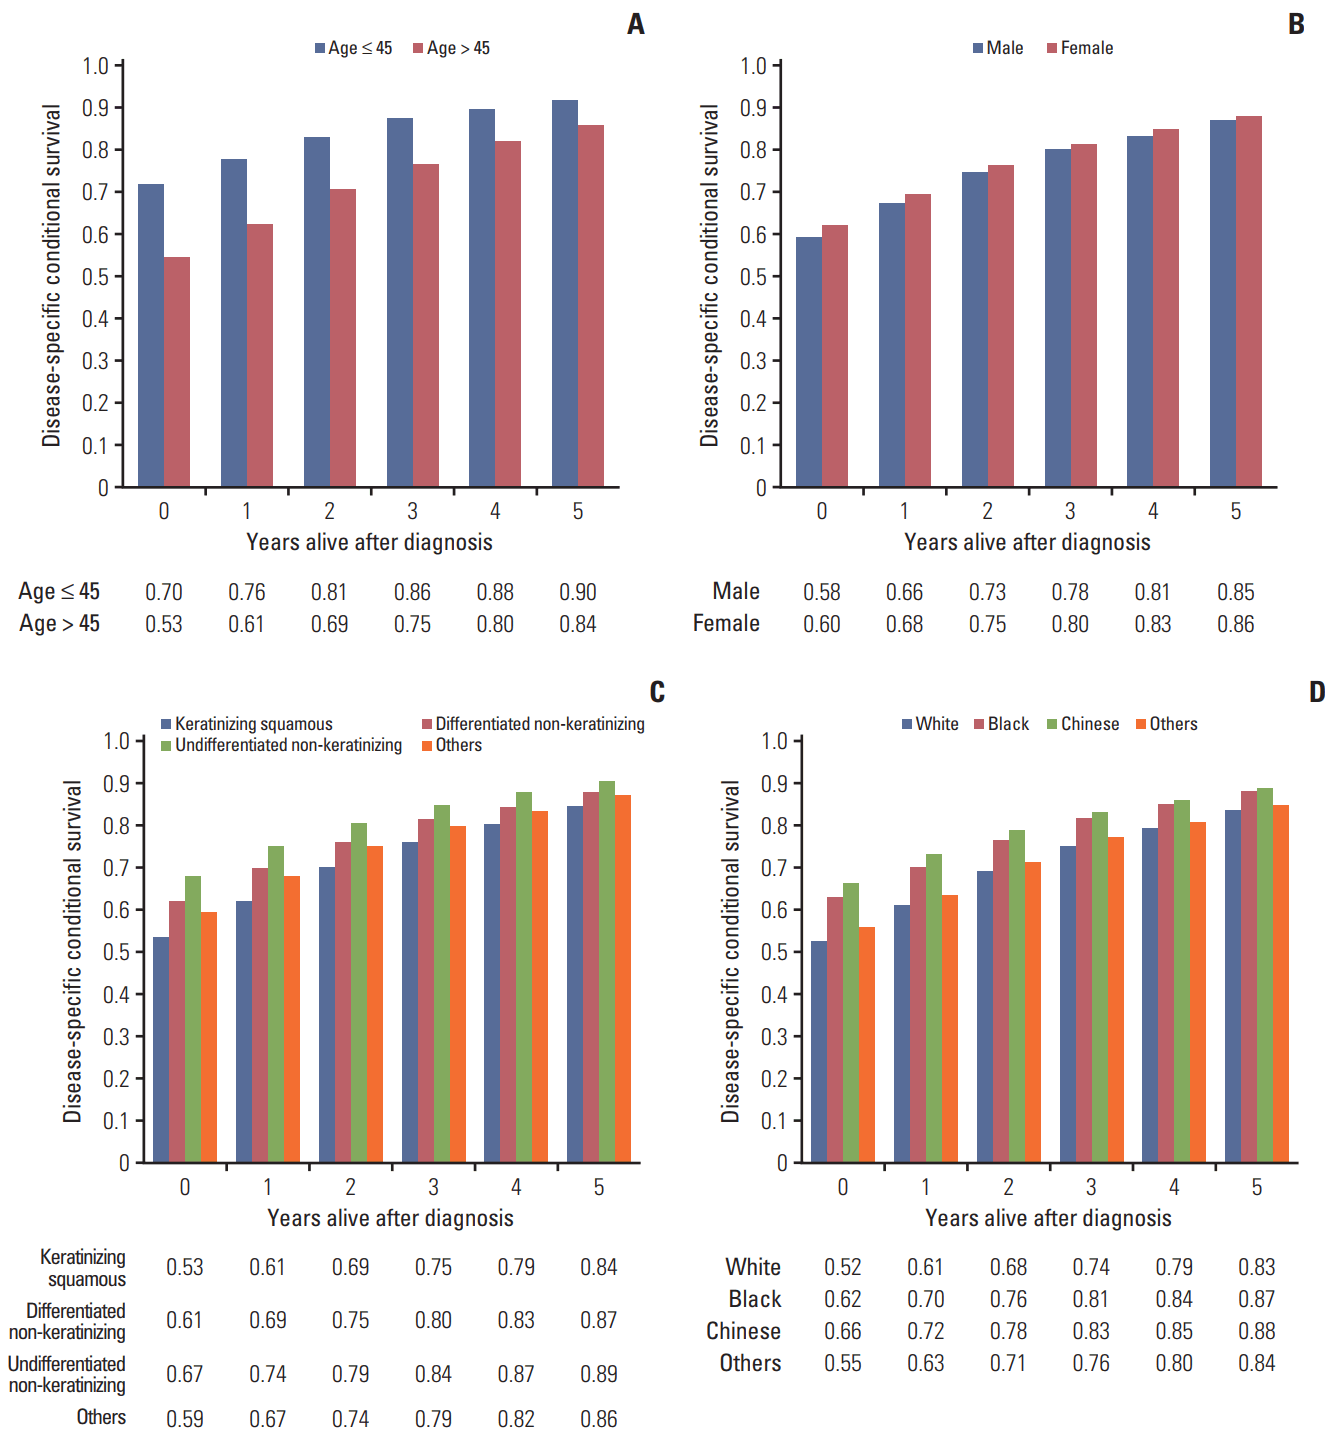
Fig. 4D depicts the adjusted 5-year overall CS rates for each race, adjusted for age, sex, histology, tumor extension, year of diagnosis, and use of radiation. White patients had the poorest 5-year survival probabilities at diagnosis. By year 5, this gap reduced from 16.2% to 9.8% when compared with Chinese patients. Generally, the adjusted 5-year disease-specific CS rates stratified by age, sex, histology, and race followed a similar pattern to overall CS (Fig. 5A-D).

Discussion

Survival rates for NPC have increased in recent decades with the introduction of new technologies and treatment modalities. Traditional estimates of survival outcomes are mainly based on measurements from the time of diagnosis. In comparison, CS provides more dynamic and clinically reliable estimates of survival probability for patients who have already survived for a period of time. In this study, we assessed the changes in contemporary survival rates over the recent decades and determined the unique CS patterns for NPC using data from a population-based database.
The treatment outcomes of patients with NPC have greatly improved over recent decades. However, challenges remain when interpreting these improved outcomes, especially as early detection due to cancer screening, such as the examination of serum Epstein-Barr virus (EBV) antibodies or even plasma EBV DNA, have greatly changed the distributions of patient and tumor characteristics at diagnosis. Further research is needed to determine the factors that have contributed to the survival improvements and their relative importance.
In addition to the dramatic improvements in baseline survival trends, NPC also demonstrates unique patterns of CS. Stage at diagnosis was the one of the strongest predictors of survival. Interestingly, the adjusted 5-year overall CS estimates for localized disease improved by a relatively small degree with every succeeding year survived. The adjusted 5-year disease-specific CS for localized NPC equalized other causes of death at the third conditional year, indicating that fewer patients would die of the primary cancer than competing non-cancer causes at this point. In contrast, for patients with distant disease, adjusted 5-year overall CS continued to improve dramatically and did not reach a plateau until the fifth year survived after diagnosis. However, these CS improvements for distant disease should be interpreted with caution; any enthusiasm must be tempered by the realization that only a small proportion of patients with distant disease (33.3%) survived long enough to observe this increase. Generally, compared to other HNSCCs, in which CS increases with time and then plateaus at 3-4 years after diagnosis [12,22], NPC has a unique pattern of CS, which increases over time and does not plateau until 9 years after diagnosis. In addition, patients with different stages of NPC also demonstrated special features compared with other tumor types, such as lung cancer, colon cancer, melanoma, and gastric cancer [8,10,23,24]. Particularly, among patients with localized stage disease, the survival rate exceeded counterpart non-cancer mortality at the third conditional year, which was later compared with colon cancer and melanoma; whereas, the survival rate was below 80% and kept increasing at the fifth year for distant stage disease. These differences, alongside the distinct biological behavior, treatment patterns and mode of failure of NPC, highlight the need to determine CS profiles for patients with NPC independently of other HNSCCs.
A number of factors: age, sex, tumor histology and race were also evaluated after adjustment for covariates; each of these factors has previously been observed to be a potentially important determinant of outcome in NPC [25-27]. After adjustment, all of these factors, were found to be significant determinants of initial prognosis, except for sex; however, their influence on survival decreased as the number of years survived increased. Similar trends have been observed in melanoma and lung cancer [8,23]. In contrast, the effects of sex, age and race on CS persist over time in rectal cancer [28].
This study represents the largest population-based study to explore the changes in contemporary survival over time and determine CS patterns in NPC. One of the unique features of this analysis was that a Cox proportional hazards model using the correct group prognosis method was used to adjust for the effects of covariates on CS; this analysis has not previously been performed for other head and neck cancers [12]. Compared to unadjusted analyses, adjustment allowed for smaller but more reliable improvements in CS over time, with more accurate modeling of true prognosis. Secondly, in addition to the overall CS estimates, we also reported disease-specific CS estimates, which provide useful information to help estimate the risk of dying from cancer and are potentially easier for the general population to interpret than OS. This is highly important for patients with NPC, as their risk of dying from comorbidities may be significant due to their frequent use of tobacco and alcohol, which are common risk factors for this tumor type [29,30].
This study provides information that is valuable to both patients and HCPs, and may also provide a significant contribution to clinical cancer research. Firstly, for patients with advanced NPC, the understanding that great improvements in survival occur with each additional year survived may help reduce anxiety levels and improve quality of life for patients. Secondly, understanding dynamic survival patterns may help HCPs to establish cost-effective surveillance strategies, both in terms of duration and intensity of follow-up. Thirdly, observation of CS may provide useful information on valid endpoints for clinical trials. The time-point at which survival expectancy exceeds counterpart non-cancer mortality could be considered the time necessary to achieve cure, and has been advocated as a potential endpoint for clinical trials [31]. CS plateaus earlier for patients with localized NPC than those with regional and distant disease. Therefore, 3 years’ follow-up may be appropriate for trials including patients with localized disease, which could help to accelerate the development of therapeutic regimens for early-stage NPC. However, the 5-year survival estimate for distant disease in the fifth year was below 80% and still increasing, suggesting the standard 5-year follow-up period may be insufficient for this group of patients.
Several limitations need to be addressed. Firstly, the SEER provides limited information on chemotherapeutic regimens and radiation therapy techniques. As treatments have evolved over time, especially the recommendations for chemotherapy and the implementation of IMRT [32], the CS calculations may to some extent be overweighed in patients with long-term follow-up, and the effects of novel treatments may be underestimated. In addition, the SEER database does not provide information on tobacco exposure, EBV DNA status, concurrent comorbidities, and socioeconomic status, which can have prognostic value for survival. Secondly, staging information for NPC in this database is based on the SEER historical staging classification. As the seventh edition of the AJCC cancer staging system is now the standard classification [33], application of the SEER staging system is likely to lead to overestimate/underestimation of CS. Nevertheless, calculation of CS requires long-term follow-up and large-scale analyses, and the SEER dataset offers a unique opportunity to evaluate population-based long-term survival trends and CS patterns in NPC. To ensure high-quality analysis, we set strict inclusion criteria and excluded patients with multiple primary tumors to distinguish cause-specific mortality due to primary NPC.
In conclusion, this study sheds further light on how survival in NPC has changed over recent decades in the U.S. population, and identifies covariate-adjusted CS patterns among patients with long-term survival. This data may help HCPs to provide more individualized and cost-effective surveillance strategies. In addition, as the improvements in CS are stage-dependent, patients with an initially poor prognosis should feel more relieved with each additional year they survive. Furthermore, observation of CS patterns may provide insightful information on valid endpoints for clinical trials.

Notes

Conflict of interest relevant to this article was not reported.

ACKNOWLEDGMENTS

This work was supported by grants from the National Natural Science Foundation of China (No. 81372409), the Science and Technology Project of Guangzhou City, China (No. 132000507), and the National Natural Science Foundation of China (No. 81402532). The funders had no role in study design, data collection and analysis, decision to publish, or preparation of the manuscript.

References

1. Tang LL, Chen WQ, Xue WQ, He YQ, Zheng RS, Zeng YX, et al. Global trends in incidence and mortality of nasopharyngeal carcinoma. Cancer Lett. 2016; 374:22–30.
crossref
2. Jemal A, Bray F, Center MM, Ferlay J, Ward E, Forman D. Global cancer statistics. CA Cancer J Clin. 2011; 61:69–90.
crossref
3. Wei KR, Zheng RS, Zhang SW, Liang ZH, Ou ZX, Chen WQ. Nasopharyngeal carcinoma incidence and mortality in China in 2010. Chin J Cancer. 2014; 33:381–7.
4. Lai SZ, Li WF, Chen L, Luo W, Chen YY, Liu LZ, et al. How does intensity-modulated radiotherapy versus conventional two-dimensional radiotherapy influence the treatment results in nasopharyngeal carcinoma patients? Int J Radiat Oncol Biol Phys. 2011; 80:661–8.
5. Blanchard P, Lee A, Marguet S, Leclercq J, Ng WT, Ma J, et al. Chemotherapy and radiotherapy in nasopharyngeal carcinoma: an update of the MAC-NPC meta-analysis. Lancet Oncol. 2015; 16:645–55.
crossref
6. Sun Y, Li WF, Chen NY, Zhang N, Hu GQ, Xie FY, et al. Induction chemotherapy plus concurrent chemoradiotherapy versus concurrent chemoradiotherapy alone in locoregionally advanced nasopharyngeal carcinoma: a phase 3, multicentre, randomised controlled trial. Lancet Oncol. 2016; 17:1509–20.
7. Ferrell BR, Dow KH, Leigh S, Ly J, Gulasekaram P. Quality of life in long-term cancer survivors. Oncol Nurs Forum. 1995; 22:915–22.
8. Skuladottir H, Olsen JH. Conditional survival of patients with the four major histologic subgroups of lung cancer in Denmark. J Clin Oncol. 2003; 21:3035–40.
crossref
9. Merrill RM, Henson DE, Ries LA. Conditional survival estimates in 34,963 patients with invasive carcinoma of the colon. Dis Colon Rectum. 1998; 41:1097–106.
crossref
10. Wang SJ, Emery R, Fuller CD, Kim JS, Sittig DF, Thomas CR. Conditional survival in gastric cancer: a SEER database analysis. Gastric Cancer. 2007; 10:153–8.
crossref
11. Fukui T, Okasaka T, Kawaguchi K, Fukumoto K, Nakamura S, Hakiri S, et al. Conditional survival after surgical intervention in patients with non-small cell lung cancer. Ann Thorac Surg. 2016; 101:1877–82.
crossref
12. Fuller CD, Wang SJ, Thomas CR Jr, Hoffman HT, Weber RS, Rosenthal DI. Conditional survival in head and neck squamous cell carcinoma: results from the SEER dataset 1973-1998. Cancer. 2007; 109:1331–43.
13. ClinicalTrials.gov. Glossary of clinical trial terms [Internet]. Bethesda, MD: US National Institutes of Health;2017. [cited 2017 May 2]. Available from: http://www.clinicaltrials.gov/ct2/info/glossary.
14. Chua ML, Wee JT, Hui EP, Chan AT. Nasopharyngeal carcinoma. Lancet. 2016; 387:1012–24.
crossref
15. Warren JL, Klabunde CN, Schrag D, Bach PB, Riley GF. Overview of the SEER-Medicare data: content, research applications, and generalizability to the United States elderly population. Med Care. 2002; 40(8 Suppl):IV-3-18.
16. Fritz A, Percy C, Jack A, Shanmugaratnam K, Sobin L, Parkin DM, et al. International classification of disease for oncology. 3rd ed. Geneva: World Health Organization;2000.
17. National Cancer Institute. Summary staging guide, SEER program. NIH Publication No. 81. Bethesda, MD: National Institute of Health;1981. p. 598–603.
18. Nieto FJ, Coresh J. Adjusting survival curves for confounders: a review and a new method. Am J Epidemiol. 1996; 143:1059–68.
crossref
19. Adjusted survival analysis programs [Internet]. Calgary: University of Calgary;2001. [cited 2001 Aug 2]. Available from: http://people.ucalgary.ca/~hquan/adjsurv.html.
20. Schoenfeld D. Partial residuals for the proportional hazards regression model. Biometrika. 1982; 69:239–41.
crossref
21. Gill RD. Multistate life-tables and regression models. Math Popul Stud. 1992; 3:259–76.
crossref
22. Greene FL, Page DL, Fleming ID, Fritz A, Balch CM, Haller DG, et al. AJCC cancer staging handbook: from the AJCC cancer staging manual. 6th ed. New York: Springer;2002.
23. Xing Y, Chang GJ, Hu CY, Askew RL, Ross MI, Gershenwald JE, et al. Conditional survival estimates improve over time for patients with advanced melanoma: results from a population-based analysis. Cancer. 2010; 116:2234–41.
24. Chang GJ, Hu CY, Eng C, Skibber JM, Rodriguez-Bigas MA. Practical application of a calculator for conditional survival in colon cancer. J Clin Oncol. 2009; 27:5938–43.
crossref
25. Xiao G, Cao Y, Qiu X, Wang W, Wang Y. Influence of gender and age on the survival of patients with nasopharyngeal carcinoma. BMC Cancer. 2013; 13:226.
crossref
26. OuYang PY, Zhang LN, Lan XW, Xie C, Zhang WW, Wang QX, et al. The significant survival advantage of female sex in nasopharyngeal carcinoma: a propensity-matched analysis. Br J Cancer. 2015; 112:1554–61.
crossref
27. Ou SH, Zell JA, Ziogas A, Anton-Culver H. Epidemiology of nasopharyngeal carcinoma in the United States: improved survival of Chinese patients within the keratinizing squamous cell carcinoma histology. Ann Oncol. 2007; 18:29–35.
crossref
28. Wang SJ, Fuller CD, Emery R, Thomas CR. Conditional survival in rectal cancer: a SEER database analysis. Gastrointest Cancer Res. 2007; 1:84–9.
29. Deleyiannis FW, Thomas DB, Vaughan TL, Davis S. Alcoholism: independent predictor of survival in patients with head and neck cancer. J Natl Cancer Inst. 1996; 88:542–9.
crossref
30. Hsu WL, Chen JY, Chien YC, Liu MY, You SL, Hsu MM, et al. Independent effect of EBV and cigarette smoking on nasopharyngeal carcinoma: a 20-year follow-up study on 9,622 males without family history in Taiwan. Cancer Epidemiol Biomarkers Prev. 2009; 18:1218–26.
crossref
31. Wang SJ, Fuller CD, Kim JS, Sittig DF, Thomas CR Jr, Ravdin PM. Prediction model for estimating the survival benefit of adjuvant radiotherapy for gallbladder cancer. J Clin Oncol. 2008; 26:2112–7.
crossref
32. Lee AW, Ma BB, Ng WT, Chan AT. Management of nasopharyngeal carcinoma: current practice and future perspective. J Clin Oncol. 2015; 33:3356–64.
crossref
33. Edge SB, Compton CC. The American Joint Committee on Cancer: the 7th edition of the AJCC cancer staging manual and the future of TNM. Ann Surg Oncol. 2010; 17:1471–4.
crossref

Fig. 1.
Kaplan-Meier analysis of adjusted 5-year baseline overall survival (A) and disease-specific survival (B) by decades in patients with nasopharyngeal carcinoma.
crt-2016-544f1.tif
Fig. 2.
Crude 5-year overall survival (OS) (A) and disease-specific conditional survival (CS) (B) for patients with nasopharyngeal carcinoma. DSS, disease-specific survival.
crt-2016-544f2.tif
Fig. 3.
Adjusted 5-year overall survival (A) and disease-specific conditional disease-specific survival (B) for patients with nasopharyngeal carcinoma stratified by the Surveillance, Epidemiology, and End Results historical staging classification, and adjusted for age, sex, race, histology, stage, year of diagnosis, and use of radiation. NOS, not otherwise specified.
crt-2016-544f3.tif
Fig. 4.
Adjusted 5-year overall conditional survival for patients with nasopharyngeal carcinoma stratified by age, and adjusted for sex, histology, race, tumor extension, year of diagnosis, and use of radiation (A); sex, and adjusted for age, histology, race, tumor extension, year of diagnosis, and use of radiation (B); histology, and adjusted for age, sex, race, tumor extension, year of diagnosis, and use of radiation (C); and race, and adjusted for age, sex, histology, tumor extension, year of diagnosis, and use of radiation (D). The x-axis represents patients who have already survived 0 to 5 years.
crt-2016-544f4.tif
Fig. 5.
Adjusted 5-year disease-specific conditional survival for patients with nasopharyngeal carcinoma stratified by age, and adjusted for sex, histology, race, tumor extension, year of diagnosis, and use of radiation (A); sex, and adjusted for age, histology, race, tumor extension, year of diagnosis, and use of radiation (B); histology, and adjusted for age, sex, race, tumor extension, year of diagnosis, and use of radiation (C); and race, and adjusted for age, sex, histology, tumor extension, year of diagnosis, and use of radiation (D). The x-axis represents patients who have already survived 0 to 5 years.
crt-2016-544f5.tif
Table 1.
Basic characteristics and survival analysis for 7,713 patients diagnosed with nasopharyngeal carcinoma between 1973 and 2007
Characteristic No. of patients (%) Univariate analysis HR (95% CI) Overall survival rate Multivariate analysisa) HR (95% CI) Overall adjusted survival
Age (yr)
 ≤ 45 2,299 (29.8) Reference 0.66 Reference 0.69
 > 45 5,414 (70.2) 2.34 (2.19-2.50) 0.45 2.27 (2.12-2.43) 0.44
Sex
 Male 5,372 (69.6) Reference 0.50 Reference 0.51
 Female 2,341 (30.4) 0.90 (0.84-0.95) 0.54 0.92 (0.86-0.97) 0.54
Year of diagnosis
 1973-1979 823 (10.7) Reference 0.36 Reference 0.36
 1980-1989 2,386 (16.7) 0.86 (0.78-0.95) 0.44 0.89 (0.81-0.98) 0.42
 1990-1999 2,245 (29.1) 0.67 (0.62-0.74) 0.54 0.78 (0.71-0.86) 0.47
 2000-2007 3,359 (43.5) 0.63 (0.58-0.69) 0.56 0.64 (0.59-0.70) 0.55
Histological type
 Keratinizing squamous cell 3,023 (39.2) Reference 0.41 Reference 0.47
 Differentiated non-keratinizing 941 (12.2) 0.66 (0.60-0.72) 0.58 0.79 (0.72-0.87) 0.55
 Undifferentiated non-keratinizing 1,629 (21.1) 0.54 (0.50-0.58) 0.65 0.67 (0.62-0.72) 0.60
 Others 2,120 (27.5) 0.73 (0.69-0.78) 0.52 0.84 (0.79-0.90) 0.52
Ethnic origin
 White 3,808 (49.4) Reference 0.44 Reference 0.44
 Black 683 (8.9) 0.94 (0.85-1.03) 0.43 1.09 (0.99-1.20) 0.48
 Chinese 1,602 (20.8) 0.59 (0.55-0.63) 0.64 0.69 (0.64-0.75) 0.60
 Other 1,620 (21.0) 0.68 (0.63-0.73) 0.58 0.79 (0.73-0.85) 0.56
Stageb)
 Localized 901 (11.7) Reference 0.66 Reference 0.67
 Regional 4,610 (59.8) 1.23 (1.14-1.37) 0.55 1.55 (1.41-1.70) 0.54
 Distant 1,568 (20.3) 2.12 (1.92-2.36) 0.34 2.56 (2.31-2.83) 0.35
 NOS 634 (8.2) 1.58 (1.40-1.79) 0.45 1.52 (1.34-1.73) 0.53
Radiation treatment
 No 1,080 (14.0) Reference 0.32 Reference 0.33
 Yes 6,475 (83.9) 0.56 (0.52-0.61) 0.55 0.56 (0.52-0.61) 0.55
 NOS 158 (2.1) 0.89 (0.74-1.08) 0.35 0.74 (0.61-0.89) 0.38

HR, hazard ratio; CI, confidence interval; NOS, not otherwise specified; SEER, Surveillance Epidemiology End Results.

a) The following parameters were included in the Cox proportional hazards model multivariate analysis: age (≤ 45 vs. > 45 years); sex (male vs. female); race (White vs. Black vs. Chinese vs. other); histological type (keratinizing squamous cell carcinoma vs. differentiated non-keratinizing carcinoma vs. undifferentiated non-keratinizing carcinoma); SEER historical staging (localized vs. regional vs. metastasis vs. NOS); year of diagnosis (1973-1979 vs. 1980-1989 vs. 1990-1999 vs. 2000-007), and the use of radiation (‘yes’ vs. ‘no’ vs. ‘NOS’),

b) According to the SEER historical staging classification.

TOOLS
Similar articles