Abstract
Purpose
While tumor markers (carbohydrate antigen 19-9 [CA 19-9] and carcinoembryonic antigen [CEA]) can aid in the diagnosis of biliary tract cancer, their prognostic role has not been clearly elucidated. Therefore, this study was conducted to evaluate the prognostic role of tumor markers and tumor marker change in patients with advanced biliary tract cancer.
Materials and Methods
Patients with pathologically proven metastatic or relapsed biliary tract cancer who were treated in a phase II trial of first-line S-1 and cisplatin chemotherapy were enrolled. Serum tumor markers were measured at baseline and after the first cycle of chemotherapy.
Results
Among a total of 104 patients, 80 (77%) had elevated baseline tumor markers (69 with CA 19-9 elevation and 40 with CEA). A decline ≥ 30% of the elevated tumor marker level after the first cycle of chemotherapy conferred an improved time to progression (TTP), overall survival (OS), and better chemotherapy response. Multivariate analysis revealed tumor marker decline as an independent positive prognostic factor of TTP (adjusted hazard ratio [HR], 0.44; p=0.003) and OS (adjusted HR, 0.37; p < 0.001). Subgroup analysis revealed similar results in each group of patients with CA 19-9 elevation and CEA elevation. In addition, elevated baseline CEA was associated with poor survival in both univariate and multivariate analysis.
Biliary tract cancer includes intrahepatic cholangiocarcinoma, extrahepatic cholangiocarcinoma, gallbladder cancer, and ampulla of Vater cancer. The incidence of biliary tract cancer is low in Western countries (2-3 persons/100,000 per year), but their incidence is relatively high in Asian countries (4-6 persons/100,000 per year) [1,2]. Complete resection is the only option to cure biliary tract cancer, but only 10% of patients are diagnosed at an early stage of the disease and are considered for curative resection [3]. For patients with unresectable or metastatic biliary tract cancer, chemotherapy has shown significant benefit compared with best supportive care alone [4,5]. In a randomized controlled phase III study, gemcitabine plus cisplatin showed improved overall survival (OS) and progression-free survival compared to gemcitabine alone [6]. Although gemcitabine plus cisplatin is considered as a standard of care in a first-line setting, this regimen has not been compared head to head with other fluoropyrimidine-based regimens in phase III studies [7]. In a phase II study, combination of S-1 and cisplatin showed comparable efficacy and favorable safety compared to gemcitabine plus cisplatin in patients with advanced biliary tract cancer [8]. Gemcitabine-based or fluoropyrimidine-based combinations are considered the standard first-line chemotherapy regimen for patients with advanced biliary tract cancer [6,9-11].
Despite the progress in chemotherapy regimen, prognosis of biliary tract cancer remains poor, with a median OS of 5-15 months, and only 15%-40% of patients show response to chemotherapy [12]. Selection of patients who might benefit from chemotherapy is important. In addition, early assessment of treatment efficacy can facilitate a physician’s clinical decision and prevent patients from unnecessary treatment. Metastatic disease, intrahepatic cholangiocarcinoma, liver metastasis, Eastern Cooperative Oncology Group (ECOG) performance status and alkaline phosphatase (ALP) level were identified as prognostic factors in patients with advanced biliary tract cancer [13]. However, the prognostic role of tumor markers including carcinoembryonic antigen (CEA) and carbohydrate antigen (CA) 19-9 has not yet been clearly elucidated. In patients with un-resectable biliary tract cancer, pretreatment elevated CA 19-9 level was associated with poor overall survival, and CA 19-9 decline during chemotherapy showed prolonged survival in a subgroup of patients without biliary obstruction [14]. Recently, a 50% decline of CA 19-9 level after 10-12 weeks of chemotherapy showed improved survival in inoperable bile duct cancer patients [15]. The present study was conducted to evaluate the prognostic role of tumor markers (CA 19-9 and CEA) and changes in tumor markers in advanced biliary tract cancer patients. For early assessment of treatment efficacy by tumor marker change, tumor marker change was measured after the first cycle of chemotherapy (3 weeks after chemotherapy initiation). The study population was homogenous that all patients were prospectively enrolled in a phase II trial of firstline S-1 plus cisplatin chemotherapy. In this trial, combination chemotherapy was an effective outpatient-based regimen in patients with advanced biliary tract cancer [16].
Patients (n=104) with pathologically proven unresectable, metastatic, or relapsed biliary tract adenocarcinoma who participated in an expansion cohort of a phase II trial of S-1 and cisplatin were included [16]. Eligibility criteria included age over 20, ECOG performance status of 0 to 2, no prior chemotherapy or radiotherapy, adequate bone marrow, hepatic, and renal function. In addition, at least one measurable lesion according to the Response Evaluation Criteria in Solid tumors (RECIST) was required for inclusion. Written informed consent was obtained from each patient before enrollment and the protocol was approved by the Institutional Review Board of the Seoul National University Hospital, Seoul, Korea (0412-138-08).
S-1 was administered orally at a dose of 40 mg/m2 twice daily for 14 days, followed by a 7-day rest period. Cisplatin was given as a 90-minute infusion on day 1 of each cycle at a dose of 60 mg/m2. Treatment was repeated every 3 weeks until disease progression, unacceptable toxicity, or withdrawal of patient consent.
Best tumor response was assessed by computed tomography (CT) scans using the RECIST 1.0 criteria [17]. The overall response rate (RR) was defined as a proportion of patients having the best response of either complete response or partial response. CT scan was made at baseline and every two cycles (6 weeks) thereafter. Collection of medical history, physical examination, measurement of the CEA, CA 19-9 level, and toxicity evaluation was made on every cycle. Toxicity was measured according to the National Cancer Institute Common Terminology Criteria for Adverse Events ver. 3.0. CEA level of 5 ng/mL and CA 19-9 level of 37 U/mL was defined as a cutoff value for normal level according to the historical data and manufacturer’s recommendation [18,19]. Baseline tumor marker level was measured on the day of the first cycle of chemotherapy (before chemotherapy injection) and follow up tumor marker was measured 3 weeks after the first cycle of chemotherapy (the day of second cycle chemotherapy administration, before chemotherapy injection). Tumor marker change was compared between baseline and follow up tumor marker level. Tumor marker decline was defined as a 30% decrease in serum level of tumor marker after the first cycle of chemotherapy, which was measured 3 weeks after chemotherapy initiation (the day of second cycle chemotherapy administration).
The primary objective of the phase II study was to evaluate the RR of S-1 and cisplatin chemotherapy in patients with advanced biliary tract cancer. Time to progression (TTP) was defined as the interval between the first day of chemotherapy and the first day of documented progressive disease. Data from patients who were free of progression were censored at the date of the last tumor response evaluation. OS was defined as the date of the first chemotherapy to the date of death from any cause. Preplanned exploratory analysis of the correlation between serum tumor marker, tumor marker change, and treatment outcome of patients with advanced biliary tract cancer was performed in the prospective expansion cohort. The main focus of the present study was to evaluate the prognostic role of tumor marker change. Categorical variables were compared using a chi-square test. TTP and OS were calculated using the Kaplan-Meier method and comparisons were made using the log-rank tests. Hazard ratios (HR) were calculated using the Cox proportional hazard model. To adjust for the baseline characteristics, we used the Cox proportional hazard model in a forward stepwise manner. Prognostic factors found to have a probability value ≤ 0.20 upon univariate analysis were included in the multivariate analysis. Two-sided p-values < 0.05 were considered statistically significant. All analyses were performed with the SPSS ver. 18.0 (SPSS Inc., Chicago, IL).
A total of 104 patients with advanced biliary tract cancer who were prospectively enrolled in a phase II trial of first line S-1 and cisplatin were included from January 2005 to December 2008. Baseline characteristics are summarized in Table 1. Tumor type was intrahepatic cholangiocarcinoma in 57, gallbladder cancer in 33, extrahepatic cholangiocarcinoma in 11, and ampulla of Vater cancer in three patients. Presentation of disease was initially metastatic in 71 patients, relapsed in 29 patients, and four patients had unresectable disease. Baseline serum ALP level (≥ 115 IU/L), CEA level (≥ 5 ng/mL), and CA 19-9 level (≥ 37 U/mL) was above normal level in 39 (37.1%), 40 (38.5%), and 69 (66.3%) patients. Eighty patients (77%) had either elevated CEA or CA 19-9 levels. Median levels of CEA and CA 19-9 were 3.0 ng/mL and 240 U/mL, respectively. Most patients had ECOG performance status 1 (85.6%). According to the inclusion criteria, none of the patients received prior systemic chemotherapy for metastatic disease.
This is the expanded result of the previously published phase II study [16]. After a median follow-up duration of 31.6 months, 90 death events and 80 progression events occurred. The median TTP was 5.4 months (95% confidence interval [CI], 4.2 to 6.7) and the median OS was 8.6 months (95% CI, 7.2 to 10.0). The overall RR was 27.9% and the disease control rate was 70.2%.
Baseline elevated CEA levels (4.7 months vs. 6.3 months, p=0.015) and elevated ALP levels (3.7 months vs. 6.8 months, p=0.039) were associated with poor TTP (Table 2). Interquartile ranges of CEA revealed a negative linear correlation between CEA level and patient overall survival. Liver metastasis and initial metastatic presentation was not associated with TTP. However, initial metastatic presentation was associated with poor OS (8.2 months vs. 11.4 months, p=0.020). Upon multivariate analysis using the Cox proportional hazard model, elevated baseline CEA level (adjusted HR, 1.78; p=0.016) was associated with poor TTP. There was no predictive role of baseline CEA or CA 19-9 level based on the best tumor response assessed by the RECIST criteria.
In terms of OS, initial metastatic presentation, poor ECOG performance status, elevated ALP level, elevated CEA level, and elevated CA 19-9 level above 370 U/mL were associated with poor prognosis upon univariate analysis (Table 2). Multivariate analysis revealed that elevated baseline CEA level (adjusted HR, 2.12; p=0.001), ALP level (adjusted HR, 1.88; p=0.005), and poor ECOG performance status (adjusted HR, 2.64; p=0.017) were independently associated with poor OS.
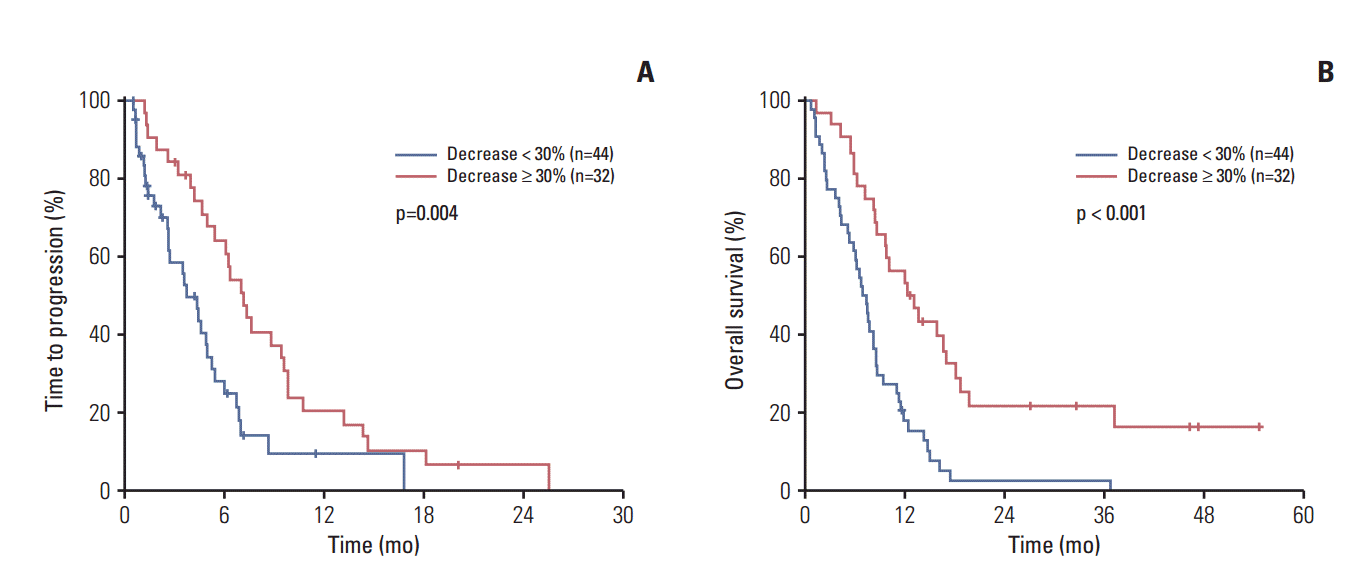
We next evaluated whether decreases in serum tumor marker level after the first cycle of chemotherapy can predict treatment outcomes. Among 80 patients with elevated baseline tumor marker levels (CEA and/or CA 19-9), tumor markers after first cycle of chemotherapy were measured in 76 patients (95%). Tumor marker decline after the first cycle of chemotherapy (CEA and/or CA 19-9) was associated with favorable TTP (7.2 months vs. 3.7 months, p=0.004) and OS (12.3 months vs. 6.9 months, p < 0.001) (Fig. 1). Multivariate analysis revealed that tumor marker decline after the first cycle of chemotherapy was an independent positive prognostic factor for both TTP (adjusted HR, 0.44; 95% CI, 0.25 to 0.75; p=0.003) and OS (adjusted HR, 0.37; 95% CI, 0.21 to 0.64; p < 0.001). In addition, patients with tumor marker decline were associated with better responses to chemotherapy (Table 3). Patients with tumor marker decline showed an overall RR of 59% compared to 9% in patients without tumor marker decline (p < 0.001). If we include the best response by RECIST criteria as a covariate factor in the multivariate analysis, tumor marker decline was an independent prognostic factor for OS (adjusted HR, 0.47; 95% CI, 0.23 to 0.95; p=0.035), but not for TTP.
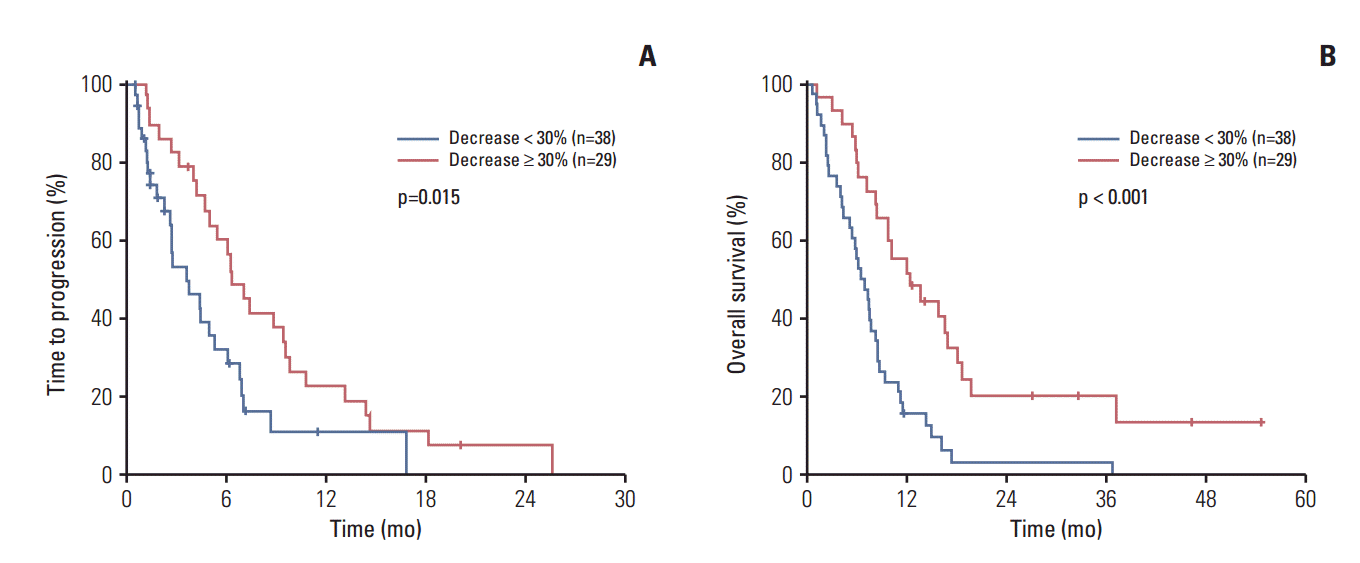
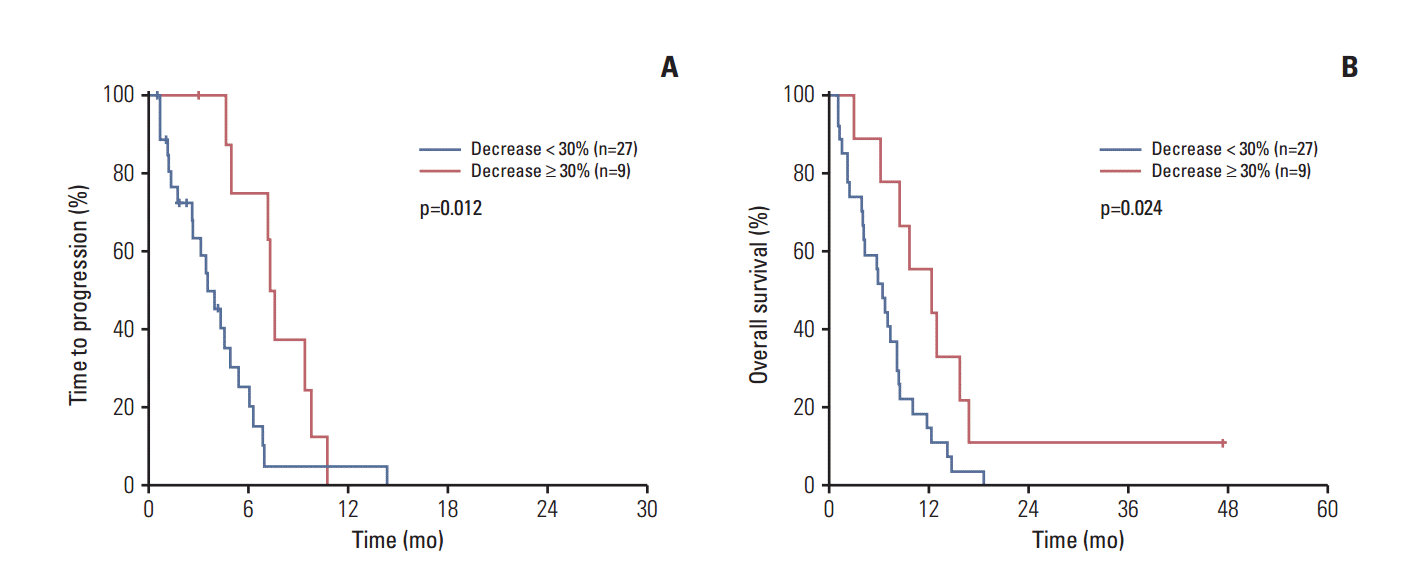
Similar results were obtained in the subgroup of patients with elevated CA 19-9 level and CEA level. Among 69 patients with a baseline CA 19-9 level ≥ 37 U/mL, CA 19-9 level after the first cycle of chemotherapy was measured in 67 patients (97%). Among 40 patients (90%) who had elevated baseline CEA levels, the CEA level of 36 patients (90%) was measured after the first cycle of chemotherapy. In the 67 patients with baseline CA 19-9 levels ≥ 37 U/mL, CA 19-9 decline after the first cycle of chemotherapy was associated with favorable TTP (6.3 months vs. 3.6 months, p=0.015) and OS (12.3 months vs. 6.5 months, p < 0.001) (Fig. 2). In 36 patients with elevated baseline CEA levels (≥ 5 ng/mL), CEA decline after the first cycle of chemotherapy showed favorable TTP (7.4 months vs. 3.6 months, p=0.012) and OS (12.3 months vs. 6.5 months, p=0.024) (Fig. 3). Multivariate analysis revealed that CA 19-9 decline after the first cycle of chemotherapy was an independent positive prognostic factor for both TTP (adjusted HR, 0.48; 95% CI, 0.27 to 0.85; p=0.012) and OS (adjusted HR, 0.35; 95% CI, 0.20 to 0.62; p < 0.001). CEA decline was also an independent positive prognostic factor for both TTP (adjusted HR, 0.34; 95% CI, 0.14 to 0.81; p=0.015) and OS (adjusted HR, 0.38; 95% CI, 0.16 to 0.92; p=0.032).
We determined the prognostic role of tumor markers (CEA and CA 19-9) and changes in tumor markers in advanced biliary tract cancer patients who were prospectively enrolled in a phase II study of first line S-1 and cisplatin chemotherapy. Biliary tract cancer is a rare cancer worldwide, and the prognostic factors have not been clearly defined or validated. Old age, large tumor volume, metastatic disease, intrahepatic cholangiocarcinoma, liver metastasis, ECOG performance status and ALP level, CA19-9, and CA19-9 decline have been proposed as prognostic factors in advanced biliary tract cancer [13-15,20]. Using our homogenous cohort of patients treated with first-line S-1 plus cisplatin, we found that tumor marker decline is associated with prolonged survival. In addition, elevated baseline CEA was associated with poor survival.
Among the variable tumor markers, CEA and CA 19-9 have been the most thoroughly investigated in patients with biliary tract cancer. In patients with primary sclerosing cholangitis, serum CEA and CA 19-9 play a role in the diagnosis of cholangiocarcinoma [21-23]. In addition, baseline elevated CA 19-9 played a negative prognostic role in advanced biliary tract cancer [14]. However, the prognostic role of baseline CEA or their change has not been thoroughly investigated. In the present study, patients with baseline CEA ≥ 5 ng/mL had worse TTP and OS than those with CEA < 5 ng/mL. Although CA 19-9 did not have a prognostic role in terms of TTP, patients with CA 19-9 ≥ 370 U/mL had a worse OS than those with CA 19-9 < 370 U/mL. Upon multivariate analysis, elevated CEA was associated with poorer OS, but there was no prognostic role of CA 19-9.
We revealed that decreases in tumor markers after the first cycle of chemotherapy can predict chemotherapy response and patients prognosis. In patients with elevated baseline tumor markers, tumor marker decline ≥ 30% after the first cycle of chemotherapy was associated with improved TTP and OS. In addition, tumor marker decline was associated with better tumor response. Similar results were obtained using CA 19-9 and CEA levels in patients with elevated baseline CA 19-9 and CEA levels, respectively. A recent study by Grunnet et al. [15] shows that CA 19-9 decline during chemotherapy is associated with improved survival in inoperable biliary tract cancer. However, CA 19-9 was measured 10-12 weeks after treatment and there were no data describing CEA. Tumor response assessment using the RECIST criteria is usually measured 6 to 8 weeks after the start of chemotherapy because earlier changes are seldom significant. Our results showed that tumor maker measurement after the first cycle of chemotherapy (3 weeks after the start of chemotherapy) could predict tumor response and survival in patients with advanced biliary tract cancer. Earlier prediction of treatment efficacy and prognosis based on tumor markers can facilitate a physician’s decision and prevent patients from unnecessary, ineffective treatments. In addition, tumor marker changes can assist tumor response assessed by the RECIST criteria.
It should be noted that this study was limited in that only patients with measurable tumor lesions and those treated with first-line S-1 and cisplatin were included. As all patients in our study participated in a phase II trial of S-1 and cisplatin chemotherapy, we could not validate our findings in patients treated with a gemcitabine based regimen. However, chemotherapy regimen did not affect the prognostic role of CA 19-9 change in a study by Grunnet et al. [15]. Another limitation of the present study is that it was conducted in a relatively small number of patients so the study results should be interpreted with caution. However, as biliary tract cancer is a rare tumor, the data from 104 patients from a prospective phase II study are comparable to those of other studies performed in patients with biliary tract cancer. Finally, our findings need further validation in a larger independent cohort of patients that includes patients treated with gemcitabine based chemotherapy and those without measurable tumor lesions.
In conclusion, CA 19-9 or CEA decline ≥ 30% after the first cycle of chemotherapy can be used as an early measurement of treatment outcome in patients with advanced biliary tract cancer. Moreover, baseline elevated CEA level plays an independent negative prognostic role.
ACKNOWLEDGMENTS
We are grateful to Hyun Ju Ryu for her support as a clinical research coordinator.
This research was supported by the National R&D Program for Cancer Control (0620300 and 1120310), Ministry of Health and Welfare; Republic of Korea.
References
2. Randi G, Malvezzi M, Levi F, Ferlay J, Negri E, Franceschi S, et al. Epidemiology of biliary tract cancers: an update. Ann Oncol. 2009; 20:146–59.
3. Jarnagin WR, Fong Y, DeMatteo RP, Gonen M, Burke EC, Bodniewicz J, et al. Staging, resectability, and outcome in 225 patients with hilar cholangiocarcinoma. Ann Surg. 2001; 234:507–17.
4. Glimelius B, Hoffman K, Sjoden PO, Jacobsson G, Sellstrom H, Enander LK, et al. Chemotherapy improves survival and quality of life in advanced pancreatic and biliary cancer. Ann Oncol. 1996; 7:593–600.
5. Sharma A, Dwary AD, Mohanti BK, Deo SV, Pal S, Sreenivas V, et al. Best supportive care compared with chemotherapy for unresectable gall bladder cancer: a randomized controlled study. J Clin Oncol. 2010; 28:4581–6.
6. Valle J, Wasan H, Palmer DH, Cunningham D, Anthoney A, Maraveyas A, et al. Cisplatin plus gemcitabine versus gemcitabine for biliary tract cancer. N Engl J Med. 2010; 362:1273–81.
7. Park JO, Oh DY, Hsu C, Chen JS, Chen LT, Orlando M, et al. Gemcitabine plus cisplatin for advanced biliary tract cancer: a systematic review. Cancer Res Treat. 2015; 47:343–61.
8. Kang MJ, Lee JL, Kim TW, Lee SS, Ahn S, Park DH, et al. Randomized phase II trial of S-1 and cisplatin versus gemcitabine and cisplatin in patients with advanced biliary tract adenocarcinoma. Acta Oncol. 2012; 51:860–6.
9. Kornek GV, Schuell B, Laengle F, Gruenberger T, Penz M, Karall K, et al. Mitomycin C in combination with capecitabine or biweekly high-dose gemcitabine in patients with advanced biliary tract cancer: a randomised phase II trial. Ann Oncol. 2004; 15:478–83.
10. Eckel F, Schmid RM. Chemotherapy in advanced biliary tract carcinoma: a pooled analysis of clinical trials. Br J Cancer. 2007; 96:896–902.
11. Lee J, Hong TH, Lee IS, You YK, Lee MA. Comparison of the efficacy between gemcitabine-cisplatin and capecitabine-cisplatin combination chemotherapy for advanced biliary tract cancer. Cancer Res Treat. 2015; 47:259–65.
12. Sasaki T, Isayama H, Nakai Y, Koike K. Current status of chemotherapy for the treatment of advanced biliary tract cancer. Korean J Intern Med. 2013; 28:515–24.
13. Park I, Lee JL, Ryu MH, Kim TW, Lee SS, Park DH, et al. Prognostic factors and predictive model in patients with advanced biliary tract adenocarcinoma receiving first-line palliative chemotherapy. Cancer. 2009; 115:4148–55.
14. Harder J, Kummer O, Olschewski M, Otto F, Blum HE, Opitz O. Prognostic relevance of carbohydrate antigen 19-9 levels in patients with advanced biliary tract cancer. Cancer Epidemiol Biomarkers Prev. 2007; 16:2097–100.
15. Grunnet M, Christensen IJ, Lassen U, Jensen LH, Lydolph M, Knox JJ, et al. Decline in CA19-9 during chemotherapy predicts survival in four independent cohorts of patients with inoperable bile duct cancer. Eur J Cancer. 2015; 51:1381–8.
16. Kim YJ, Im SA, Kim HG, Oh SY, Lee KW, Choi IS, et al. A phase II trial of S-1 and cisplatin in patients with metastatic or relapsed biliary tract cancer. Ann Oncol. 2008; 19:99–103.
17. Eisenhauer EA, Therasse P, Bogaerts J, Schwartz LH, Sargent D, Ford R, et al. New response evaluation criteria in solid tumours: revised RECIST guideline (version 1.1). Eur J Cancer. 2009; 45:228–47.
18. Duffy MJ. Carcinoembryonic antigen as a marker for colorectal cancer: is it clinically useful? Clin Chem. 2001; 47:624–30.
19. Ballehaninna UK, Chamberlain RS. The clinical utility of serum CA 19-9 in the diagnosis, prognosis and management of pancreatic adenocarcinoma: an evidence based appraisal. J Gastrointest Oncol. 2012; 3:105–19.
20. Sasaki T, Isayama H, Nakai Y, Togawa O, Kogure H, Ito Y, et al. Prognostic factors in patients with advanced biliary tract cancer receiving chemotherapy. Cancer Chemother Pharmacol. 2011; 67:847–53.
21. Siqueira E, Schoen RE, Silverman W, Martin J, Rabinovitz M, Weissfeld JL, et al. Detecting cholangiocarcinoma in patients with primary sclerosing cholangitis. Gastrointest Endosc. 2002; 56:40–7.
Table 1.
Table 2.
Table 3.
Response | Tumor marker decrease | Tumor marker decrease | p-value | CA 19-9 decrease | CA 19-9 decrease | p-value | CEA decrease | CEA decrease | p-value |
---|---|---|---|---|---|---|---|---|---|
< 30%a) | ≥ 30%a) | < 30% | ≥ 30% | < 30% | ≥ 30% | ||||
CR | 1 (2.3) | 1 (3.1) | < 0.001 | 1 (2.6) | 0 | < 0.001 | 0 | 1 (11.1) | < 0.001 |
PR | 3 (6.8) | 18 (56.3) | 2 (5.3) | 16 (55.2) | 4 (14.8) | 7 (77.8) | |||
SD | 22 (50.0) | 9 (28.1) | 19 (50.0) | 9 (31.0) | 13 (48.1) | 1 (11.1) | |||
PD | 9 (20.5) | 3 (9.4) | 8 (21.1) | 3 (10.3) | 6 (22.2) | 0 | |||
Not measured | 9 (20.5) | 1 (3.1) | 8 (21.1) | 1 (3.4) | 4 (14.8) | 0 |