Journal List > Cancer Res Treat > v.49(3) > 1153470

Hahm, Chen, Miller, O’Neill, and Lee: Why Do Some People Choose Opportunistic Rather Than Organized Cancer Screening? The Korean National Health and Nutrition Examination Survey (KNHANES) 2010-2012

Abstract

Purpose

Although the Korean government has implemented a universal screening program for common cancers, some individuals choose to participate in opportunistic screening programs. Therefore, this study was conducted to identify factors contributing to the selection of organized versus opportunistic screening by the Korean general population.

Materials and Methods

Data from 11,189 participants aged ≥ 40 yearswho participated in the fifth Korean National Health and Nutrition Examination Survey (2010-2012) were analyzed in this study.

Results

A total of 6,843 of the participants (58.6%) underwent cancer screening, of which 6,019 (51.1%) participated in organized and 824 (7.5%) participated in opportunistic screening programs. Being female, older, highly educated, in the upper quartile of income, an ex-smoker, and a light drinker as well as having supplementary private health insurance and more comorbid conditions and engaging in moderate physical activity 1-4 days per week were related to participation in both types of screening programs. Being at least a high school graduate, in the upper quartile for income, and a light drinker, as well as having more comorbid conditions and engaging in moderate physical activities 1-4 days per week had a stronger effect on those undergoing opportunistic than organized screening.

Conclusion

The results of this study suggest that socioeconomic factors such as education and income, as well as health status factors such as health-related quality of life and number of comorbid conditions and health behaviors such as drinking and engaging in moderate physical activity 1-4 days per week had a stronger influence on participation in an opportunistic than in an organized screening program for cancer.

Introduction

Cancer is as a leading cause of death in Korea [1]; therefore, the Korean government launched a National Cancer Screening Program (NCSP) in 1999 in an attempt to save lives [2]. The NCSP is a well-organized program that has offered screening for five types of cancer (stomach, breast, colorectal, cervical, and liver) to all Korean individuals since 2005. The program is organized according to population group. Recipients of the Medical Aid Plan (MAP) and National Health Insurance (NHI) who are in the lower 50% of the premium scale can access its services free of charge, whereas NHI beneficiaries in the upper 50% of the premium scale are required to pay 10% of the cost of screening [3]. In contrast, individuals who use opportunistic cancer screening programs must pay for all procedure-related costs [4].
Even though the Korean government has ensured that the entire population can use the organized cancer screening program free of charge, opportunistic screening remains popular despite its out-of-pocket costs. Most medical institutions, tertiary hospitals, and clinics provide both organized and opportunistic health examination programs, including cancer screening [5]. Since the Korean government controls the medical fee schedule for most medical services provided by NHI, the fees for these services are insufficient [6]. Therefore, most institutions attempt to earn money through opportunistic health examination services, which have large profit margins because they are not constrained by the government’s fee schedule. Overall expenditures on health examinations were estimated at 1.5 billion US dollars in 2009 [7]; however, given the rapid growth in the health examination market in Korea, total expenditures may increase substantially.
Participation in cancer screening programs according to the recommended schedule is the best way to reduce the burden of cancer, especially by increasing the survival rate and improving the prognosis of cancer patients [8]. Increasing the rate of participation in cancer screening programs is an important approach to reducing the burden of this disease because screening is an efficient method of ameliorating the morbidity and mortality associated with cancer [9].
Previous studies have identified several factors associated with participation in cancer screening, many of which have focused on socioeconomic differences in such participation [4,8,10]. Kang et al. [10] identified educational and income disparities among those in attendance for opportunistic screening, while there were no significant differences in the organized screening. Lee et al. [4] reported trends in socioeconomic disparities in organized and opportunistic gastric cancer screening. Further, they found that socioeconomic disparities were still present for the opportunistic screening because of widening socioeconomic differences in Korea [4].
Some studies have reported a correlation between health-related quality of life (HRQOL) and participation in cancer screening programs [9,11-14]. These studies have suggested that higher cancer screening rates are associated with a better HRQOL. Health behaviors such as smoking, drinking, and physical activity have also been found to be associated with participation in cancer screening programs [7,12]. Most studies that have attempted to identify or examine the effects of relevant variables such as socioeconomic status, quality of life, health behaviors, and health status on participation in cancer screening [12,14] have focused exclusively on socioeconomic status or health behaviors.
It is important to determine why people participate in opportunistic cancer screening, despite their eligibility to use organized screening programs. Focusing on Korea, this study examined the factors that contribute to individual decisions to participate in organized versus opportunistic screening using data from the fifth Korean National Health and Nutrition Examination Survey (KNHANES V). Moreover, we attempted to identify factors that were more strongly associated with participation in opportunistic than organized cancer screening.

Materials and Methods

1. Study population

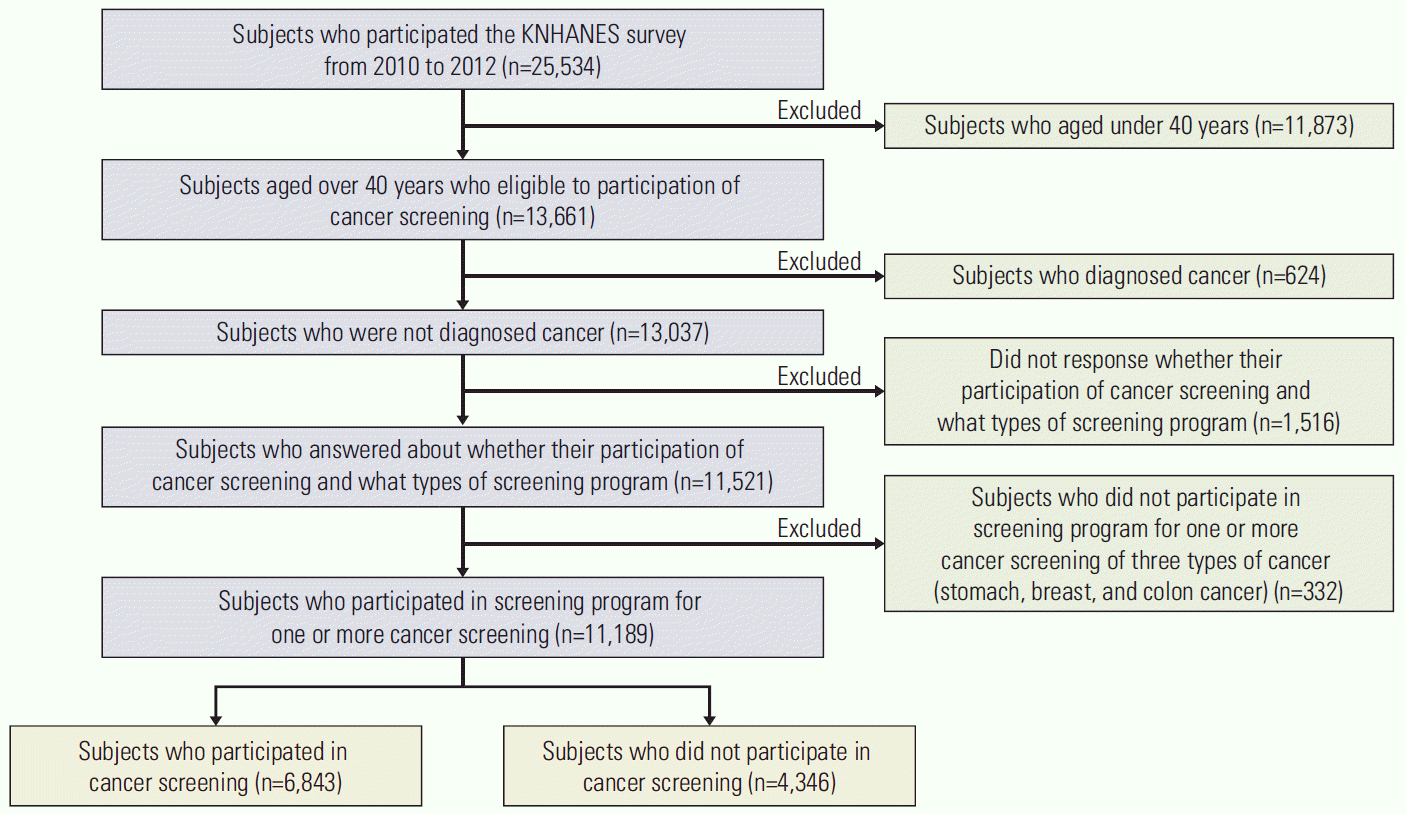
This study was based on data derived from the 2010-2012 KNHANES, a nationwide survey examining the general health and nutrition status of the Korean general population conducted by the Korea Centers for Disease Control and Prevention (KCDC) [15]. The KNHANES relies on four methods of data collection, a health interview survey, a health behavior survey, a health examination, and a health nutrition survey [15]. The sample was selected using a stratified, multistage probability sampling design. Overall, 31,641 subjects from 11,400 households (3,800 households annually) and 573 districts (192 districts annually) were selected based on location and type of residence to achieve representativeness of the entire Korean population [15]. The overall response rate was more than 80% for the 3-year study period (81.7% in 2010, 80.4% in 2011, and 80.0% in 2012). In total, 25,534 individuals participated, and data from 13,661 subjects older than 40 years were analyzed in this study (Fig. 1).
We excluded 624 people who had already been diagnosed with cancer and 1,516 people who did not answer the questions about participation in cancer screening or about the type of cancer screening in which they participated. We also excluded 332 subjects who did not participate in one or more of the screening programs for stomach, breast, or colon cancer because these are the most common cancers in Korea [16].
The final sample consisted of 11,189 participants, and written informed consent was obtained from each participant prior to the survey. The study protocol was approved by the Institutional Review Board of the KCDC (Nos. 2010-02CON-21-C, 2011-02-CON-06-C, and 2012-01-EXP-01-2C).

2. Measurements and variables

Data regarding the variables analyzed in this study were obtained through the health interview and health behavior surveys of the KNHANES. We categorized those who participated in cancer screening programs according to whether they were screened as part of an organized or opportunistic program, as determined by responses to the following question: “In last 2 years, have you undergone a cancer screening?” Respondents were considered to have been screened if they underwent screening for one of three cancers (stomach, colon, and breast cancer), as determined by the following two yes or no questions: (1) “In the last 2 years, have you undergone cancer screening provided by the government or National Health Insurance (NHI) service free of charge or with a coinsurance payment of 5%?” and (2) “In last 2 years, have you undergone cancer screening provided by medical institutions such as hospitals or clinics in exchange for out-of-pocket costs?” We identified those who participated in organized cancer screening with the former question and those who participated in opportunistic cancer screening with the latter question. Subjects who had used both types of screening programs in the last 2 years were considered to have undergone organized screening because this study focused on factors correlated with opportunistic screening even though the government guaranteed organized screening to all Koreans. The Korean government recommends that people aged 40 years or older undergo screening for stomach and breast cancer, and that those aged 50 years or older undergo screening for colorectal cancer.
To identify factors associated with participation in cancer screening, we classified the variables correlated with such screening into four groups: demographic characteristics, socioeconomic characteristics, variables related to health status, and health behaviors. Socioeconomic status was based on education level (four categories), monthly household income (four categories), job level (four categories), and marital status (two categories). We measured health insurance status to identify the effects of type of health insurance and private health insurance on participation in cancer screening programs. In Korea, public universal health insurance is divided into NHI and the MAP.
Because HRQOL has a major influence on the use of healthcare services, including cancer screening [11,14], we added a measure of quality-adjusted life-years (QALY) to the study model and divided the sample into two groups based on whether respondents’ scores on the EQ-5D were or were not in the lowest quintile, 0.854. The influence of comorbid conditions on participation in cancer screening was also examined with an index of comorbidity calculated by totaling each participant’s reported history of the following diseases: hypertension, stroke, cardiovascular disease, arthritis, tuberculosis, asthma, diabetes mellitus, thyroid disease, depression, atopic disease, renal failure, hepatitis B and C, cirrhosis, hyperlipidemia, and chronic obstructive pulmonary disease. The total number of comorbid diseases was categorized into four groups (0, 1, 2, and 3 or more). Health behaviors such as smoking, alcohol consumption, and physical activity were also measured. Respondents were categorized as non-smokers, ex-smokers, and current smokers (three groups), as well as into those who had never consumed alcohol, ex-drinkers or current non-drinkers, light drinkers, and heavy drinkers (four groups). Respondents were classified according to whether they engaged in physical activity less than 1 day per week, 1-4 days per week, or more than 4 days per week (three groups).

3. Statistical analyses

Participation rates in cancer screening programs were compared using the chi-square test according to socioeconomic status, type of health insurance, quality of life, health behaviors, and comorbidity. Survey sample weights were used to produce non-biased estimates for the chi-squared test and logistic regression model [15].
The polychotomous (multinomial) logistic regression model was used to identify correlates of participation in cancer screening programs, including organized and opportunistic screening programs. This model estimated the simultaneous odds ratio (OR) for organized and opportunistic cancer screening and independent variables with respect to unscreened subjects. All statistical analyses were performed with the SAS software ver. 9.3 (SAS Institute, Cary, NC).

Results

1. Study population and participation in cancer screening

Of the 11,189 people aged older than 40 years who participated in the survey, 6,843 (58.6%) had been screened for cancer. The mean age of the study population was 56.1 years, and 82.2% of participants lived with their spouse. More than 52% of the subjects had at least graduated from high school, 96.6% were covered by NHI, and 69.0% had one or more supplementary private health insurance plans.
Of the 6,843 respondents who participated in cancer screening programs, 6,019 (51.1%) participated in the organized screening program and 824 (7.5%) had used an opportunistic screening program and paid out-of-pocket for the full price of the screening. Additionally, 681 respondents used both programs and we categorized those subjects into organized screening. Table 1 presents the overall descriptive statistics for the participants and shows differences in the participation rates in the two screening program types by demographic characteristics, socioeconomic status, quality of life, and health behaviors.
The results revealed significantly different participation rates in the two program types according to demographic and socioeconomic characteristics such as sex, age, education, household income, job, possession of health insurance, quality of life, number of comorbid conditions, and health behaviors (e.g., smoking, drinking, and physical activity). Females were more likely to be screened, but males were more likely to use opportunistic screening programs (8.4%).

2. Factors associated with participation in organized and opportunistic cancer screening programs

The results of the univariate logistic regression analysis are presented in Table 2. All risk factors were significantly associated with participation in the organized screening program for cancer. However, sex, age, and number of comorbid conditions were not significantly associated with participation in opportunistic programs.
Table 3 presents the results of the multivariate logistic regression model. Females were more likely than males to participate in both screening programs and the odd ratios for organized screening was slightly higher than those for opportunistic screening program (OR, 1.59; 95% confidence interval [CI], 1.33 to 1.89 for the organized screening and OR, 1.49; 95% CI, 1.08 to 2.05). Subjects in their 60s were more likely than those in their 30s to be screened for cancer, and the OR for organized screening was slightly higher than those for the opportunistic screening program (OR, 2.28; 95% CI, 1.88 to 2.76 for organized screening and OR, 1.87; 95% CI, 1.34 to 2.62 for opportunistic screening). Currently married respondents were more likely than all others to be screened in organized screening programs (OR, 1.38; 95% CI, 1.18 to 1.61). Having supplementary private health insurance was an important contributor to participation in a screening program (OR, 1.84; 95% CI, 1.59 to 2.13 for organized cancer screening and OR, 1.76; 95% CI, 1.31 to 2.35 for opportunistic cancer screening).
People with a lower quality of life were significantly less likely to participate in opportunistic screening programs (OR, 0.69; 95% CI, 0.52 to 0.89). Suffering from more comorbid conditions was correlated with being screened, especially via opportunistic screening programs (OR, 2.15; 95% CI, 1.39 to 3.32 for opportunistic screening).
Health behaviors such as smoking, drinking, and physical activity were important risk factors correlated with being screened for cancer. Ex-smokers were more likely than current smokers to be screened by both program types (OR, 1.60; 95% CI, 1.37 to 1.89 for organized cancer screening and OR, 1.62; 95% CI, 1.17 to 2.24 for opportunistic cancer screening). The OR for ex-smokers was higher than that for non-smokers. Light drinkers were more likely to be screened than non-drinkers (OR, 1.26; 95% CI, 1.08 to 1.47 for organized cancer screening and OR, 1.42; 95% CI, 1.07 to 1.87 for opportunistic cancer screening). People who engaged in a moderate level of physical activity (1-4 times per week) were more likely to be screened by both types of cancer screening programs than those who did not exercise, and the OR for screening was elevated for opportunistic screening programs (OR, 1.20; 95% CI, 1.05 to 1.38 for organized cancer screening and OR, 1.41; 95% CI, 1.11 to 1.80 for opportunistic cancer screening).

Discussion

Why do people choose to undergo opportunistic screening despite the availability of free or almost free-of-charge organized screening? We used national-level data from the KNHANES V to answer this question. Screening for cancer is a cost-effective approach to reducing the burden of cancer and saving the lives of potential cancer patients [17]. Therefore, the Korean government implemented a universal organized screening program for five types of cancer (stomach, colon, breast, cervical, and liver) in 2005 [3,17]. However, the participation rate in this cancer screening program remains relatively low, and many people use opportunistic screening services. In this study, we sought to identify factors associated with using opportunistic cancer screening programs.
The overall participation rate in cancer screening programs was 58.6% (6,843 subjects; 51.2% for organized cancer screening and 7.5% for opportunistic screening). Specifically, 54.1%, 34.1%, and 32.4% of the subjects were screened for stomach cancer, colorectal cancer, and breast cancer, respectively. The Korean National Cancer Screening Survey (KNCSS) shows participation rate in cancer screening of 33.6% to 73.6% by types of cancer in 2013 [18].
There were several significant differences between those who used organized and opportunistic screening programs. Females and those in their 50s and 60s were more likely to use the organized cancer screening program than males and those in their 40s. Highly educated people were significantly more likely than those who were in the least educated group to participate in organized screening. Interestingly, the probability of participating in opportunistic screening increased as education level increased (p < 0.001).
Those with higher incomes were more likely to be screened using an opportunistic rather than an organized program (OR, 2.17; 95% CI, 1.53 to 3.09 for opportunistic screening vs. OR, 1.23; 95% CI, 1.03 to 1.47 for organized screening). We found little difference between those with and without supplementary private health insurance in the probability of being screened by the two programs (OR, 1.76; 95% CI, 1.30 to 2.37 for opportunistic screening vs. OR, 1.82; 95% CI, 1.57 to 2.12 for organized screening).
We obtained several significant results with respect to health status. The likelihood of participating in opportunistic screening was decreased among those with a poor quality of life, whereas more comorbid conditions increased the likelihood of using both organized and opportunistic screening programs. People with a better HRQOL might be more likely to engage in health behaviors [14]. Indeed, previous studies evaluating the impact of health status indicators on cancer screening have reported that poor subjective health status decreased the likelihood of getting screened, and that the rate of getting screened was higher among those with more chronic diseases [12]. Gandhi et al. [14] reported that poor general and physical health were associated with decreased screening rates. Conversely, another study reported no association between quality of life and participation in colorectal cancer screening [9].
We used the EQ-5D, a simple and widely used tool, to measure health status, including HRQOL. The EQ-5D, which is also commonly used to calculate QALY [11,19], addresses the mobility, self-care, usual activities, pain/discomfort, and anxiety/depression [20]. Therefore, EQ-5D provides an index of not only physical but also mental health. Our results suggest that people with poor quality of life are less likely to receive opportunistic screening, but that individuals who self-reported comorbid conditions were more likely to participate in not only organized screening, but also opportunistic screening. Suh et al. [21] reported that poor subjective health might be associated with a high screening rate for colorectal cancer. Subjective health may be influenced by an awareness of one’s objective health status, such as having a chronic disease. Additionally, the probability of participating in opportunistic screening was much higher than that of participating in organized screening among people with poor subjective health.
Health behaviors were associated with participation in cancer screening programs. The participation rate among people with moderately good health habits was higher than it was among those with extremely good health habits. Ex-smokers were more likely than current smokers to be screened by both types of screening programs. Non-smokers were more likely than current smokers to participate in the organized screening program, which is in accordance with previous results regarding breast and cervical cancer screening among women in the United States [14]. We also found that light drinkers were more likely to be screened by both opportunistic and organized screening programs than non-drinkers, and the OR for opportunistic screening was higher than that for organized screening (OR, 1.36; 95% CI, 1.02 to 1.82 for opportunistic screening vs. OR, 1.26; 95% CI, 1.08 to 1.64 for organized screening). Several previous studies did not reveal significant associations between alcohol consumption and cancer screening behavior [22,23], whereas other studies suggested that drinking was associated with an increased rate of cancer screening [10,23]. However, working with data from the third KNHANES, Kwon et al. [24] found that frequent binge drinkers were less likely to be screened for gastric cancer than non-binge drinkers.
People who engaged in moderate physical activity 1-4 days per week were more likely to be screened by both types of screening programs than were people who did not, and the OR was much higher for opportunistic than for organized screening (OR, 1.41; 95% CI, 1.11 to 1.80 for opportunistic screening vs. OR, 1.20; 95% CI, 1.05 to 1.38 for organized screening). Previous studies have noted that individuals who engaged in physical activity or exercise were more likely to be screened for cancer [14]. Interestingly, we found no relationship between moderate physical activity more than 4 days per week and participating in screening.
Individuals who were screened for one of three cancers (stomach, colon, and breast cancer) were defined as having undergone cancer screening. In Korea, it is recommended that individuals aged 40 years or older undergo screening for stomach and breast cancer once every two years, and that all individuals undergo screening for colon cancer using a fecal occult blood test once per year [3]. In Korea, most people who visit medical institutions to be screened for cancer are screened for one or more types of cancer [3]. In this study, two-thirds (68.9%) of those who participated in a cancer screening program were screened for more than two or more types of cancer.
It is important to understand why people visit medical institutions for opportunistic rather than organized screening for cancer. In this regard, convenience should be considered. For example, a colonoscopy is not accepted as a primary screening method for colorectal cancer in Korea and in other Westernized countries [3,25]. However, a colonoscopy is the preferred test for this purpose because it allows visualization of the entire large bowel and immediate removal of clinically significant precancerous lesions [25]. Therefore, people seeking to be screened for this condition might choose to undergo opportunistic screening because they can receive a colonoscopy. Second, people tend to believe that those who perform opportunistic screenings are more qualified than those who perform organized screening.
It is important to note that this study has several limitations. First, we did not consider the effect of family history of cancer on cancer screening behavior because the KNHANES did not include relevant questions. However, the health belief model indicates that the perception that one is at risk for developing a certain disease may influence preventive health behaviors [26,27], and previous studies have found a positive association between family history and cancer screening [21,28,29]. Conversely, screened people were less likely to perceive that they were at risk of developing cancer [30]; therefore, additional research is required to determine the effects of family history on cancer screening. Second, KNHANES data describing cancer screening, socioeconomic status, health status, and health behaviors are self-reported based on a cross-sectional design. Therefore, recall bias and interviewer bias may have affected our results despite the interviewers’ efforts to control these phenomena [21]. Third, we could not identify factors associated with each type of cancer screening program because this study assumed that individuals visiting medical institutions for screening might participate in one or more types of cancer screening. However, it is necessary to consider that factors related to cancer screening behavior would differ based on cancer type. Most previous studies focused on one type of cancer screening program. However, the present study defined screened individual as those who had received screening for three types of cancer (stomach, colon, and breast cancer).
Finally, we categorized people screened for cancer into two groups; those who participated in organized and opportunistic screening. If individuals used both programs, we placed them into the organized screening group because this study focused why some people participated in opportunistic screening although the entire population can use organized screening. Overall, 681 people used both programs; therefore, it is necessary to identify the characteristics of people who used both screening programs in a future study.
Despite these limitations, this study relied on data from a nationwide sample with a high response rate. Therefore, our results may be representative of the general population of Korea.

Conclusion

In conclusion, we identified factors that are more strongly associated with participation in opportunistic than organized cancer screening. Those who were married, highly educated, high earners, in better quality of life, light drinkers, and who engaged in moderate physical activity 1-4 days per week were more likely than others to undergo opportunistic screening.

Notes

Conflict of interest relevant to this article was not reported.

ACKNOWLEDGMENTS

This work was supported by the Soonchunhyang University Research Fund (No. 20130589).

References

1. Korean National Statistical Office. Annual report on the cause of death statistics in 2014. Daejeon: Korean National Statistical Office;2015.
2. Hahm MI, Choi KS, Park EC, Kwak MS, Lee HY, Hwang SS. Personal background and cognitive factors as predictors of the intention to be screened for stomach cancer. Cancer Epidemiol Biomarkers Prev. 2008; 17:2473–9.
crossref
3. Ministry of Health and Welfare. A guide for National Cancer Screening Program in 2015. Sejong: Ministry of Health and Welfare;2015.
4. Lee HY, Park EC, Jun JK, Hahm MI, Jung KW, Kim Y, et al. Trends in socioeconomic disparities in organized and opportunistic gastric cancer screening in Korea (2005-2009). Cancer Epidemiol Biomarkers Prev. 2010; 19:1919–26.
crossref
5. Kim MH, Kim CY, Park YK, Park YY, Cho HJ. How did health examination including screening developed to a industry? Seoul: People's Health Institute;2015.
6. Kim KH, Park EC, Hahm MI. The gap between physicians and the public in satisfaction with the National Health Insurance system in Korea. J Korean Med Sci. 2012; 27:579–85.
crossref
7. Yeo JY, Jeong HS. Determinants of health screening and its effects on health behaviors. Health Policy Manag. 2012; 22:49–64.
crossref
8. Hahm MI, Choi KS, Lee HY, Jun JK, Oh D, Park EC. Who participates in the gastric cancer screening and on-time rescreening in the National Cancer Screening Program? A population-based study in Korea. Cancer Sci. 2011; 102:2241–7.
crossref
9. Mahabaleshwarkar R, Khanna R, West-Strum D, Yang Y. Association between health-related quality of life and colorectal cancer screening. Popul Health Manag. 2013; 16:178–89.
crossref
10. Kang M, Yoo KB, Park EC, Kwon K, Kim G, Kim DR, et al. Factors associated with organized and opportunistic cancer screening: results of the Korea National Health and Nutrition Examination Survey (KNHANES) 2007-2011. Asian Pac J Cancer Prev. 2014; 15:3279–86.
crossref
11. Park K, Park JH, Park JH, Kim HJ, Park BY. Does health status influence intention regarding screening mammography? Jpn J Clin Oncol. 2010; 40:227–33.
crossref
12. Deshpande AD, McQueen A, Coups EJ. Different effects of multiple health status indicators on breast and colorectal cancer screening in a nationally representative US sample. Cancer Epidemiol. 2012; 36:270–5.
crossref
13. Suzuki R, Wallace PM, Small E. Race, health-related quality of life and colorectal cancer screening rates in the National Health Interview Survey. Am J Health Behav. 2015; 39:132–9.
crossref
14. Gandhi PK, Gentry WM, Kibert JL 2nd, Lee EY, Jordan W, Bottorff MB, et al. The relationship between four health-related quality-of-life indicators and use of mammography and Pap test screening in US women. Qual Life Res. 2015; 24:2113–28.
crossref
15. Korean Centers for Disease Control and Prevention. National Health and Nutrition Examination Survey: Analytic Guideline (2010-2012). Osong: Korean Centes for Disease Control and Prevention;2014.
16. Jung KW, Won YJ, Kong HJ, Oh CM, Cho H, Lee DH, et al. Cancer statistics in Korea: incidence, mortality, survival, and prevalence in 2012. Cancer Res Treat. 2015; 47:127–41.
crossref
17. Lee WC. Evidence-based National Cancer Screening Program of Korea. J Korean Med Assoc. 2011; 54:1028–35.
crossref
18. Suh M, Choi KS, Park B, Lee YY, Jun JK, Lee DH, et al. Trends in cancer screening rates among Korean men and women: results of the Korean National Cancer Screening Survey, 2004-2013. Cancer Res Treat. 2016; 48:1–10.
crossref
19. Hong JY, Kim SY, Chung KS, Kim EY, Jung JY, Park MS, et al. Factors associated with the quality of life of Korean COPD patients as measured by the EQ-5D. Qual Life Res. 2015; 24:2549–58.
crossref
20. EuroQol. EQ-5D-3L user guide: basic information on how to use the EQ-5D-3L instrument. Rotterdam: EuroQol;2013.
21. Suh M, Choi KS, Lee HY, Hahm MI, Lee YY, Jun JK, et al. Socioeconomic disparities in colorectal cancer screening in Korea: a nationwide cross-sectional study. Medicine (Baltimore). 2015; 94:e1368.
22. Myong JP, Shin JY, Kim SJ. Factors associated with participation in colorectal cancer screening in Korea: the Fourth Korean National Health and Nutrition Examination Survey (KNHANES IV). Int J Colorectal Dis. 2012; 27:1061–9.
crossref
23. Cho J, Guallar E, Hsu YJ, Shin DW, Lee WC. A comparison of cancer screening practices in cancer survivors and in the general population: the Korean national health and nutrition examination survey (KNHANES) 2001-2007. Cancer Causes Control. 2010; 21:2203–12.
crossref
24. Kwon YM, Lim HT, Lee K, Cho BL, Park MS, Son KY, et al. Factors associated with use of gastric cancer screening services in Korea. World J Gastroenterol. 2009; 15:3653–9.
crossref
25. Pizzo E, Pezzoli A, Stockbrugger R, Bracci E, Vagnoni E, Gullini S. Screenee perception and health-related quality of life in colorectal cancer screening: a review. Value Health. 2011; 14:152–9.
crossref
26. Lipkus IM, Lyna PR, Rimer BK. Colorectal cancer risk perceptions and screening intentions in a minority population. J Natl Med Assoc. 2000; 92:492–500.
27. Abolfotouh MA, BaniMustafa AA, Mahfouz AA, Al-Assiri MH, Al-Juhani AF, Alaskar AS. Using the health belief model to predict breast self examination among Saudi women. BMC Public Health. 2015; 15:1163.
crossref
28. Walker MJ, Mirea L, Glendon G, Ritvo P, Andrulis IL, Knight JA, et al. Does perceived risk predict breast cancer screening use? Findings from a prospective cohort study of female relatives from the Ontario site of the breast cancer family registry. Breast. 2014; 23:482–8.
crossref
29. Kim JH, Park EC, Yoo KB. Impact of perceived cancer risk on the cancer screening rate in the general Korean population: results from the Korean health panel survey data. Asian Pac J Cancer Prev. 2014; 15:10525–9.
crossref
30. Li J, Hart TL, Aronson M, Crangle C, Govindarajan A. Cancer worry, perceived risk and cancer screening in first-degree relatives of patients with familial gastric cancer. J Genet Couns. 2016; 25:520–8.
crossref

Fig. 1.
Flow chart of study subjects. KNHANES, Korean National Health and Nutrition Examination Survey.
crt-2016-243f1.tif
Table 1.
Participation in cancer screening in Korea by demographic characteristics, socioeconomic status, health status, and health behaviors (2010-2012)
Variable Total Overall screening (A+B) Not screened Screened
p-valuea)
Organized screening (A) Opportunistic screening (B)
Total 11,189 (100) 6,843 (58.6) 4,346 (41.4) 6,019 (51.1) 824 (7.5)
Sex
 Male 4,855 (43.4) 2,766 (53.9) 2,089 (46.1) 2,362 (45.8) 404 (8.1) < 0.001
 Female 6,334 (56.6) 4,077 (63.1) 2,257 (36.9) 3,657 (56.2) 420 (6.9)
Age (yr)
 40-49 2,788 (35.9) 1,645 (55.4) 1,143 (44.6) 1,401 (47.0) 244 (8.4) < 0.001
 50-59 3,063 (30.6) 2,042 (63.7) 1,021 (36.3) 1,774 (55.0) 268 (8.7)
 60-69 2,762 (17.8) 1,893 (66.9) 869 (33.1) 1,685 (59.9) 208 (7.0)
 ≥ 70 2,576 (15.7) 1,263 (46.7) 1,313 (53.3) 1,159 (43.2) 104 (3.5)
Marital status
 Married 9,128 (82.7) 5,788 (60.6) 3,340 (39.4) 5,062 (52.6) 726 (8.0) < 0.001
 Otherb) 2,050 (17.3) 971 (49.5) 906 (49.2) 879 (45.2) 92 (5.6)
Education
 ≤ Elementary school 4,180 (31.7) 2,356 (55.3) 1,824 (44.7) 2,168 (50.7) 188 (4.6) < 0.001
 Junior high school 1,684 (15.6) 1,069 (61.7) 615 (38.3) 945 (54.5) 124 (7.2)
 High school 3,199 (32.4) 2,049 (59.4) 1,150 (40.6) 1,791 (51.2) 258 (8.3)
 ≥ College 2,108 (20.3) 1,360 (60.4) 748 (39.6) 1,107 (49.3) 253 (11.1)
Household income
 Fourth quartile 2,864 (21.8) 1,525 (51.0) 1,339 (49.0) 1,412 (47.1) 113 (3.9) < 0.001
 Third quartile 2,808 (26.9) 1,714 (57.7) 1,094 (42.3) 1,534 (51.2) 180 (6.5)
 Second quartile 2,628 (25.6) 1,671 (60.4) 957 (39.6) 1,485 (53.1) 186 (7.3)
 First quartile 2,757 (25.7) 1,866 (64.7) 891 (35.3) 1,538 (53.3) 328 (11.4)
Type of employment
 Unemployed 4,681 (34.6) 2,797 (57.3) 1,884 (42.7) 2,495 (51.2) 302 (6.1) < 0.001
 Employee 3,212 (33.3) 2,060 (61.9) 1,152 (38.1) 1,818 (54.1) 242 (7.9)
 Employer or self-employed 2,529 (25.6) 1,490 (55.6) 1,039 (44.4) 1,257 (46.3) 233 (9.3)
 Family business employee 748 (6.4) 486 (60.9) 262 (39.1) 441 (55.2) 45 (5.7)
Public health insurance
 Medical Aid 359 (3.4) 181 (49.4) 178 (50.6) 172 (46.1) 9 (3.3) 0.006
 National Health Insurance 10,773 (96.6) 6,642 (59.1) 4,131 (40.9) 5,830 (51.4) 812 (7.7)
Supplementary private health insurance
 No 4,040 (31.0) 2,067 (47.7) 1,973 (52.3) 1,871 (43.1) 196 (4.6) < 0.001
 Yes 7,021 (69.0) 4,707 (63.9) 2,314 (36.1) 4,088 (55.0) 619 (8.8)
EQ-5D utility score
 Upper four quintiles (> 0.854) 8,455 (79.3) 5,318 (59.7) 3,137 (40.3) 4,621 (51.4) 697 (8.3) < 0.001
 Lowest quintile (≤ 0.854) 2,725 (20.7) 1,521 (54.5) 1,204 (45.5) 1,394 (50.2) 127 (4.3)
No. of comorbid conditions
 0 5,527 (56.0) 3,310 (56.7) 2,217 (43.3) 2,909 (49.3) 401 (7.4) 0.008
 1 3,012 (24.9) 1,883 (61.0) 1,129 (39.0) 1,643 (53.1) 240 (7.9)
 2 1,695 (12.4) 1,056 (62.1) 639 (37.9) 940 (54.6) 116 (7.5)
 ≥ 3 955 (6.7) 594 (59.7) 361 (40.3) 527 (52.8) 67 (6.9)
Smoking status
 Non-smoker 6,536 (53.5) 4,219 (62.9) 2,317 (37.1) 3,768 (55.9) 451 (7.0) < 0.001
 Ex-smoker 2,561 (23.0) 1,589 (60.4) 972 (39.6) 1,352 (51.4) 237 (9.0)
 Current smoker 2,055 (23.5) 1,015 (47.2) 1,040 (52.8) 881 (40.2) 134 (7.0)
Alcohol consumption
 Non-drinker 2,066 (15.2) 1,194 (55.9) 872 (44.1) 1,081 (50.3) 113 (5.6) < 0.001
 Ex-drinker 1,717 (14.1) 999 (56.7) 718 (43.3) 895 (50.7) 104 (6.0)
 Light drinker 4,936 (45.3) 3,218 (62.1) 1,718 (37.9) 2,807 (53.6) 411 (8.4)
 Heavy drinker 2,399 (25.3) 1,389 (55.1) 1,010 (44.9) 1,195 (47.2) 194 (7.9)
Physical activity
 None (less than 1 day per week) 7,349 (66.7) 4,351 (56.7) 2,998 (43.3) 3,841 (50.1) 510 (6.6) < 0.001
 1-4 days per week 2,409 (24.3) 1,587 (62.5) 822 (37.5) 1,366 (52.4) 221 (10.0)
 More than 4 days per week 978 (9.0) 626 (62.1) 352 (37.9) 562 (55.2) 64 (6.9)

a) Results of the chi-square test among three groups (not screened, organized cancer screening, and opportunistic cancer screening),

b) Unmarried, divorced, or widowed.

Table 2.
Results of univariate logistic regression analyses identifying risk factors for organized and opportunistic screening
Variable Organized screening
Opportunistic screening
OR 95% CI OR 95% CI
Total
Sex
 Male 1.00 1.00
 Female 1.53 1.40-1.68 1.08 0.91-1.28
Age (yr)
 40-49 1.00 1.00
 50-59 1.44 1.25-1.65 1.27 0.98-1.65
 60-69 1.72 1.49-1.97 1.13 0.86-1.48
 ≥ 70 0.77 0.65-0.90 0.35 0.26-0.48
Marital status
 Othera) 1.00 1.00
 Married 1.52 1.33-1.73 2.02 1.56-2.63
Education
 ≤ Elementary school 1.00 1.00
 Junior high school 1.26 1.08-1.46 1.85 1.36-2.53
 High school 1.11 0.97-1.28 2.00 1.54-2.61
 ≥ College 1.10 0.95-1.27 2.75 2.07-3.65
Household income
 Fourth quartile 1.00 1.00
 Third quartile 1.26 1.09-1.45 1.94 1.43-2.62
 Second quartile 1.40 1.21-1.61 2.32 1.69-3.20
 First quartile 1.57 1.35-1.83 4.07 3.09-5.38
Type of employment
 Unemployed 1.00 1.00
 Employee 1.18 1.06-1.32 1.44 1.15-1.80
 Employer or self-employed 0.87 0.76-1.00 1.46 1.14-1.87
 Family business employee 1.18 0.96-1.44 1.02 0.66-1.59
Public health insurance
 Medical Aid 1.00 1.00
 National Health Insurance 1.38 1.05-1.81 2.85 1.24-6.54
Supplementary private health insurance
 No 1.00 1.00
 Yes 1.85 1.65-2.07 2.75 2.17-3.50
EQ-5D utility score
 Upper four quintiles (> 0.854) 1.00 1.00
 Lowest quintile (≤ 0.854) 0.87 0.77-0.97 0.46 0.36-0.57
No. of comorbid conditions
 0 1.00 1.00
 1 1.20 1.07-1.34 1.19 0.95-1.49
 2 1.26 1.09-1.46 1.17 0.88-1.54
 ≥ 3 1.15 0.96-1.38 1.01 0.70-1.46
Smoking status
 Current smoker 1.00 1.00
 Ex-smoker 1.70 1.48-1.96 1.71 1.28-2.29
 Non-smoker 1.98 1.74-2.24 1.42 1.11-1.82
Alcohol consumption
 Non-drinker 1.00 1.00
 Ex-drinker 1.03 0.86-1.22 1.08 0.76-1.53
 Light drinker 1.24 1.07-1.43 1.75 1.31-2.33
 Heavy drinker 0.92 0.78-1.09 1.37 1.00-1.89
Physical activity
 None (less than 1 day per week) 1.00 1.00
 1-4 days per week 1.21 1.06-1.37 1.76 1.39-2.22
 More than 4 days per week 1.26 1.04-1.53 1.20 0.83-1.74

OR, odds ratio; CI, confidence interval.

a) Unmarried, divorced, or widowed.

Table 3.
Results of multivariate logistic regression analyses identifying risk factors for organized and opportunistic screening
Variable Organized screening
Opportunistic screening
OR 95% CI OR 95% CI
Total
Sex
 Male 1.00 1.00
 Female 1.59 1.33-1.89 1.49 1.08-2.05
Age (yr)
 40-49 1.00 1.00
 50-59 1.51 1.28-1.77 1.32 0.99-1.77
 60-69 2.28 1.88-2.76 1.74 1.24-2.45
 ≥ 70 1.45 1.14-1.83 0.89 0.57-1.37
 p-value for trenda) < 0.0001 0.0766
Marital status
 Otherb) 1.00 1.00
 Married 1.38 1.18-1.61 1.23 0.90-1.68
Education
 ≤ Elementary school 1.00 1.00
 Junior high school 1.18 0.99-1.39 1.32 0.92-1.88
 High school 1.14 0.96-1.35 1.47 1.05-2.07
 ≥ College 1.21 0.99-1.48 2.00 1.36-2.95
 p-value for trenda) 0.4028 0.0006
Household income
 Fourth quartile 1.00 1.00
 Third quartile 1.11 0.94-1.30 1.34 0.93-1.92
 Second quartile 1.15 0.98-1.35 1.43 0.98-2.08
 First quartile 1.23 1.03-1.47 2.19 1.54-3.12
 p-value for trenda) 0.0080 < 0.0001
Type of employment
 Unemployed 1.00 1.00
 Employee 1.21 1.06-1.39 1.07 0.82-1.40
 Employer or self-employed 0.91 0.78-1.07 1.11 0.83-1.48
 Family business employee 0.94 0.76-1.17 0.79 0.50-1.25
 p-value for trenda) 0.2442 0.9729
Public health insurance
 Medical Aid 1.00 1.00
 National Health Insurance 0.78 0.57-1.06 1.03 0.42-2.55
Supplementary private health insurance
 No 1.00 1.00
 Yes 1.84 1.59-2.13 1.76 1.31-2.35
EQ-5D utility score
 Upper four quintiles (> 0.854) 1.00 1.00
 Lowest quintile (≤ 0.854) 0.95 0.83-1.10 0.69 0.52-0.89
No. of comorbid conditions
 0 1.00 1.00
 1 1.23 1.07-1.41 1.49 1.16-1.92
 2 1.31 1.11-1.55 1.90 1.33-2.72
 ≥ 3 1.33 1.08-1.64 2.15 1.39-3.32
 p-value for trenda) < 0.0001 < 0.0001
Smoking status
 Current smoker 1.00 1.00
 Ex-smoker 1.60 1.37-1.89 1.62 1.17-2.24
 Non-smoker 1.46 1.21-1.76 1.26 0.85-1.85
 p-value for trenda) < 0.0001 0.0532
Alcohol consumption
 Non-drinker 1.00 1.00
 Ex-drinker 1.13 0.93-1.37 1.05 0.74-1.49
 Light drinker 1.26 1.08-1.47 1.42 1.07-1.87
 Heavy drinker 1.19 0.96-1.47 1.23 0.87-1.73
 p-value for trenda) 0.0238 0.0452
Physical activity
 None (less than 1 day per week) 1.00 1.00
 1-4 days per week 1.20 1.05-1.38 1.41 1.11-1.80
 More than 4 days per week 1.19 0.97-1.46 1.08 0.73-1.58
 p-value for trenda) 0.0068 0.0548

OR, odds ratio; CI, confidence interval.

a) Calculated using continuous values,

b) Unmarried, divorced, or widowed.

TOOLS
Similar articles