Introduction
Materials and Methods
1. Tissue samples and immunohistochemistry
2. Cell cultures
3. Small interfering RNA transfection
4. Cell proliferation assay
5. Propidium iodide uptake assay
6. Migration assay
7. γ-Secretase inhibitor treatment
8. Western blotting analysis
9. Statistical analysis
Results
1. Expression of activated Notch1 in thyroid cancer patient tissues and thyroid cancer cell lines
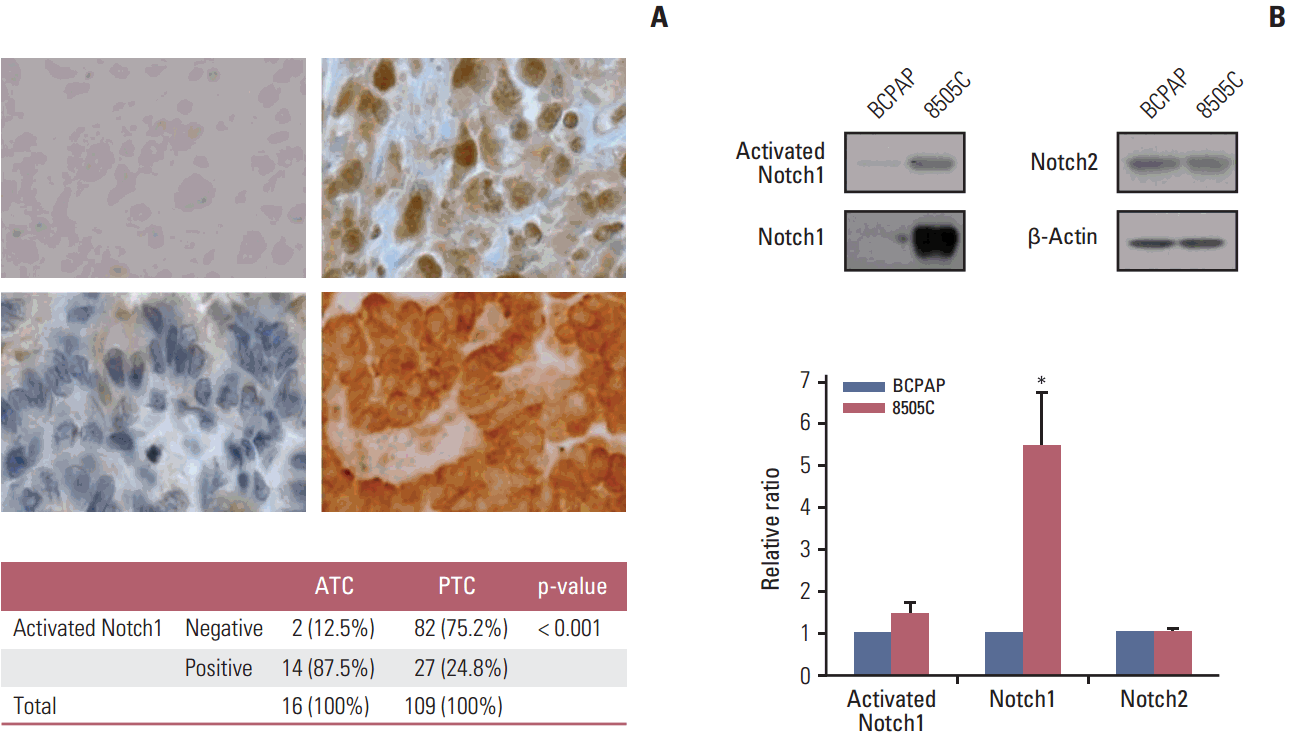 | Fig. 1.Expression of activated Notch1 in patient tissues and thyroid cancer cell lines. (A) Immunohistochemical analysis of activated Notch1 expression in anaplastic (upper left, negative; upper right, positive; ×400) and papillary (lower left, negative; lower right, positive; ×400) thyroid cancer tissues. (B) Western blot analysis of activated Notch1, Notch1, and Notch2 expression in BCPAP and 8505C thyroid cancer cell lines. Each graph shows the target protein expression ratio normalized to β-actin. Statistical significance is based on the difference when compared with BCPAP cells, *p < 0.05. ATC, anaplastic thyroid cancer; PTC, papillary thyroid cancer. |
2. Knockdown of Notch1 reduced cell viability in ATC cell lines
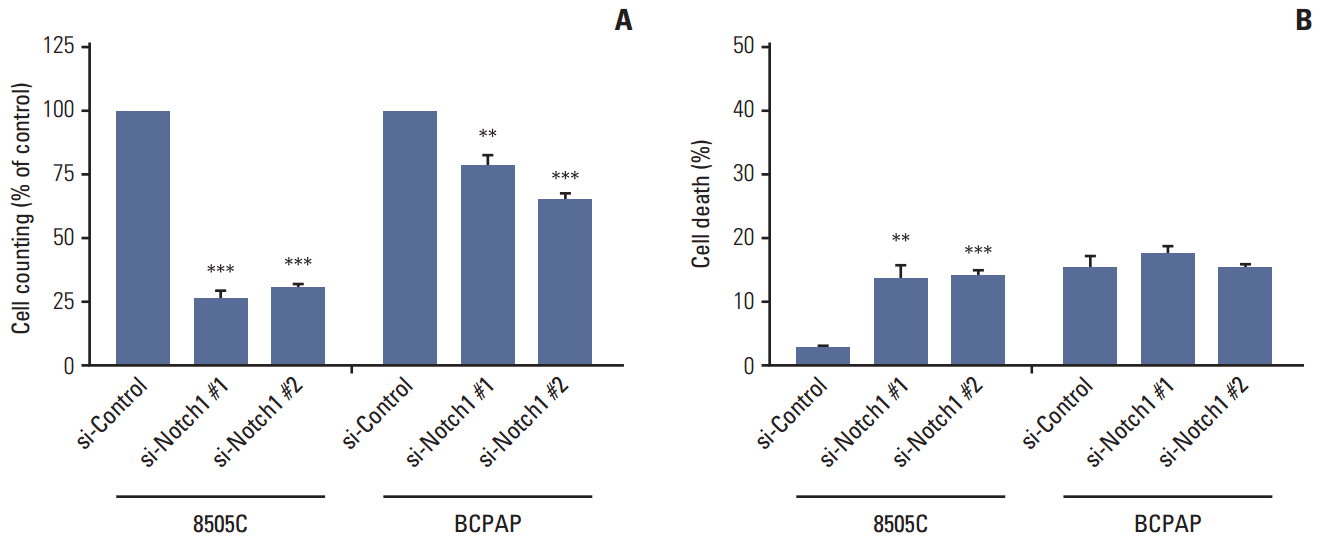 | Fig. 2.Knockdown of Notch1 reduced cell viability in anaplastic thyroid cancer cell lines. 8505C and BCPAP cells were transfected with si-control or si-Notch1 for 72 hours, after which proliferation was determined by cell counting (A) and propidium iodide uptake (B). Statistical significance is based on the difference when compared with si-control cells, **p < 0.01, ***p < 0.001. |
3. Knockdown of Notch1 inhibited cell migration in ATC cell lines
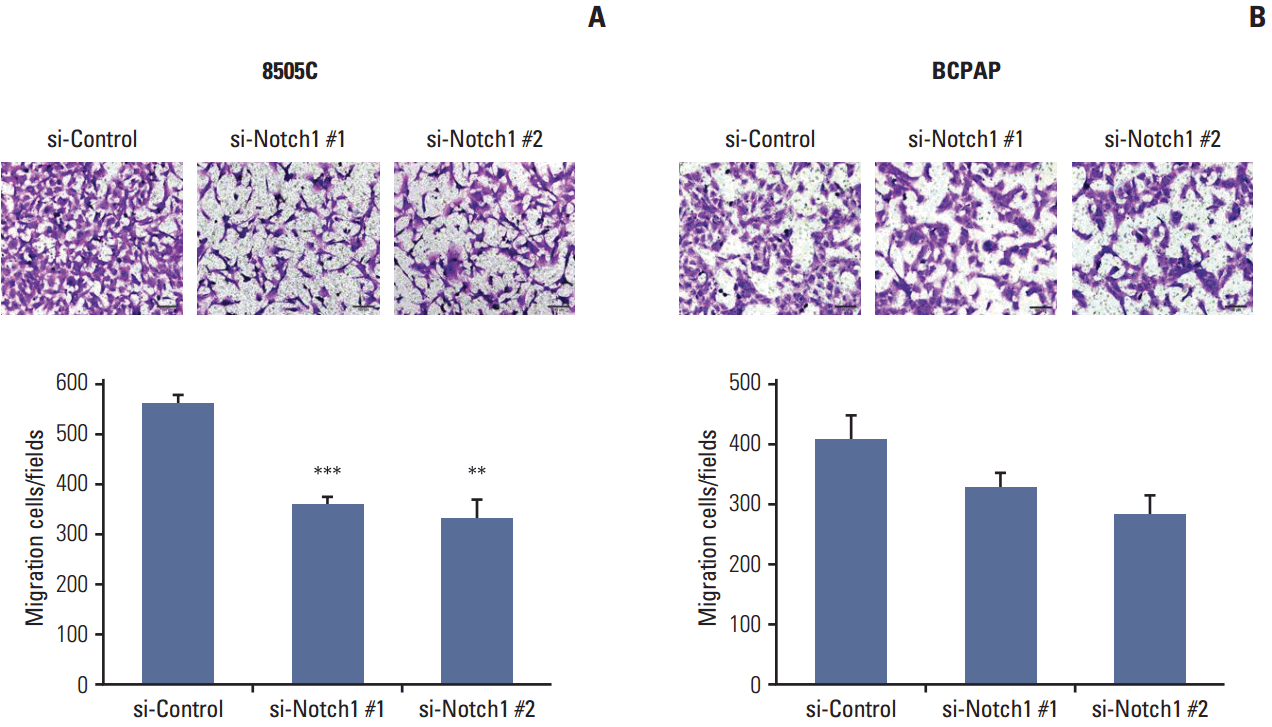 | Fig. 3.Knockdown of Notch1 inhibited cell migration in anaplastic thyroid cancer cell lines. For the analysis of cell migration, 8505C (A) and BCPAP (B) cells in which Notch1 was knocked down were plated into transwell inserts, and 10% fetal bovine serum was used in the medium in the bottom chambers. After 48 hours, migration of thyroid cancer cells was quantified (×100). Statistical significance is based on the difference when compared with si-control cells, **p < 0.01, ***p < 0.001. |
4. DAPT reduced cell viability and cell migration in ATC cell lines
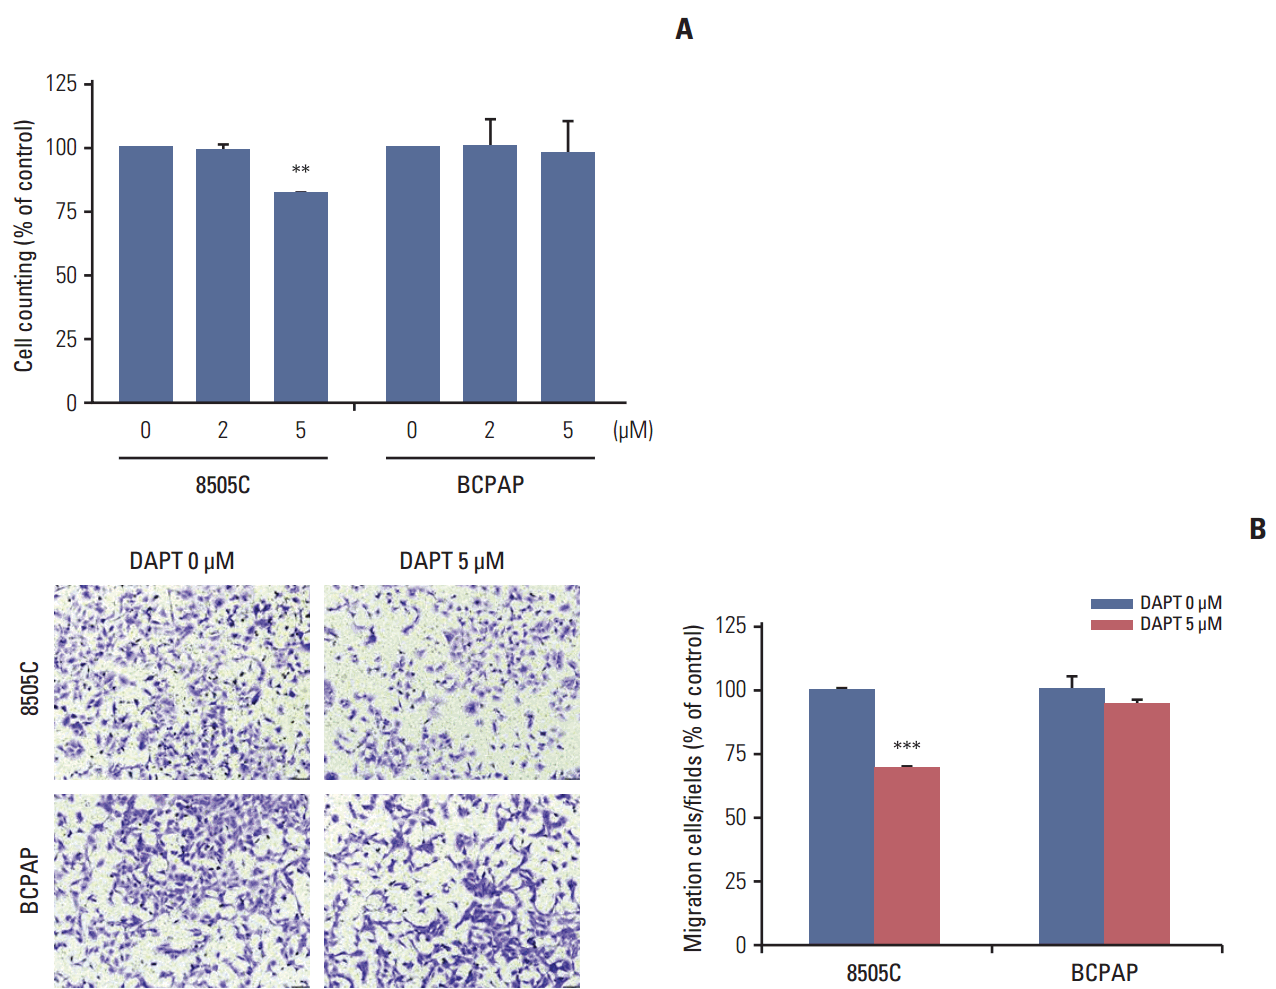 | Fig. 4.DAPT reduced cell viability and cell migration in anaplastic thyroid cancer cell lines. (A) 8505C and BCPAP cells were treated with various concentrations of DAPT for 72 hours, after which proliferation was determined by cell counting. (B) The migration cells were stained with crystal violet and the images were photographed (×100). Statistical significance is based on the difference when compared with untreated cells, **p < 0.01, ***p < 0.001. DAPT, N-[N-(3,5-difluorophenacetyl)-L-alanyl]-S-phenylglycine t-butyl ester. |
5. Knockdown of Notch1 attenuated CSC- and EMT-related markers
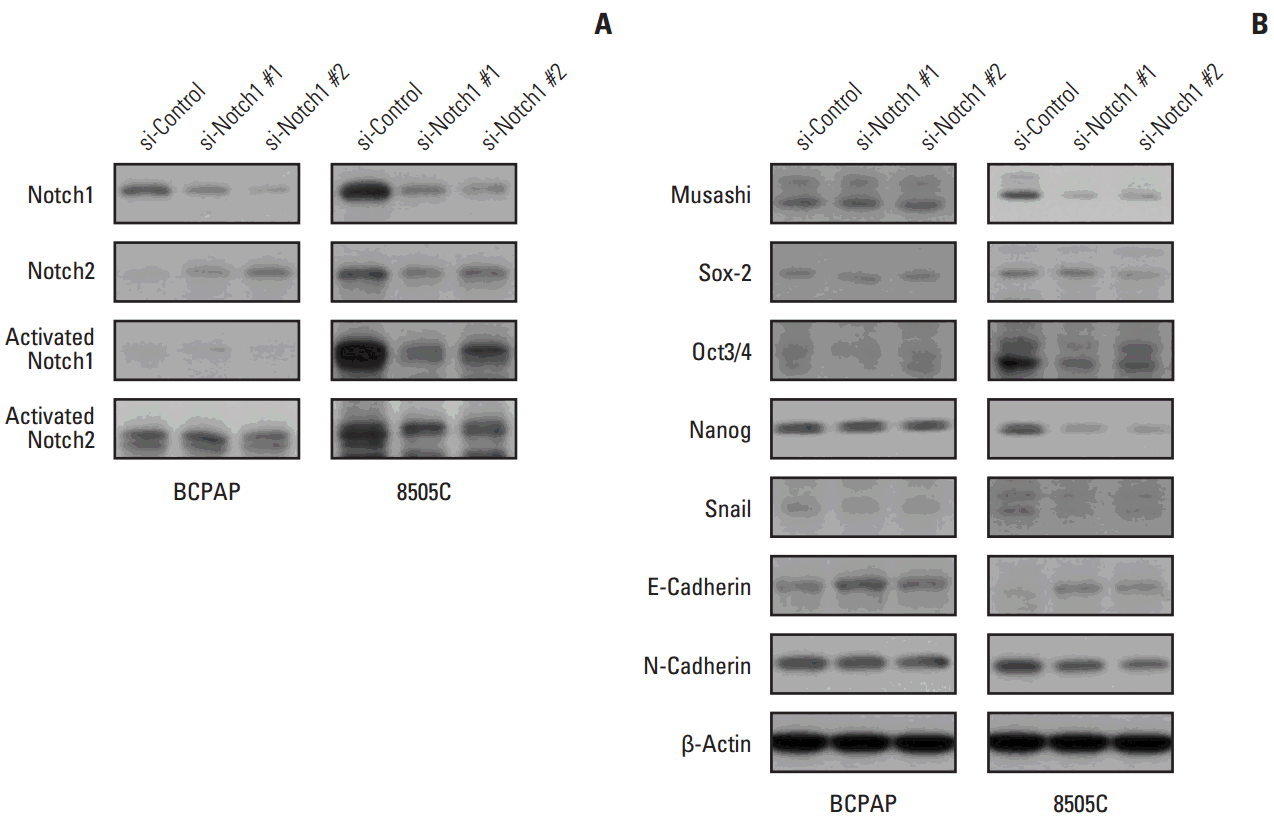 | Fig. 5.Knockdown attenuated cancer stem cell (CSC)– and epithelial-mesenchymal transition (EMT)–related markers. 8505C and BCPAP cells were transfected with si-control or si-Notch1 for 72 hours. Total cell lysates were prepared, Notch1, Notch2, activated Notch1, activated Notch2 (A), and CSC- and EMT-related protein expression (B) were detected by western blot analysis. |


 PDF
PDF Citation
 Print
Print


 XML Download