Abstract
Purpose
The current study was undertaken to examine the trends in the lung cancer incidence, mortality, and survival after a diagnosis in Korea.
Materials and Methods
Lung cancer incidence data according to the histologic type and mortality data were obtained from the Korea Central Cancer Registry and the Statistics Korea, respectively. The age-standardized incidence and mortality rates were calculated, and the Joinpoint model and age-period-cohort analyses were used to describe the trends in the rates. The 5-year relative survival rates of lung cancer were also calculated.
Results
Although the number of new lung cancer cases increased between 1999 and 2012, the age-standardized incidence rate decreased by 0.9% per year in men, whereas the incidence in women increased by 1.7% per year over the same time. Until 2010, the most common histologic type in men was squamous cell carcinoma, then adenocarcinoma prevailed thereafter. Since 1999, the most frequent histological type in women was adenocarcinoma. The lung cancer mortality started to decrease in 2002, with a more apparent decline for the younger age groups in both men and women. Overall, the 5-year relative survival rates have improved significantly from 11.2% for men and 14.7% for women among patients diagnosed between 1993 and 1997 to 19.3% for men and 28.2% for women among patients diagnosed between 2008 and 2012, respectively. An improvement in survival rate was observed for all major histology groups.
Lung cancer has been the most common cancer in both incidence and mortality worldwide [1]. However, a decrease in lung cancer incidence and mortality has been observed in men in many developed countries, whereas an increase or no significant changes have been observed in women. When the histological types of lung cancer are considered, the incidence of squamous cell carcinoma and small cell carcinomas has been decreasing, whereas the incidence of adenocarcinomas has been increasing in both men and women [2-5]. This may be explained by changes in the prevalence of tobacco smoking, which is the most important risk factor for lung cancer and accounts for 70%-90% of the lung cancer burden [6,7]. The strongest association between smoking and lung cancer is observed for squamous cell carcinoma and small cell carcinomas (odds ratio, 63 to 111 for smokers > 30 cigarettes/day), but this association is still quite high for adenocarcinomas (odds ratio, 19 to 21 for smokers > 30 cigarettes/day) [8].
In Korea, the lung cancer mortality in both sexes as well as the incidence in men have decreased, whereas the incidence in women has increased over the last few decades [9]. In addition, early detection by screening and the introduction of new chemotherapy and molecular targeted-agents may improve the survival of lung cancer patients. The objectives of the current study were to examine the trends in the lung cancer incidence, mortality, and survival in Korea. For the incidence and survival, the trends for each histological type were also assessed.
The Korea Central Cancer Registry (KCCR), a nation-wide, hospital-based cancer registry, was initiated by the Ministry of Health and Welfare, Korea in 1980. Since 1999, the KCCR expanded the cancer registration to cover the entire Korean population under the Population-Based Regional Cancer Registry program. The age- (5-year intervals) and sex-specific incidence rates and the number of cases for lung cancer patients between 1999 and 2012 were obtained from the Korea National Cancer Incidence Database. The histological subtypes of lung cancer were classified as follows: carcinomas (International Classification of Diseases for Oncology third edition morphological codes 8010-8576), sarcoma (8800-8811, 8830, 8840-8921, 8990-8991, 9040, 9044, 9120-9133, 9150, and 9540-9581), other specified cancers, including pulmonary blastoma, and unspecified (8000-8005). Carcinomas were further classified as follows: squamous cell carcinoma (8050-8078 and 8083-8084), adenocarcinoma (8140, 8211, 8230-8231, 8250-8260, 8323, 8480-8490, 8550-8551, 8570-8574, and 8576), small-cell carcinoma (8041-8045 and 8246), large-cell carcinoma (8010-8012, 8014-8031, 8035, and 8310), and other specified carcinomas.
The age-standardized rates (ASRs) were calculated using the mid-year population of 2000 as the standard population. The annual percent changes (APC) for the incidence rates were calculated based on a linear model using the following formula: (exp(b)−1)×100, where b is the slope of the regression of the natural logarithm of the ASR in a calendar year [10]. The 95% confidence intervals were obtained with a standard error from the fit of the regression and the t-distribution function [11]. All analyses were stratified according to sex.
The lung cancer mortality data were obtained from the Statistics Korea for the years 1983-2013 (http://kosis.kr/). The ASRs for mortality, as well as the truncated rates for the four age groups (0-39, 40-59, 60-69, and ≥ 70 years) were estimated using the mid-year population of 2000 as the standard population. The trends in lung cancer mortality were tested using Joinpoint regression models, using Joinpoint software ver. 3.5.3 [12]. A maximum of four Joinpoints were allowed, and the default settings were used.
To evaluate the birth cohort effects on lung cancer mortality, 5-year age groups starting at age 20 years were categorized. The age-specific mortality rates were illustrated by the birth cohort. To evaluate the birth-cohort effects after adjusting for age and period effects, a log-linear model using the intrinsic estimator method was performed on the assumption that the number of deaths in each age group followed a Poisson distribution [13].
The survival duration for registered lung cancer patients was determined as the interval between the date of the initial diagnosis and the date of death, date of loss to follow-up, or closing date for follow-up. The 5-year relative survival rates were calculated using the Ederer II method [14] based on an algorithm written in SAS by Dickman [15] with minor modifications. The 5-year relative survival rates of 1993-1997 and 2008-2012 were compared by the percentage changes. In addition, the excess risk model with a Poisson error structure was used to determine the difference in survival between 1993-1997 and 2008-2012 [16]. Statistical analysis was performed using Stata/SE 12.0 for Windows (StataCorp LP, College Station, TX) and SAS ver. 9.3 software (SAS Institute Inc., Cary, NC).
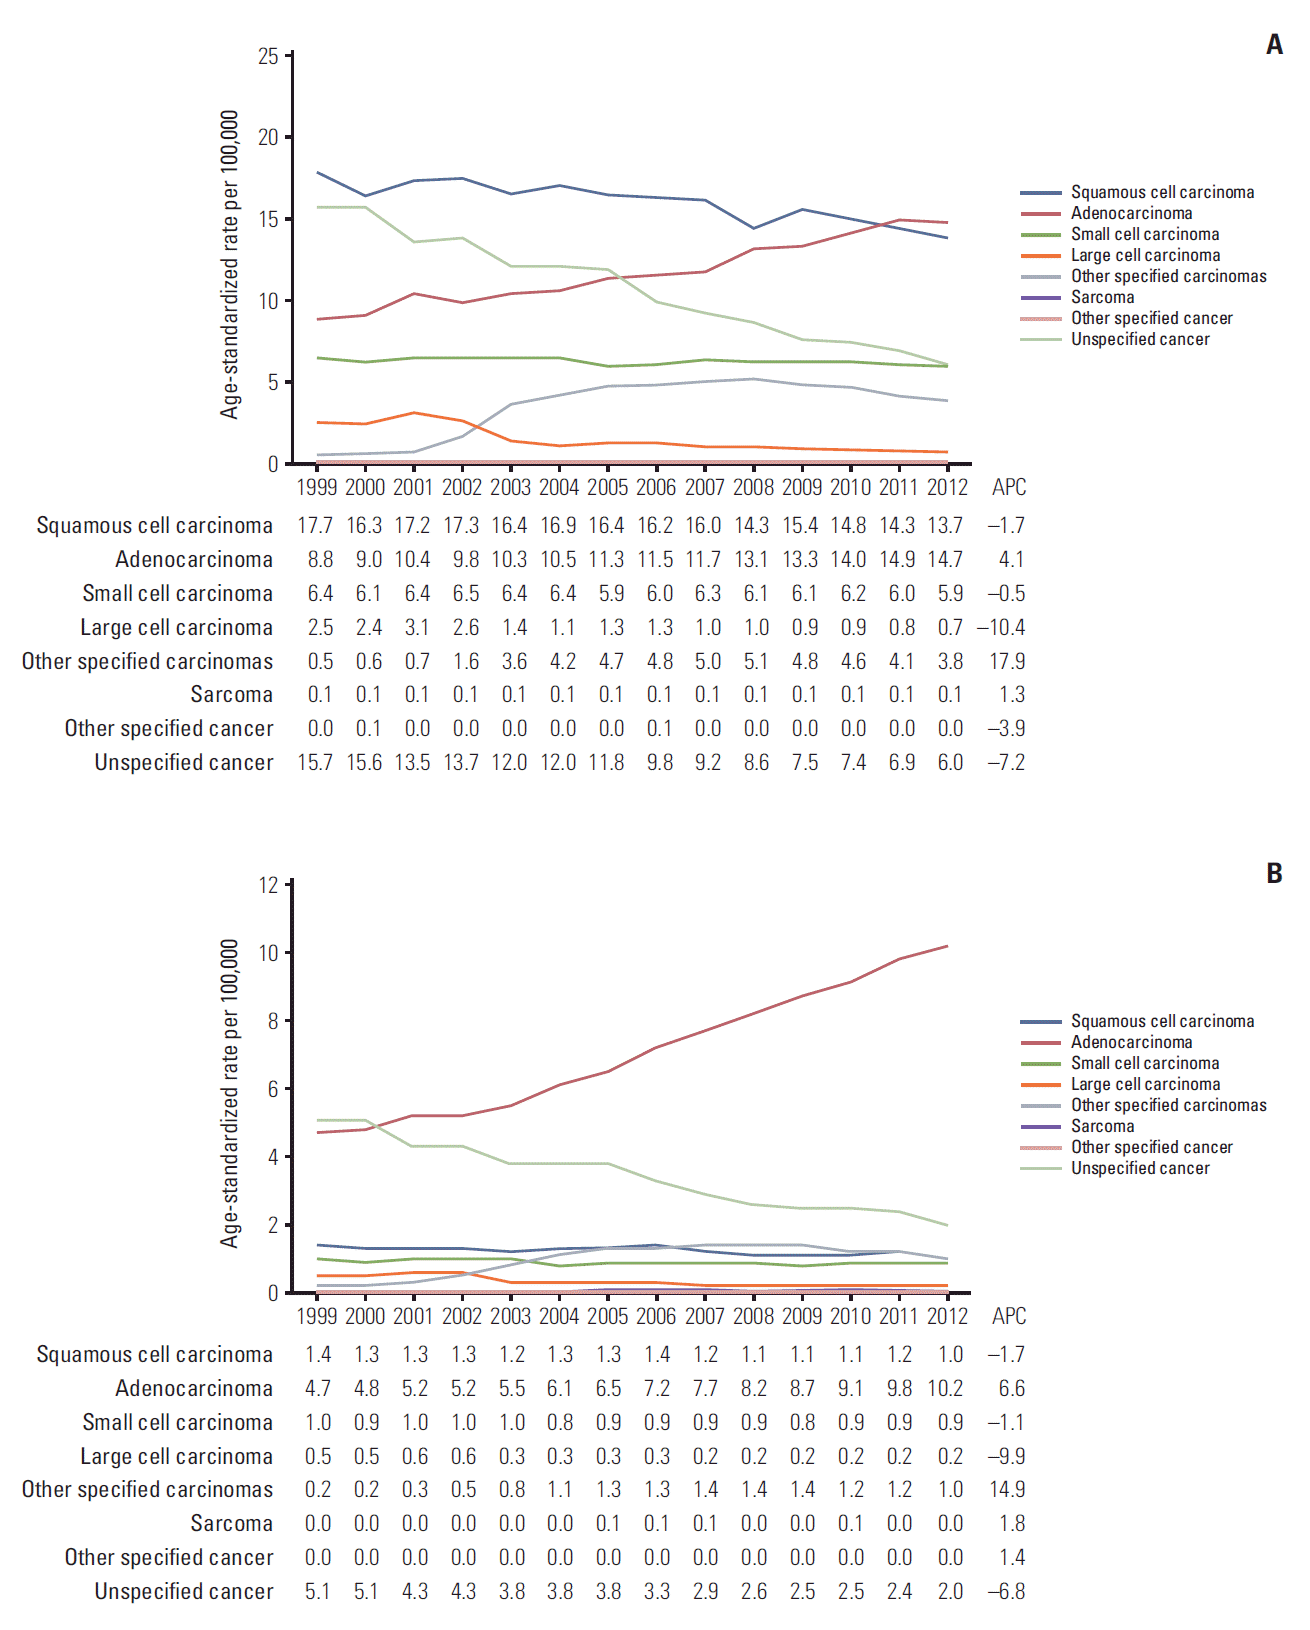
In men, despite the increase in the crude incidence rates for lung cancer from 41.1/100,000 in 1999 to 60.9/100,000 in 2012 with an APC of 3.4%, the age-standardized incidence rate decreased from 51.8/100,000 in 1999 to 44.9/100,000 in 2012 with an APC of −0.9% (Table 1). The most frequent histological type was squamous cell carcinoma until 2010; however, since 2011, adenocarcinoma has been the most commonly diagnosed cancer. The number of new lung cancer cases increased from 9,722 in 1999 to 15,350 in 2012 (Table 1). The proportion of adenocarcinomas also increased during the same period (17.8% in 1999 and 32.9% in 2012), whereas the proportion of squamous cell carcinomas decreased (34.9% in 1999 and 30.8% in 2012) (Fig. 1). A significant decrease in ASRs for the incidence was observed for squamous cell carcinomas, small cell carcinomas, and large cell carcinomas, whereas the ASR for the adenocarcinoma incidence increased significantly (APC, 4.1%) between 1999 and 2012 (Table 1, Fig. 2A).
In women, both the crude rates and ASRs for the lung cancer incidence increased between 1999 and 2012 with an APC of 5.2% and 1.7% for the crude rate and incidence, respectively (Table 1). Adenocarcinoma was the most frequent histological subtype during this period. The proportion of adenocarcinomas increased from 34.5% in 1999 to 61.7% in 2012 (Fig. 1). Similar to men, both the crude rate and the ASR for adenocarcinoma incidence increased between 1999 and 2012, with an APC of 10% for the crude rate and 6.6% for ASR, whereas the ASRs for the incidence of squamous cell carcinomas, small cell carcinomas, and large cell carcinomas decreased (Table 1, Fig. 2B).
In both men and women, the number of deaths from lung cancer increased between 1983 and 2013 (S1 Table). In 2013, a total of 12,512 men and 4,653 women died from lung cancer, which places lung cancer as the most common cancer site for death in both sexes [9]. The lung cancer mortality rapidly increased between 1983 and 1994, with an APC of 9.4% for men and 7.6% for women (Table 2). From 1994, the slope of the increase began to stabilize, and since 2002, it started to decrease (Table 2). In stratified analysis according to age groups, there was a decline in mortality for the younger age groups in both men and women. For men, there was a significant decline in mortality from 1992 for the 40-59-year age group, from 2001 for the 60-69-year age group, and from 2002 for the ≥ 70 year age group. Similarly, for women, there was a decline in mortality from 1983 for the 0-39-year age group, from 1993 for the 40-59-year age group, from 1994 for the 60-69-year age group, and from 2002 for the ≥ 70 year age group.
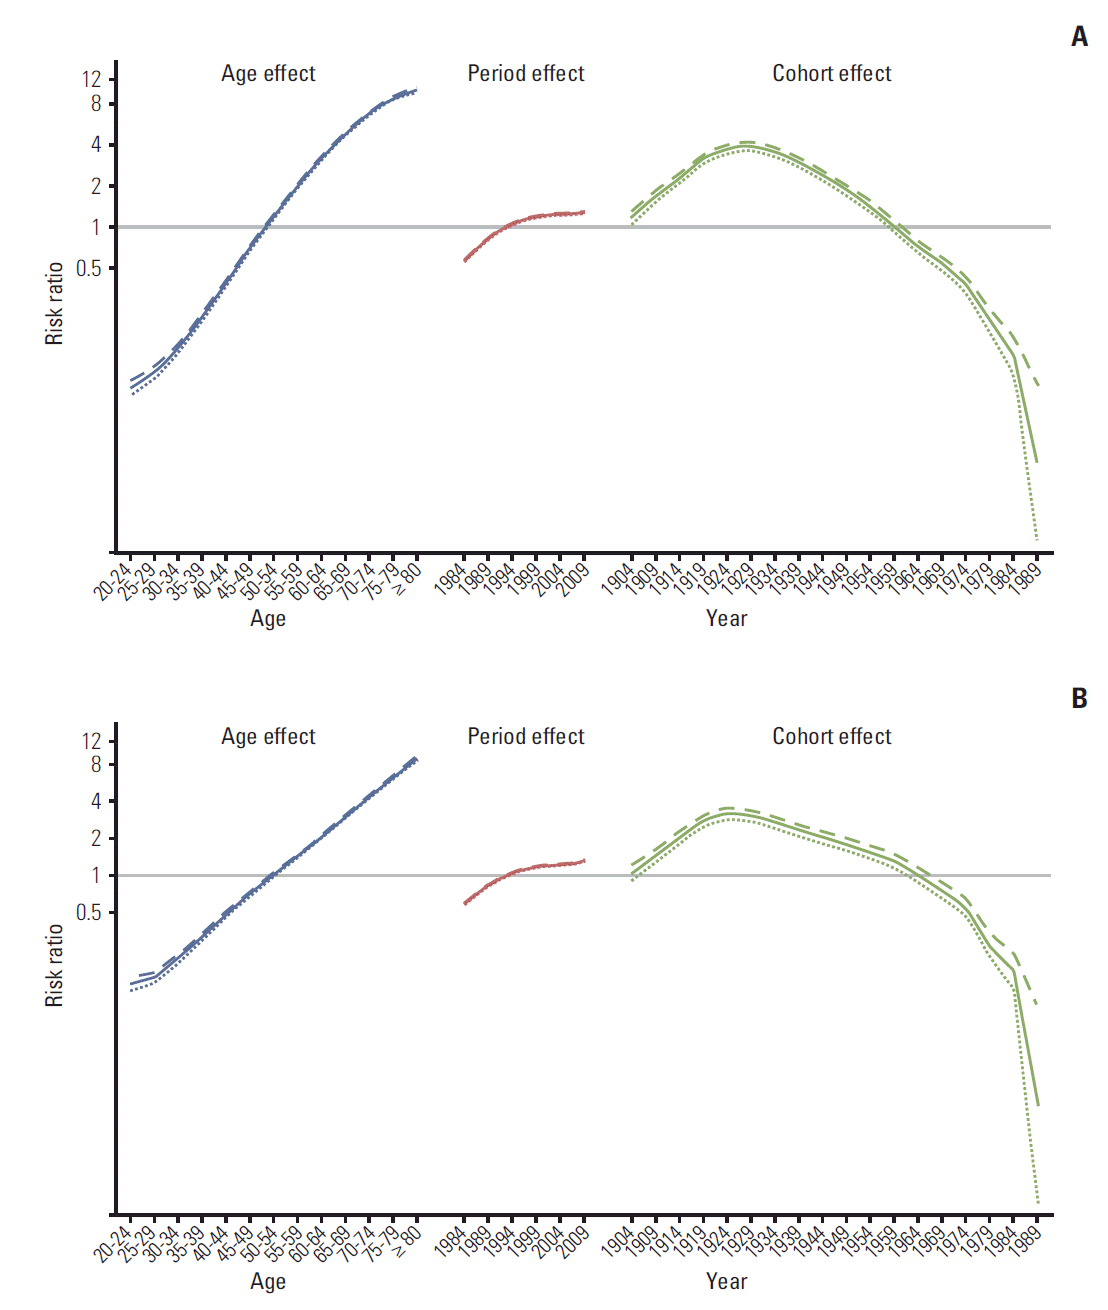
Among elderly individuals aged ≥ 65 years, the ASR for the lung cancer mortality was highest among those born in the 1920s. When adjusting for age and period effects, the risk ratio for the lung cancer mortality was highest among those born between 1924 and 1929. After that, the younger generation had a lower risk of lung cancer mortality (Fig. 3A and B).
Overall, the 5-year relative survival of lung cancer has improved significantly from 11.2% among patients diagnosed between 1993 and 1997 to 19.3% among patients diagnosed between 2008 and 2012 for men, and from 14.7% to 28.2%, respectively, in women (Table 3). An improved survival rate was observed for almost all histology groups, except for other specified carcinomas or other specified cancers. According to the histological types, adenocarcinomas showed the highest improvement for survival between 1993-1997 and 2008-2012, and an 8.6% improvement in the 5-year survival rate was observed for squamous cell carcinoma between 1993-1997 and 2008-2012. Otherwise, there has been little change in the 5-year survival rate of large cell carcinoma and sarcoma. Adenocarcinomas showed the highest 5-year survival rate in both men and women (27.1% for men and 38.3% in women) among patients diagnosed between 2008 and 2012.
Despite the increase in the number of lung cancer patients, the ASR for the lung cancer incidence decreased between 1999 and 2012 in men in Korea, whereas it increased in women during this same time. Until 2010, squamous cell carcinoma was the most frequently diagnosed histological type in men, then adenocarcinoma was the most frequent histologic type. In women, adenocarcinoma has been the most frequent histological type since 1999.
The cigarette smoking rate has declined from 72% in 1992 to 42% in 2013 in adult men [17,18], whereas the smoking rates in adult women did not show significant changes, remaining at approximately 5%-8% [17]. It has been suggested that the reduction in tobacco consumption since the 1960s has been followed by a decrease in squamous cell carcinoma incidence, but not adenocarcinoma incidence in French men [19]. Moreover, the increase in adenocarcinoma incidence may be due to the detection of asymptomatic cases or improved diagnostic techniques [19]. On the other hand, an increase in adenocarcinoma may also be explained by the changes in cigarette manufacturing, including the introduction of filtered, lower tar- and lower nicotine-containing cigarettes [20]. Furthermore, nicotine-addicted smokers tend to inhale low-yield filtered cigarettes deeper and more intensively than non-filtered higher-yield cigarettes to satisfy their nicotine needs; this leads to a more peripheral distribution of tobacco smoke in the lung and promotes peripheral tumors, such as adenocarcinomas [20,21].
A decrease in mortality in male lung cancer has been observed in many developed countries [4,22,23]. Lung cancer mortality is strongly influenced by tobacco consumption, peaking 20-30 years after the peak in tobacco consumption [23,24]. Price and non-price tobacco control policies were introduced as early as 1986; these policies restricted advertising and included health warnings on cigarette packages in Korea [18]. In addition, in 1995, the Korean government passed the National Health Promotion Act and strengthened tobacco control policies [18]. The consequent decrease in lung cancer mortality since 2002 in Korea is consistent with previous reports [25].
The improvement in the lung cancer survival rate may be related to several factors, including the introduction of the target agents [26], earlier diagnosis [27], and a decrease in surgical mortality [27]. The introduction of (neo)adjuvant chemotherapy contributed to the improvement of stages I-III resectable non-small cell lung cancer patients [28]. Currently, adjuvant chemotherapy is applied to patients with resected stage II or III non-small cell lung cancer, and in patients with stage IB with a resected lesion of 4 cm or larger [29]. These findings appear to contribute to improved survival in adenocarcinoma. In addition, patients are now more likely to have access to health insurance and receive a timely diagnosis as well as high quality treatment and supportive care.
The limitations of the current study include a relatively high proportion of unspecified histology. The proportion of unspecified cancer was 31.6% in 1999, which improved to 14.2% in 2012. This can be explained in part by the improvements in diagnostic methods and in the quality of characterization, which may lead to more specific diagnoses. On the other hand, the substantial increase in adenocarcinoma cases cannot be explained by a misclassification of other histologic types to unspecified cancers. Another limitation regarding survival analysis was due to the limited information in stage information. Among the 88,655 lung cancer patients diagnosed between 2008 and 2012, the Surveillance, Epidemiology, and End Results stage information for 9,753 patients (11.0%) was missing [30]. The 5-year relative survival was 53.9% for localized cancer, 29.9% for regional cancer, 5.1% for distant cancer, and 15.8% for unknown stage cancers. Therefore, we cannot rule out the possibility that improved stage information might contribute to improvements in overall survival.
Despite these limitations, the KCCR provides reasonably high quality data (S2 Table). For instance, for lung cancer, the proportion of cases with a death certificate only was 10.8% in 1999 and improved to 3.3% in 2012. Moreover, the mortality/ incidence ratio and the proportion of microscopic verification were in the acceptable ranges.
The lung cancer mortality began to decrease in both men and women in 2002. Since 1999, the of incidence lung cancer has decreased among men, whereas it has increased among women. Adenocarcinomas have become the most frequent histological type in both men and women. Finally, there has been an improvement in the 5-year relative survival of lung cancer patients.
Supplementary Materials
Supplementary materials are available at Cancer Research and Treatment website (http://www.e-crt.org).
ACKNOWLEDGMENTS
This work was supported by a research grant from the National Cancer Center (No. 1610200), Republic of Korea.
References
1. GLOBOCAN 2012: estimated cancer incidence, mortality and prevalence worldwide in 2012. All cancers (excluding nonmelanoma skin cancer) estimated incidence, mortaliy and prevalence worldwide in 2012 [Internet]. Geneva: World Health Organization;2015. [cited 2015 Nov 13]. Available from: http://globocan.iarc.fr/Pages/fact_sheets_cancer.aspx#.
2. Devesa SS, Shaw GL, Blot WJ. Changing patterns of lung cancer incidence by histological type. Cancer Epidemiol Biomarkers Prev. 1991; 1:29–34.
3. Janssen-Heijnen ML, Coebergh JW. The changing epidemiology of lung cancer in Europe. Lung Cancer. 2003; 41:245–58.
4. Jemal A, Chu KC, Tarone RE. Recent trends in lung cancer mortality in the United States. J Natl Cancer Inst. 2001; 93:277–83.
5. Toyoda Y, Nakayama T, Ioka A, Tsukuma H. Trends in lung cancer incidence by histological type in Osaka, Japan. Jpn J Clin Oncol. 2008; 38:534–9.
6. Park S, Jee SH, Shin HR, Park EH, Shin A, Jung KW, et al. Attributable fraction of tobacco smoking on cancer using population-based nationwide cancer incidence and mortality data in Korea. BMC Cancer. 2014; 14:406.
7. Parkin DM. 2. Tobacco-attributable cancer burden in the UK in 2010. Br J Cancer. 2011; 105 Suppl 2:S6–S13.
8. Pesch B, Kendzia B, Gustavsson P, Jockel KH, Johnen G, Pohlabeln H, et al. Cigarette smoking and lung cancer: relative risk estimates for the major histological types from a pooled analysis of case-control studies. Int J Cancer. 2012; 131:1210–9.
9. Jung KW, Won YJ, Kong HJ, Oh CM, Cho H, Lee DH, et al. Cancer statistics in Korea: incidence, mortality, survival, and prevalence in 2012. Cancer Res Treat. 2015; 47:127–41.
10. Altekruse SF, Kosary CL, Krapcho M, Neyman N, Aminou R, Waldron W, et al. SEER cancer statistics review, 1975-2007. Bethesda, MD: National Cancer Institute;2010.
11. Boyle P, Parkin DM. Statistical methods for registries. In : Jensen OM, Parkin DM, MacLennan R, Muir CS, Skeet RG, editors. Cancer registration: principles and methods. Lyon: International Agency for Research on Cancer;1991.
12. Kim HJ, Fay MP, Feuer EJ, Midthune DN. Permutation tests for joinpoint regression with applications to cancer rates. Stat Med. 2000; 19:335–51.
13. Yang Y, Fu WJ, Land KC. A methodological comparison of age‐period‐cohort models: the intrinsic estimator and conventional generalized linear models. Sociol Methodol. 2004; 34:75–110.
14. Ederer F, Heise H. Instructions to IBM 650 programmers in processing survival computations. Methodological note. No. 10. End results evaluation section. Bethesda, MD: National Cancer Institute;1959.
15. PaulDickman.com [Internet]. Stockholm: Paul Dickman;2015. [cited 2015 Nov 13]. Available from: http://www.pauldickman.com.
16. Dickman PW, Sloggett A, Hills M, Hakulinen T. Regression models for relative survival. Stat Med. 2004; 23:51–64.
17. Choi S, Kim Y, Park S, Lee J, Oh K. Trends in cigarette smoking among adolescents and adults in South Korea. Epidemiol Health. 2014; 36:e2014023.
18. Park EJ, Koh HK, Kwon JW, Suh MK, Kim H, Cho SI. Secular trends in adult male smoking from 1992 to 2006 in South Korea: age-specific changes with evolving tobacco-control policies. Public Health. 2009; 123:657–64.
19. Charloux A, Quoix E, Wolkove N, Small D, Pauli G, Kreisman H. The increasing incidence of lung adenocarcinoma: reality or artefact? A review of the epidemiology of lung adenocarcinoma. Int J Epidemiol. 1997; 26:14–23.
20. Lortet-Tieulent J, Soerjomataram I, Ferlay J, Rutherford M, Weiderpass E, Bray F. International trends in lung cancer incidence by histological subtype: adenocarcinoma stabilizing in men but still increasing in women. Lung Cancer. 2014; 84:13–22.
21. Dela Cruz CS, Tanoue LT, Matthay RA. Lung cancer: epidemiology, etiology, and prevention. Clin Chest Med. 2011; 32:605–44.
22. Bray FI, Weiderpass E. Lung cancer mortality trends in 36 European countries: secular trends and birth cohort patterns by sex and region 1970-2007. Int J Cancer. 2010; 126:1454–66.
23. Adair T, Hoy D, Dettrick Z, Lopez AD. Reconstruction of long-term tobacco consumption trends in Australia and their relationship to lung cancer mortality. Cancer Causes Control. 2011; 22:1047–53.
24. Thun M, Peto R, Boreham J, Lopez AD. Stages of the cigarette epidemic on entering its second century. Tob Control. 2012; 21:96–101.
25. Choi Y, Kim Y, Hong YC, Park SK, Yoo KY. Temporal changes of lung cancer mortality in Korea. J Korean Med Sci. 2007; 22:524–8.
26. Lynch TJ, Bell DW, Sordella R, Gurubhagavatula S, Okimoto RA, Brannigan BW, et al. Activating mutations in the epidermal growth factor receptor underlying responsiveness of nonsmall-cell lung cancer to gefitinib. N Engl J Med. 2004; 350:2129–39.
27. Dillman RO, McClure SE. Steadily improving survival in lung cancer. Clin Lung Cancer. 2014; 15:331–7.
28. Berghmans T, Paesmans M, Meert AP, Mascaux C, Lothaire P, Lafitte JJ, et al. Survival improvement in resectable non-small cell lung cancer with (neo)adjuvant chemotherapy: results of a meta-analysis of the literature. Lung Cancer. 2005; 49:13–23.
29. Horn L, Lovly CM, Johnson DH. Neoplasms of the lung. In : Kasper D, Fauci A, Hauser S, Longo D, Jameson JL, Loscalzo J, editors. Harrison's principles of internal medicine. 19th ed. New York: McGraw-Hill;2015.
30. Korea Central Cancer Registry; National Cancer Center. Annual report of cancer statistics in Korea in 2012. Goyang: Korea Central Cancer Registry, National Cancer Center;2014.
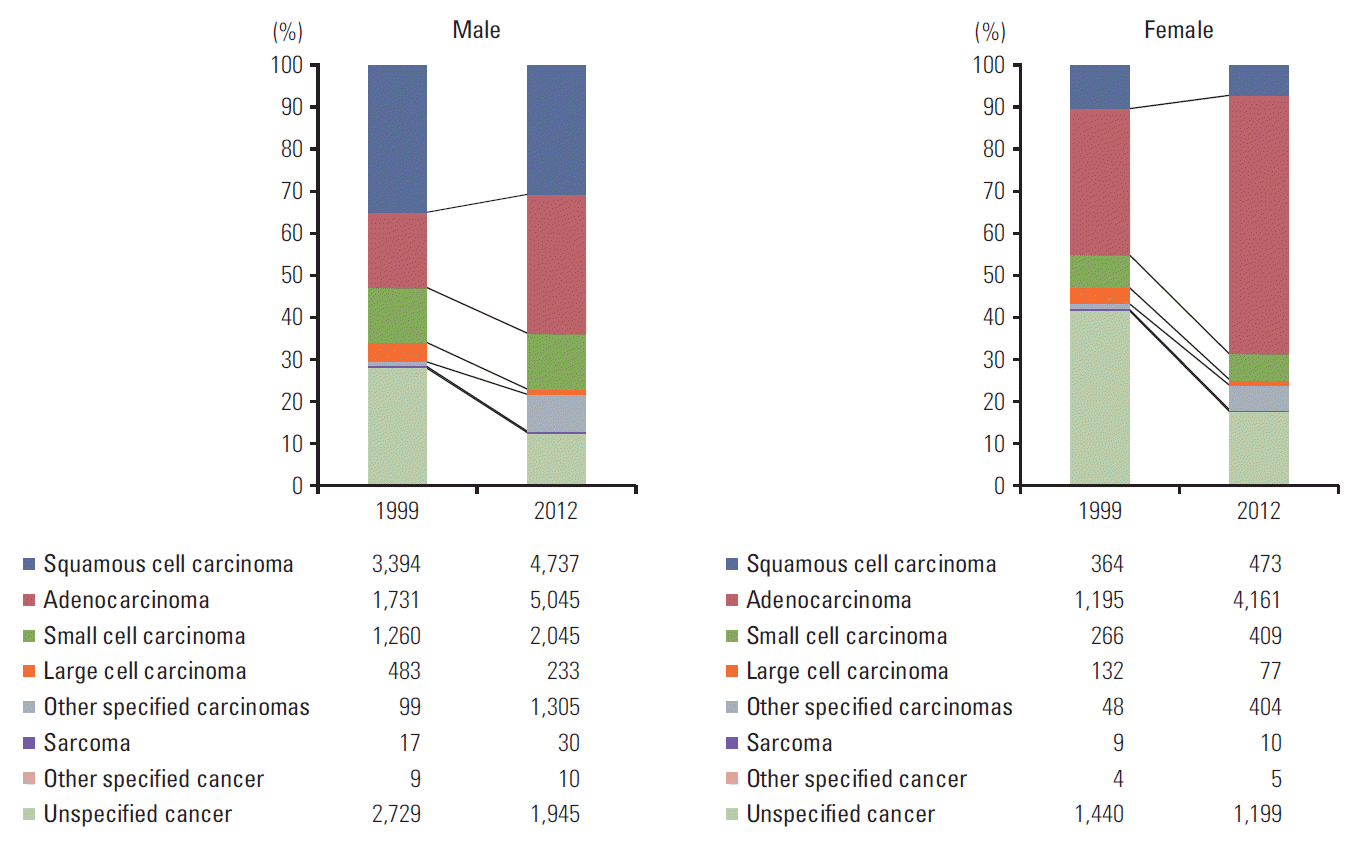
Table 1.
Histological group | Rate |
Year |
APC | 95% CI | p-value | |||||||||||||
---|---|---|---|---|---|---|---|---|---|---|---|---|---|---|---|---|---|---|
1999 | 2000 | 2001 | 2002 | 2003 | 2004 | 2005 | 2006 | 2007 | 2008 | 2009 | 2010 | 2011 | 2012 | |||||
Men | ||||||||||||||||||
Overall | Cases | 9,722 | 9,788 | 10,473 | 10,956 | 11,187 | 11,961 | 12,497 | 12,682 | 13,182 | 13,593 | 14,240 | 14,914 | 15,319 | 15,350 | |||
CR | 41.1 | 41.0 | 43.6 | 45.4 | 46.2 | 49.2 | 51.2 | 51.7 | 53.5 | 54.9 | 57.2 | 59.7 | 61.1 | 60.9 | 3.4 | 3.1 to 3.6 | < 0.01 | |
ASRa) | 51.8 | 50.3 | 51.5 | 51.6 | 50.4 | 51.3 | 51.6 | 49.9 | 49.4 | 48.3 | 48.2 | 48.1 | 47.2 | 44.9 | −0.9 | −1.2 to −0.6 | < 0.01 | |
Carcinoma | Cases | 6,967 | 6,947 | 7,916 | 8,262 | 8,735 | 9,373 | 9,861 | 10,361 | 10,907 | 11,354 | 12,148 | 12,741 | 13,173 | 13,365 | |||
CR | 29.4 | 29.1 | 32.9 | 34.2 | 36.0 | 38.5 | 40.4 | 42.3 | 44.3 | 45.9 | 48.8 | 51.0 | 52.5 | 53.1 | 5.0 | 4.6 to 5.4 | < 0.01 | |
ASRa) | 36.0 | 34.6 | 37.8 | 37.8 | 38.3 | 39.2 | 39.6 | 39.9 | 40.0 | 39.6 | 40.5 | 40.6 | 40.2 | 38.8 | 0.9 | 0.5 to 1.3 | < 0.01 | |
Squamous cell carcinoma | Cases | 3,394 | 3,256 | 3,572 | 3,746 | 3,724 | 4,000 | 4,034 | 4,172 | 4,312 | 4,097 | 4,575 | 4,627 | 4,707 | 4,737 | |||
CR | 14.3 | 13.6 | 14.9 | 15.5 | 15.4 | 16.4 | 16.5 | 17.0 | 17.5 | 16.5 | 18.4 | 18.5 | 18.8 | 18.8 | 2.4 | 2.0 to 2.9 | < 0.01 | |
ASRa) | 17.7 | 16.3 | 17.2 | 17.3 | 16.4 | 16.9 | 16.4 | 16.2 | 16.0 | 14.3 | 15.4 | 14.8 | 14.3 | 13.7 | −1.7 | −2.2 to −1.2 | < 0.01 | |
Adenocarcinoma | Cases | 1,731 | 1,838 | 2,205 | 2,177 | 2,404 | 2,561 | 2,859 | 3,041 | 3,232 | 3,780 | 4,024 | 4,414 | 4,900 | 5,045 | |||
CR | 7.3 | 7.7 | 9.2 | 9.0 | 9.9 | 10.5 | 11.7 | 12.4 | 13.1 | 15.3 | 16.2 | 17.7 | 19.5 | 20.0 | 8.3 | 7.8 to 8.8 | < 0.01 | |
ASRa) | 8.8 | 9.0 | 10.4 | 9.8 | 10.3 | 10.5 | 11.3 | 11.5 | 11.7 | 13.1 | 13.3 | 14.0 | 14.9 | 14.7 | 4.1 | 3.6 to 4.6 | < 0.01 | |
Small cell carcinoma | Cases | 1,260 | 1,238 | 1,355 | 1,408 | 1,460 | 1,530 | 1,474 | 1,557 | 1,721 | 1,733 | 1,839 | 1,969 | 1,971 | 2,045 | |||
CR | 5.3 | 5.2 | 5.6 | 5.8 | 6.0 | 6.3 | 6.0 | 6.4 | 7.0 | 7.0 | 7.4 | 7.9 | 7.9 | 8.1 | 3.5 | 3.1 to 4.0 | < 0.01 | |
ASRa) | 6.4 | 6.1 | 6.4 | 6.5 | 6.4 | 6.4 | 5.9 | 6.0 | 6.3 | 6.1 | 6.1 | 6.2 | 6.0 | 5.9 | −0.5 | −0.9 to −0.1 | 0.01 | |
Large cell carcinomab) | Cases | 483 | 490 | 643 | 572 | 325 | 267 | 312 | 340 | 269 | 275 | 264 | 281 | 263 | 233 | |||
CR | 2.0 | 2.1 | 2.7 | 2.4 | 1.3 | 1.1 | 1.3 | 1.4 | 1.1 | 1.1 | 1.1 | 1.1 | 1.0 | 0.9 | −6.8 | −9.3 to −4.2 | < 0.01 | |
ASRa) | 2.5 | 2.4 | 3.1 | 2.6 | 1.4 | 1.1 | 1.3 | 1.3 | 1.0 | 1.0 | 0.9 | 0.9 | 0.8 | 0.7 | −10.4 | −12.8 to −7.9 | < 0.01 | |
Other specified carcinomas | Cases | 99 | 125 | 141 | 359 | 822 | 1,015 | 1,182 | 1,251 | 1,373 | 1,469 | 1,446 | 1,450 | 1,332 | 1,305 | |||
CR | 0.4 | 0.5 | 0.6 | 1.5 | 3.4 | 4.2 | 4.8 | 5.1 | 5.6 | 5.9 | 5.8 | 5.8 | 5.3 | 5.2 | 22.4 | 13.0 to 32.7 | < 0.01 | |
ASRa) | 0.5 | 0.6 | 0.7 | 1.6 | 3.6 | 4.2 | 4.7 | 4.8 | 5.0 | 5.1 | 4.8 | 4.6 | 4.1 | 3.8 | 17.9 | 8.7 to 28.0 | < 0.01 | |
Sarcoma | Cases | 17 | 16 | 28 | 14 | 25 | 16 | 21 | 27 | 30 | 24 | 38 | 21 | 28 | 30 | |||
CR | 0.1 | 0.1 | 0.1 | 0.1 | 0.1 | 0.1 | 0.1 | 0.1 | 0.1 | 0.1 | 0.2 | 0.1 | 0.1 | 0.1 | 4.0 | 0.5 to 7.7 | 0.03 | |
ASRa) | 0.1 | 0.1 | 0.1 | 0.1 | 0.1 | 0.1 | 0.1 | 0.1 | 0.1 | 0.1 | 0.1 | 0.1 | 0.1 | 0.1 | 1.3 | −2.3 to 5.0 | 0.46 | |
Other specified cancer (including pulmonary blastoma) | Cases | 9 | 10 | 8 | 9 | 10 | 10 | 10 | 16 | 11 | 11 | 9 | 6 | 11 | 10 | |||
CR | 0.0 | 0.0 | 0.0 | 0.0 | 0.0 | 0.0 | 0.0 | 0.1 | 0.0 | 0.0 | 0.0 | 0.0 | 0.0 | 0.0 | −0.2 | −3.4 to 3.0 | 0.88 | |
ASRa) | 0.0 | 0.1 | 0.0 | 0.0 | 0.0 | 0.0 | 0.0 | 0.1 | 0.0 | 0.0 | 0.0 | 0.0 | 0.0 | 0.0 | −3.9 | −7.1 to −0.7 | 0.02 | |
Unspecified cancer | Cases | 2,729 | 2,815 | 2,521 | 2,671 | 2,417 | 2,562 | 2,605 | 2,278 | 2,234 | 2,204 | 2,045 | 2,146 | 2,107 | 1,945 | |||
CR | 11.5 | 11.8 | 10.5 | 11.1 | 10.0 | 10.5 | 10.7 | 9.3 | 9.1 | 8.9 | 8.2 | 8.6 | 8.4 | 7.7 | −3.0 | −3.6 to −2.4 | < 0.01 | |
ASRa) | 15.7 | 15.6 | 13.5 | 13.7 | 12.0 | 12.0 | 11.8 | 9.8 | 9.2 | 8.6 | 7.5 | 7.4 | 6.9 | 6.0 | −7.2 | −7.8 to −6.5 | < 0.01 | |
Women | ||||||||||||||||||
Overall | Cases | 3,458 | 3,588 | 3,654 | 3,913 | 3,987 | 4,379 | 4,728 | 5,035 | 5,234 | 5,523 | 5,791 | 6,223 | 6,657 | 6,738 | |||
CR | 14.7 | 15.2 | 15.3 | 16.3 | 16.6 | 18.1 | 19.5 | 20.7 | 21.4 | 22.4 | 23.4 | 25 | 26.6 | 26.8 | 5.2 | 4.8 to 5.5 | < 0.01 | |
ASRa) | 12.9 | 12.9 | 12.7 | 13 | 12.8 | 13.5 | 14 | 14.5 | 14.4 | 14.5 | 14.6 | 15.2 | 15.6 | 15.3 | 1.7 | 1.4 to 2.0 | < 0.01 | |
Carcinoma | Cases | 2,005 | 2,070 | 2,282 | 2,489 | 2,654 | 2,943 | 3,223 | 3,674 | 3,937 | 4,266 | 4,505 | 4,851 | 5,292 | 5,524 | |||
CR | 8.5 | 8.7 | 9.6 | 10.4 | 11.0 | 12.2 | 13.3 | 15.1 | 16.1 | 17.3 | 18.2 | 19.5 | 21.1 | 22.0 | 8.1 | 7.7 to 8.6 | < 0.01 | |
ASRa) | 7.8 | 7.8 | 8.3 | 8.7 | 8.9 | 9.6 | 10.1 | 11.1 | 11.4 | 11.9 | 12.1 | 12.6 | 13.2 | 13.2 | 4.7 | 4.3 to 5.1 | < 0.01 | |
Squamous cell carcinoma | Cases | 364 | 357 | 367 | 386 | 375 | 427 | 427 | 503 | 443 | 439 | 440 | 485 | 523 | 473 | |||
CR | 1.5 | 1.5 | 1.5 | 1.6 | 1.6 | 1.8 | 1.8 | 2.1 | 1.8 | 1.8 | 1.8 | 1.9 | 2.1 | 1.9 | 2.2 | 1.3 to 3.1 | < 0.01 | |
ASRa) | 1.4 | 1.3 | 1.3 | 1.3 | 1.2 | 1.3 | 1.3 | 1.4 | 1.2 | 1.1 | 1.1 | 1.1 | 1.2 | 1.0 | −1.7 | −2.6 to −0.8 | < 0.01 | |
Adenocarcinoma | Cases | 1,195 | 1,267 | 1,394 | 1,479 | 1,626 | 1,834 | 2,029 | 2,314 | 2,601 | 2,864 | 3,178 | 3,422 | 3,839 | 4,161 | |||
CR | 5.1 | 5.4 | 5.8 | 6.2 | 6.8 | 7.6 | 8.4 | 9.5 | 10.6 | 11.6 | 12.8 | 13.7 | 15.3 | 16.5 | 10.0 | 9.6 to 10.5 | < 0.01 | |
ASRa) | 4.7 | 4.8 | 5.2 | 5.2 | 5.5 | 6.1 | 6.5 | 7.2 | 7.7 | 8.2 | 8.7 | 9.1 | 9.8 | 10.2 | 6.6 | 6.2 to 7.1 | < 0.01 | |
Small cell carcinoma | Cases | 266 | 240 | 276 | 294 | 321 | 273 | 287 | 327 | 319 | 366 | 308 | 392 | 384 | 409 | |||
CR | 1.1 | 1.0 | 1.2 | 1.2 | 1.3 | 1.1 | 1.2 | 1.3 | 1.3 | 1.5 | 1.2 | 1.6 | 1.5 | 1.6 | 2.9 | 1.8 to 4.1 | < 0.01 | |
ASRa) | 1.0 | 0.9 | 1.0 | 1.0 | 1.0 | 0.8 | 0.9 | 0.9 | 0.9 | 0.9 | 0.8 | 0.9 | 0.9 | 0.9 | −1.1 | −2.1 to 0.0 | 0.06 | |
Large cell carcinomab) | Cases | 132 | 148 | 179 | 184 | 88 | 77 | 86 | 95 | 82 | 71 | 78 | 88 | 81 | 77 | |||
CR | 0.6 | 0.6 | 0.8 | 0.8 | 0.4 | 0.3 | 0.4 | 0.4 | 0.3 | 0.3 | 0.3 | 0.4 | 0.3 | 0.3 | −6.2 | −9.2 to −3.1 | < 0.01 | |
ASRa) | 0.5 | 0.5 | 0.6 | 0.6 | 0.3 | 0.3 | 0.3 | 0.3 | 0.2 | 0.2 | 0.2 | 0.2 | 0.2 | 0.2 | −9.9 | −12.6 to −7.0 | < 0.01 | |
Other specified carcinomas | Cases | 48 | 58 | 66 | 146 | 244 | 332 | 394 | 435 | 492 | 526 | 501 | 464 | 465 | 404 | |||
CR | 0.2 | 0.2 | 0.3 | 0.6 | 1.0 | 1.4 | 1.6 | 1.8 | 2.0 | 2.1 | 2.0 | 1.9 | 1.9 | 1.6 | 19.1 | 11.3 to 27.5 | < 0.01 | |
ASRa) | 0.2 | 0.2 | 0.3 | 0.5 | 0.8 | 1.1 | 1.3 | 1.3 | 1.4 | 1.4 | 1.4 | 1.2 | 1.2 | 1.0 | 14.9 | 7.4 to 22.9 | < 0.01 | |
Sarcoma | Cases | 9 | 4 | 7 | 8 | 12 | 12 | 18 | 16 | 15 | 7 | 5 | 24 | 16 | 10 | |||
CR | 0.0 | 0.0 | 0.0 | 0.0 | 0.0 | 0.0 | 0.1 | 0.1 | 0.1 | 0.0 | 0.0 | 0.1 | 0.1 | 0.0 | 4.5 | −2.6 to 12.1 | 0.20 | |
ASRa) | 0.0 | 0.0 | 0.0 | 0.0 | 0.0 | 0.0 | 0.1 | 0.1 | 0.1 | 0.0 | 0.0 | 0.1 | 0.0 | 0.0 | 1.8 | −4.8 to 8.8 | 0.58 | |
Other specified cancer (include pulmonary blastoma) | Cases | 4 | 4 | 5 | 5 | 2 | 2 | 1 | 11 | 1 | 7 | 3 | 7 | 10 | 5 | |||
CR | 0.0 | 0.0 | 0.0 | 0.0 | 0.0 | 0.0 | 0.0 | 0.0 | 0.0 | 0.0 | 0.0 | 0.0 | 0.0 | 0.0 | 3.7 | −7.2 to 15.9 | 0.48 | |
ASRa) | 0.0 | 0.0 | 0.0 | 0.0 | 0.0 | 0.0 | 0.0 | 0.0 | 0.0 | 0.0 | 0.0 | 0.0 | 0.0 | 0.0 | 1.4 | −8.1 to 11.9 | 0.76 | |
Unspecified cancer | Cases | 1,440 | 1,510 | 1,360 | 1,411 | 1,319 | 1,422 | 1,486 | 1,334 | 1,281 | 1,243 | 1,278 | 1,341 | 1,339 | 1,199 | |||
CR | 6.1 | 6.4 | 5.7 | 5.9 | 5.5 | 5.9 | 6.1 | 5.5 | 5.2 | 5.0 | 5.2 | 5.4 | 5.3 | 4.8 | −1.6 | −2.3 to −1.0 | < 0.01 | |
ASRa) | 5.1 | 5.1 | 4.3 | 4.3 | 3.8 | 3.8 | 3.8 | 3.3 | 2.9 | 2.6 | 2.5 | 2.5 | 2.4 | 2.0 | −6.8 | −7.5 to −6.1 | < 0.01 |
Table 2.
Table 3.
Histological group |
Year of diagnosis |
Changea) (%) | p-valueb) | |||||||||
---|---|---|---|---|---|---|---|---|---|---|---|---|
1993-1997 |
1998-2002 |
2003-2007 |
2008-2012 |
1993-2012 |
||||||||
No. | 5-Year survival (%) | No. | 5-Year survival (%) | No. | 5-Year survival (%) | No. | 5-Year survival (%) | No. | 5-Year survival (%) | |||
Overall total | 37,145 | 12.0 | 59,279 | 14.3 | 73,116 | 17.4 | 88,559 | 21.9 | 258,099 | 17.4 | 9.9 | < 0.01 |
Carcinoma | 29,798 | 11.5 | 45,528 | 14.2 | 59,851 | 18.4 | 76,061 | 23.9 | 211,238 | 18.3 | 12.4 | < 0.01 |
Squamous cell carcinoma | 13,431 | 13.6 | 18,209 | 16.4 | 20,631 | 19.5 | 22,165 | 22.2 | 74,436 | 18.4 | 8.6 | < 0.01 |
Adenocarcinoma | 8,841 | 10.4 | 15,490 | 14.6 | 22,148 | 23.1 | 34,187 | 32.1 | 80,666 | 23.4 | 21.7 | < 0.01 |
Small-cell carcinoma | 5,179 | 6.2 | 7,467 | 8.0 | 8,739 | 7.5 | 10,432 | 8.0 | 31,817 | 7.6 | 1.8 | < 0.01 |
Large-cell carcinoma | 1,834 | 9.7 | 3,229 | 9.3 | 1,824 | 10.6 | 1,555 | 12.6 | 8,442 | 10.2 | 2.9 | 0.42 |
Other specified carcinomas | 513 | 33.2 | 1,133 | 30.4 | 6,509 | 15.2 | 7,722 | 17.0 | 15,877 | 17.8 | –16.2 | < 0.01 |
Sarcoma | 71 | 18.0 | 118 | 20.5 | 153 | 12.5 | 150 | 23.1 | 492 | 17.6 | 5.1 | 0.88 |
Other specified cancer | 55 | 28.0 | 54 | 32.1 | 59 | 47.2 | 66 | 22.7 | 234 | 33.3 | –5.3 | 0.35 |
Unspecified cancer | 7,221 | 14.0 | 13,579 | 14.3 | 13,053 | 13.1 | 12,282 | 8.9 | 46,135 | 12.7 | –5.1 | < 0.01 |
Men | ||||||||||||
Total | 28,695 | 11.2 | 44,342 | 12.9 | 53,690 | 15.9 | 62,863 | 19.3 | 189,590 | 15.5 | 8.1 | < 0.01 |
Carcinoma | 23,575 | 11.1 | 35,235 | 13.5 | 45,080 | 17.0 | 54,900 | 21.0 | 158,790 | 16.6 | 9.9 | < 0.01 |
Squamous cell carcinoma | 12,099 | 13.7 | 16,493 | 16.5 | 18,705 | 20.0 | 20,099 | 22.7 | 67,396 | 18.7 | 9.0 | < 0.01 |
Adenocarcinoma | 5,366 | 9.0 | 9,263 | 12.4 | 12,747 | 19.9 | 19,087 | 27.1 | 46,463 | 19.8 | 18.1 | < 0.01 |
Small-cell carcinoma | 4,299 | 5.6 | 6,197 | 7.5 | 7,298 | 7.4 | 8,694 | 8.2 | 26,488 | 7.4 | 2.6 | < 0.01 |
Large-cell carcinoma | 1,450 | 9.4 | 2,500 | 8.9 | 1,424 | 10.5 | 1,198 | 13.4 | 6,572 | 10.1 | 4.0 | 0.17 |
Other specified carcinomas | 361 | 28.6 | 782 | 25.0 | 4,906 | 14.0 | 5,822 | 15.9 | 11,871 | 16.1 | –12.7 | < 0.01 |
Sarcoma | 45 | 16.8 | 82 | 15.6 | 95 | 7.0 | 110 | 21.5 | 332 | 14.3 | 4.7 | 0.89 |
Other specified cancer | 44 | 28.2 | 36 | 25.2 | 44 | 37.4 | 42 | 18.2 | 166 | 28.1 | –10.0 | 0.20 |
Unspecified cancer | 5,031 | 11.2 | 8,989 | 10.3 | 8,471 | 10.0 | 7,811 | 7.2 | 30,302 | 9.7 | –4.0 | < 0.01 |
Women | ||||||||||||
Total | 8,450 | 14.7 | 14,937 | 18.3 | 19,426 | 21.7 | 25,696 | 28.2 | 68,509 | 22.4 | 13.5 | < 0.01 |
Carcinoma | 6,223 | 12.7 | 10,293 | 16.8 | 14,771 | 22.6 | 21,161 | 31.5 | 52,448 | 23.4 | 18.8 | < 0.01 |
Squamous cell carcinoma | 1,332 | 12.3 | 1,716 | 15.2 | 1,926 | 15.1 | 2,066 | 17.3 | 7,040 | 15.2 | 5.0 | 0.02 |
Adenocarcinoma | 3,475 | 12.6 | 6,227 | 17.8 | 9,401 | 27.5 | 15,100 | 38.3 | 34,203 | 28.2 | 25.7 | < 0.01 |
Small-cell carcinoma | 880 | 9.1 | 1,270 | 10.5 | 1,441 | 8.3 | 1,738 | 7.1 | 5,329 | 8.7 | –2.0 | < 0.01 |
Large-cell carcinoma | 384 | 10.8 | 729 | 10.8 | 400 | 10.7 | 357 | 9.5 | 1,870 | 10.7 | –1.3 | 0.39 |
Other specified carcinomas | 152 | 44.1 | 351 | 42.1 | 1,603 | 18.8 | 1,900 | 20.5 | 4,006 | 23.0 | –23.6 | < 0.01 |
Sarcoma | 26 | 20.1 | 36 | 31.6 | 58 | 21.2 | 40 | 27.0 | 160 | 24.3 | 6.9 | 0.95 |
Other specified cancer | 11 | 27.5 | 18 | 45.3 | 15 | 76.0 | 24 | 31.4 | 68 | 46.2 | 3.9 | 0.99 |
Unspecified cancer | 2,190 | 20.5 | 4,590 | 22.0 | 4,582 | 18.9 | 4,471 | 11.8 | 15,833 | 18.5 | –8.7 | < 0.01 |