Abstract
Purpose
The purpose of this study was to assess whether alcohol intake is associated with the risk of thyroid cancer by a meta-analysis of observational studies.
Materials and Methods
We searched PubMed and EMBASE in June of 2015 to locate eligible studies. We included observational studies such as cross-sectional studies, case-control studies, and cohort studies reporting odd ratios (ORs) or relative risk (RRs) with 95% confidence intervals (CIs).
Results
We included 33 observational studies with two cross-sectional studies, 20 case-controls studies, and 11 cohort studies, which involved a total of 7,725 thyroid cancer patients and 3,113,679 participants without thyroid cancer in the final analysis. In the fixed-effect model meta-analysis of all 33 studies, we found that alcohol intake was consistently associated with a decreased risk of thyroid cancer (OR or RR, 0.74; 95% CI, 0.67 to 0.83; I2=38.6%). In the subgroup meta-analysis by type of study, alcohol intake also decreased the risk of thyroid cancer in both case-control studies (OR, 0.77; 95% CI, 0.65 to 0.92; I2=29.5%; n=20) and cohort studies (RR, 0.70; 95% CI, 0.60 to 0.82; I2=0%; n=11). Moreover, subgroup meta-analyses by type of thyroid cancer, gender, amount of alcohol consumed, and methodological quality of study showed that alcohol intake was significantly associated with a decreased risk of thyroid cancer.
According to the World Cancer Report 2014 published by the World Health Organization’s International Agency for Research on Cancer, thyroid cancer is among the less frequent malignancies, being ranked eighth in world cancer incidence based on major organs affected by cancer for women [1]. However, its incidence has rapidly increased, nearly doubling during the past decade [2,3]. While the reasons for this increase remain unclear, it has been reported that it could be due to more sensitive diagnostic tools and frequent screenings for thyroid cancer using thyroid ultrasound [3,4].
Overall, the causes of thyroid cancer are not fully established. The only proven risk factor for developing thyroid cancer is exposure to radiation, particularly in childhood [5,6]. Possible risk factors are a history of benign thyroid nodules/adenoma or goiter, iodine intake, obesity, smoking, and alcohol consumption [7-9]. Among these risk factors, smoking is a well-known risk factor for developing most cancers. However, a recent meta-analysis of 31 observational studies reported that smoking is associated with a decreased risk of thyroid cancer [10].
Moreover, previous observational studies have reported an association between alcohol intake and the risk of thyroid cancer. However, those findings remain inconsistent. In 2003, a pooled analysis of 14 case-control studies found that there was a significant trend of reduced thyroid cancer risk that was not found after adjustment for smoking [11], whereas a pooled analysis of five prospective cohort studies published in 2012 reported an inverse association between alcohol consumption and risk of thyroid cancer [12].
The current study was conducted to investigate the association between alcohol intake and risk of thyroid cancer using a meta-analysis of observational studies such as cross-sectional, case-control and cohort studies.
We searched PubMed (1970 to May 2015) and EMBASE (1987 to May 2015) for eligible studies using common keywords related to alcohol intake and the risk of thyroid cancer. The keywords for literature search were as follows: “alcohol,” “thyroid cancer,” and “cross-sectional study,” “casecontrol study,” or “cohort study.”
We included observational studies such as case-control studies and prospective or retrospective cohort studies that investigated the association between alcohol intake and the risk of thyroid cancer, reporting outcome measures with adjusted odds ratios (ORs) or relative risk (RRs) and 95% confidence intervals (CIs). If data were duplicated or shared in more than one study, the first published study or most comprehensive study was included in the analysis. The language of publication was restricted to English.
Two of the authors (S.-H.H. and H.S.K.) independently evaluated the eligibility of all studies retrieved from the databases based on the pre-determined selection criteria. Disagreements between evaluators were resolved by discussion. We extracted the following data from studies included in the final analysis: study name (along with the name of the first author and year of publication), type of study design, country, study period (years), population (age, sex), definitions of alcohol use (highest vs. lowest category), OR/RR with 95% CI, and adjustments of variables.
We assessed the methodological quality of included studies based on the Newcastle-Ottawa Scale (NOS) for assessing the quality of case-control studies and cohort studies in meta-analyses [13]. The star system of the NOS ranged from 0 to 9 and consisted of three subscales: selection of studies, comparability, and exposure. In the current study, we considered a study awarded more than a mean score of each study type to be a high-quality study because criteria for quality of a study have not been established. Two pooled studies [11,12] with 14 case-control studies, five cohort studies and a cross-sectional study were excluded from this assessment of methodological quality because no required information for the methodological assessment of each study was provided.
We investigated the association between alcohol intake (highest use vs. lowest use) and risk of thyroid cancer using adjusted ORs or RRs with 95% CIs for the main analysis. We also performed subgroup analyses based on type of thyroid cancer, gender, region of study population (America, Asia, and Europe), amount of alcohol consumed, type of alcohol, methodological quality, and type of study design (case-control or cohort studies).
To calculate a pooled OR or RR with 95% CI, we used adjusted ORs or RRs and 95% CIs reported in individual articles whenever possible. We evaluated heterogeneity in results across studies using Higgins, which measures the percentage of total variation across studies [14]. I2 was calculated as follows:
where, Q is Cochran’s heterogeneity statistic and df is the degrees of freedom. Negative values of I2 are set at zero; I2 lies between 0% (no observed heterogeneity) and 100% (maximal heterogeneity). An I2 value greater than 50% was considered to indicate substantial heterogeneity.
When substantial heterogeneity was not observed, the pooled estimate calculated based on the Fixed-effect model was reported using Woolf’s method (inverse variance method). When substantial heterogeneity was observed, the pooled estimate calculated based on the random-effects model was reported using the DerSimonian and Laird method [15].
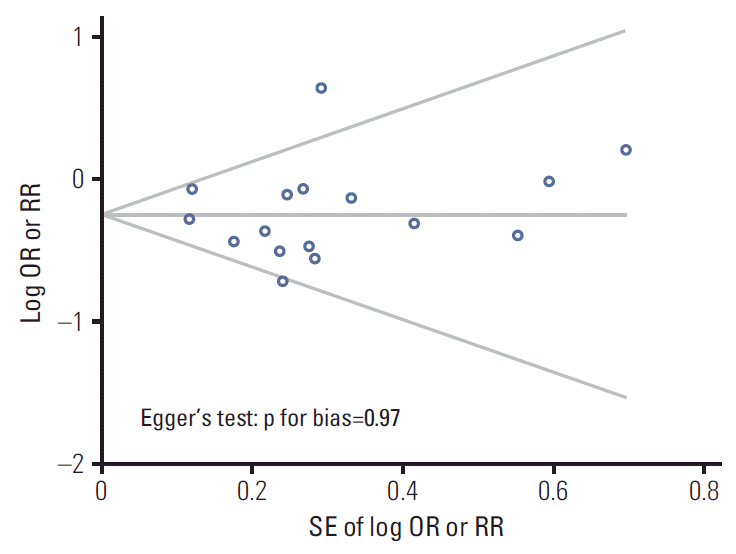
We also examined publication bias regarding the studies included in the final analysis using Begg’s funnel plot and Egger’s test. If publication bias exists, the Begg’s funnel plot is asymmetrical or the p-value is less than 0.05 by Egger’s test. Statistical analyses were conducted using the Stata SE ver. 12.1 software package (StataCorp., College Station, TX).
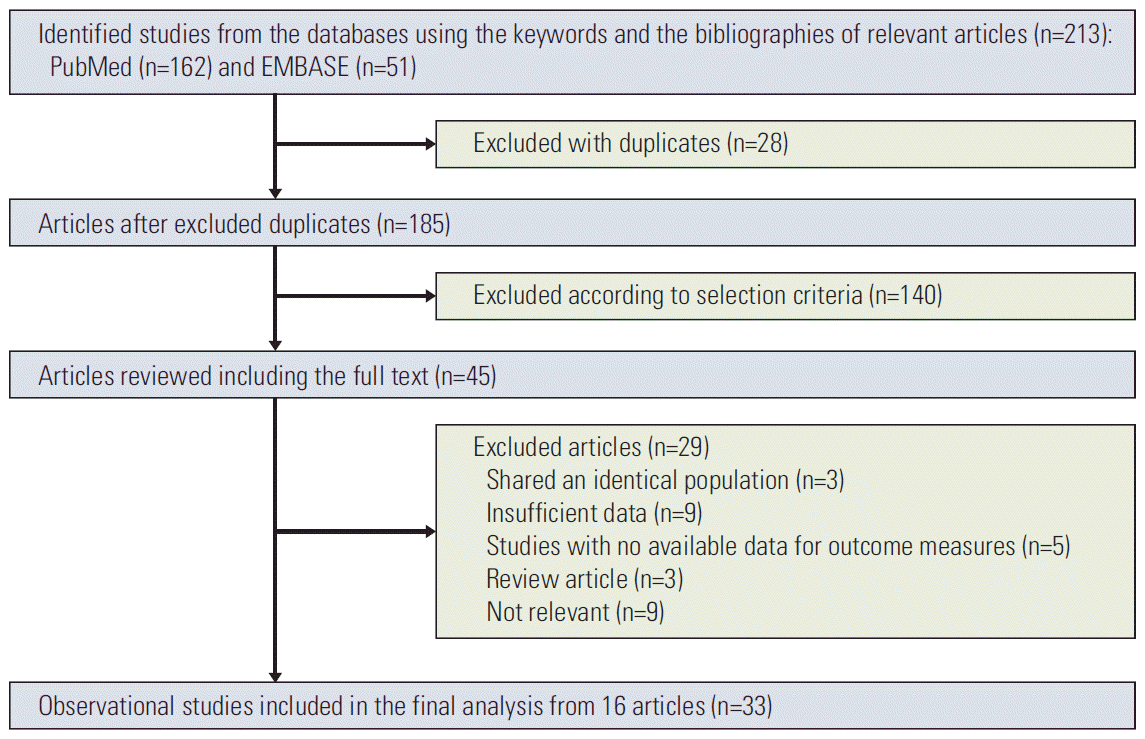
Fig. 1 shows a flow diagram of how relevant studies were identified. A total of 213 articles were identified by searching PubMed and EMBASE. We excluded 28 duplicated articles and an additional 140 articles that did not satisfy the selection criteria. The full texts of the remaining 45 articles were reviewed, and 29 additional articles were for the reasons shown in Fig. 1. The remaining 16 articles [11,12,16-29] were included in the final analysis.
We identified a total of 33 observational studies with two cross-sectional studies, 20 case-control studies, and 11 cohort studies from 16 articles, which included 7,725 thyroid cancer patients among 3,113,679 participants. Table 1 shows the general characteristics of the studies in the final analysis. The included studies were performed in the United States (n=15), Sweden (n=3), Japan (n=3), Korea (n=2), Norway (n=2), Canada (n=1), French Polynesia (n=1), Greece (n=1), Italy (n=1), New Caledonia (n=1), Switzerland (n=1), and the United Kingdom (n=1). The mean age was 48.5 years (range, 10 to 89 years), and 74% of the study participants were women. The enrolment period for participants across studies ranged between 1964 and 2013, and the follow-up periods in the cohort studies ranged from 7.2 to 23 years.
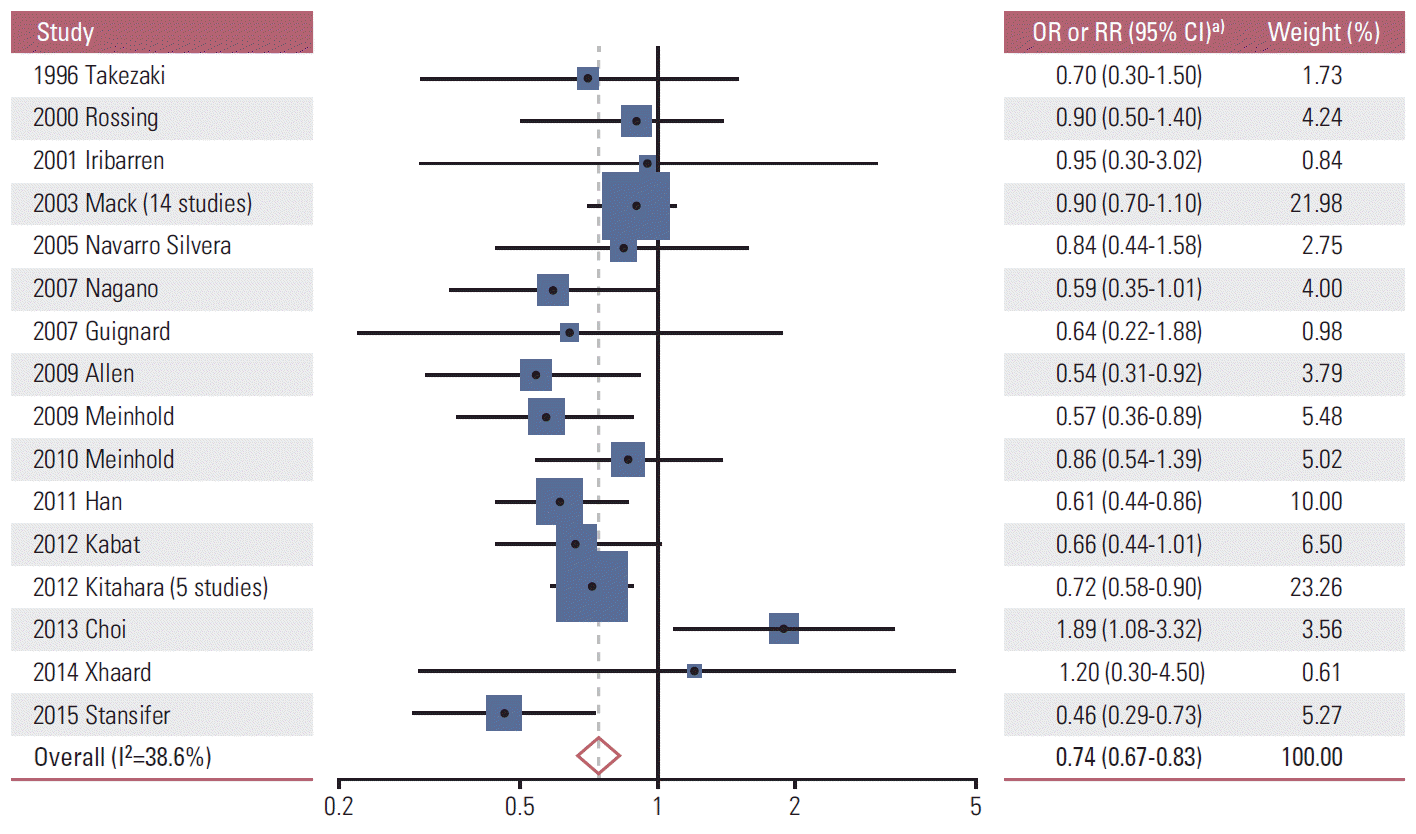
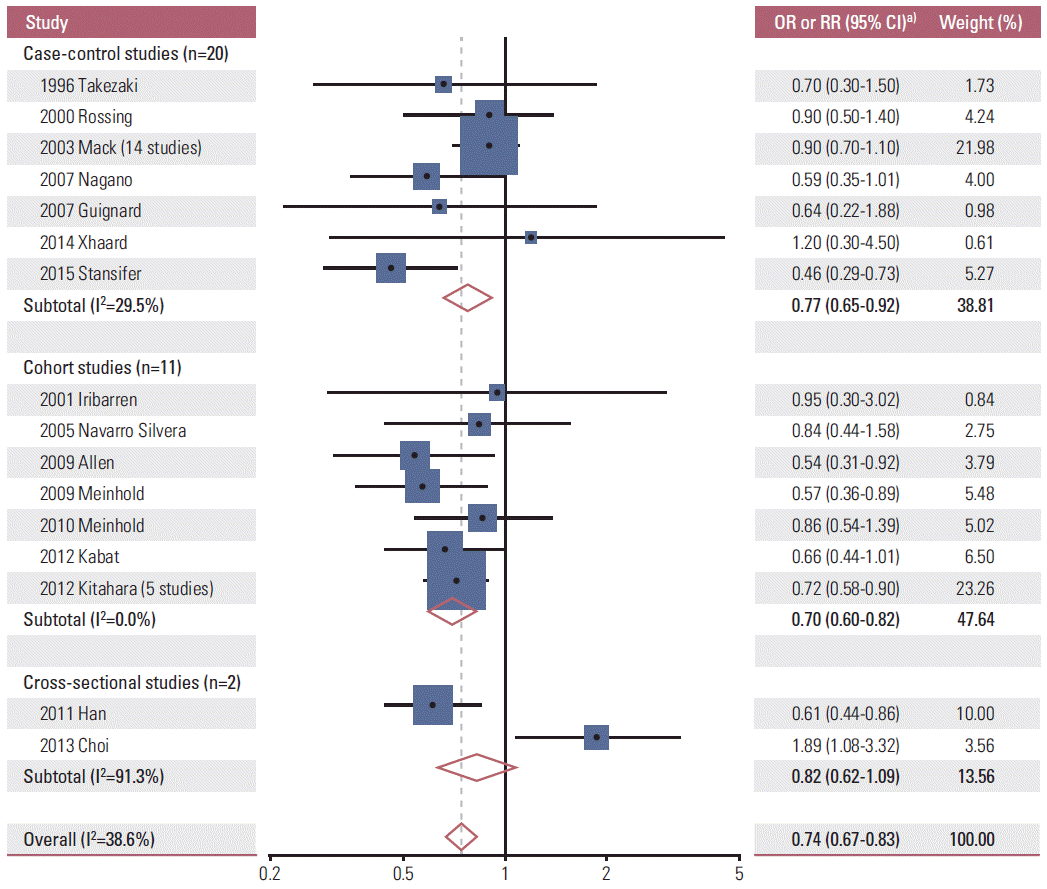
Fig. 2 shows the effect of alcohol intake on the risk of thyroid cancer in the meta-analysis of all studies. Alcohol intake (highest vs. lowest intake) was significantly associated with decreased risk of thyroid cancer in a fixed-effect model meta-analysis of all 33 observational studies (OR or RR, 0.74; 95% CI, 0.67 to 0.83; I2=38.6%). As shown in Fig. 3, in the subgroup meta-analysis by type of study, alcohol intake also decreased the risk of thyroid cancer in both case-control studies (OR, 0.77; 95% CI, 0.65 to 0.92; I2=29.5%; n=20) and cohort studies (RR, 0.70; 95% CI, 0.60 to 0.82; I2=0%; n=11), but not in cross-sectional studies (OR, 0.82; 95% CI, 0.62 to 1.09; I2=91.3%; n=2). There was no publication bias in the 33 studies (Begg’s funnel plot was symmetric; Egger’s test, p for bias=0.97) (Fig. 4).
Table 2 shows the methodological quality of studies included in the final analysis based on the NOS. The quality scores ranged from 4 to 9, with an average score of 6.3 for case-control studies and 6.5 for cohort studies. The high-quality studies (score of 7 or higher) included two case-control studies and three cohort studies.
Table 3 summarizes the results from the subgroup meta-analyses based on several factors. In the subgroup meta-analyses by type of thyroid cancer, sex, and amount of alcohol consumed, alcohol intake was significantly associated with a decreased risk of thyroid cancer. The subgroup meta-analyses by geographic region showed that alcohol intake was associated with a decreased risk of thyroid cancer in the American region (OR or RR, 0.70; 95% CI, 0.60 to 0.81; I2=0%; n=12), but not in the European (OR or RR, 0.60; 95% CI, 0.36 to 1.00; I2=13.1%; n=2) or Asian regions (OR or RR, 0.82; 95% CI, 0.48 to 1.42; I2=76.3%; n=4).
Moreover, subgroup meta-analyses by methodological quality of study indicated that alcohol intake decreased the risk of thyroid cancer in both high-quality studies (OR or RR, 0.64; 95% CI, 0.50 to 0.82; I2=0%; n=5) and low quality studies (OR or RR, 0.68; 95% CI, 0.55 to 0.85; I2=6.7%; n=7).
Tables 4 and 5 show the findings from the subgroup meta-analyses based on various factors within each study design (case-control study and cohort study). Overall, subgroup meta-analyses of cohort studies by various factors indicated that alcohol intake significantly decreased the risk of thyroid cancer, whereas those of case-control studies indicated that alcohol intake decreased the risk of thyroid cancer, although this decrease was not statistically significant.
In this meta-analysis, we found that there was an inverse association between alcohol intake and the risk of thyroid cancer. Moreover, overall, alcohol intake was associated with a decreased risk of thyroid cancer in the subgroup meta-analyses by type of thyroid cancer, sex, amount of drink, and methodological quality of study. In the subgroup meta-analyses by various factors within each study design, alcohol intake consistently showed a significantly decreased risk of thyroid cancer in both case-control and cohort studies, but a non-significantly decreased risk in cross-sectional studies.
There are several biological mechanisms that may explain the inverse association between alcohol intake and the risk of thyroid cancer observed in our meta-analysis. First, alcohol intake may have a protective effect on developing thyroid cancer by decreased levels of thyroid-stimulating hormone (TSH). TSH made by the pituitary gland is a well-established growth factor for thyroid nodules, and it is known that higher serum TSH levels are associated with higher rates of thyroid cancer [30]. An animal study demonstrated that chronic alcohol exposure reduces the responsiveness of the hypo-thalamic-pituitary-thyroid axis to central stimulation [31]. Moreover, many cross-sectional and longitudinal studies have reported that a blunting of the plasma TSH response in the thyrotropin releasing hormone stimulation test was consistently observed in patients of alcohol dependence compared to healthy people [32]. Another biological mechanism is that alcohol has a direct toxic effect on thyroid cells and reduces thyroid volume [33,34], which might lead to a decreased risk of thyroid cancer. However, a cross-sectional study found an increasing dose-response association between alcohol intake and the risk of thyroid enlargement [35].
To the best of our knowledge, this study is the most comprehensive meta-analysis of observational studies on the association between alcohol intake and the risk of thyroid cancer. Many epidemiological observational studies have reported inconsistent findings on this issue. In 2003, Mack et al. [11] conducted a pooled analysis of 14 case-control studies that indicated alcohol intake was associated with a reduced risk of thyroid. However, after adjustment for smoking, the reduced risk was not maintained. In 2012, a pooled analysis of five prospective cohort studies from the United States revealed that alcohol intake of more than seven drinks per week was inversely associated with the risk of thyroid cancer after adjustment for smoking [12]. Our meta-analysis involved 14 additional observational studies with cross-sectional, case-control, cohort studies as well as 20 case-control and cohort studies from those two pooled analyses. Four additional case-control studies have been conducted since the pooled analysis by Mack et al. [11] was published, most of which reported a protective effect of alcohol intake against the risk of cancer. Conversely, Xhaard et al. [28] showed an increased risk of thyroid cancer, although this increase was not significant. In the present study, a meta-analysis of 11 cohort studies (including six cohort studies published individually and five cohort studies from a pooled analysis) indicated that alcohol intake decreased the risk of thyroid cancer. Given that a cohort study generally shows a higher level of evidence than a case-control study, we believe that the results of the meta-analysis of cohort studies are more reliable than those from the meta-analysis of case-control studies.
When we performed subgroup meta-analyses by various factors, alcohol intake was consistently associated with a decreased risk of thyroid cancer, regardless of the type of thyroid cancer, sex, and amount of alcohol consumed. Even though alcohol intake had no association with thyroid cancer risk in the subgroup meta-analyses by study region (European and Asian regions), type of alcohol (wine, beer, or liquor), or methodological quality of study (low-quality studies), it is considered that those findings are attributable to the relatively small number of studies included in the analysis.
The subgroup meta-analyses by various factors within each study design showed that alcohol intake was consistently associated with a significantly decreased risk of thyroid cancer in both case-control and cohort studies, but a non-significantly decreased risk in cross-sectional studies. The non-significant findings in cross-sectional studies are also thought to be due to the small numbers of studies in the subgroup meta-analysis.
Choi et al. [27] conducted a study in Korea that showed an apparent increased risk of thyroid cancer in drinkers, unlike the other studies. We do not have any clear explanation for this finding. However, it should be noted that the study conducted by Choi et al. [27] had several limitations. Specifically, they determined whether respondents consumed alcohol simply based on asking “drinking or not,” not the amount of alcohol consumed. Moreover, they used a cross-sectional design, which is generally considered to provide a lower level of evidence than case-control studies or cohort studies. Conversely, a recent case-control study conducted in Korea reported that acute high-dose alcohol intake (151 g or more per event or on a single occasion) and long-term intake of alcohol for 31 or more years are associated with an increased risk of differentiated thyroid cancer [36]. Overall, further prospective studies are warranted to confirm the association between heavy drinking and the risk of thyroid cancer.
It should be noted that our study has several limitations. First, definitions for one drink of alcohol in each study included in the analysis were not identical. For example, Allen et al. used the total number of alcoholic drinks containing about 10 g of alcohol to categorize study participants into five groups [22], whereas Kitahara et al. [12] considered one drink to be equal to 14 g of alcohol. However, this discrepancy in the definitions for one drink would not lead to serious bias in our main findings on the association between alcohol intake and the risk of thyroid cancer. We were also not able to explain the exact reasons for the decreased risk of thyroid cancer associated with alcohol intake because we only included observational studies. Although we described possible mechanisms previously in the discussion section, further research is required to confirm these potential mechanisms. Moreover, we have limited information regarding alcohol intake during follow-up in cohort studies because information was collected only at one specific baseline point in time. Finally, due to a paucity of information in individual studies, we were unable to investigate the effects of alcohol intake on the risk of thyroid cancer according to types of alcohol beverages.
In conclusion, we found that alcohol intake was significantly associated with a decreased risk of thyroid cancer in the meta-analysis of observational epidemiological studies such as cross-sectional, case-control, and cohort studies. Moreover, cohort studies with a higher level of evidence consistently indicated this association. However, our findings should not be interpreted as indicating that alcohol intake can be recommended to prevent the development of thyroid cancer because alcohol intake is still a major risk factor for the development or aggravation of other various diseases such as several types of cancers (oropharyngeal cancer, laryngeal cancer, breast cancer, and colorectal cancer), liver diseases, and alcohol abuse.
The definite biological mechanism for the association between alcohol intake and thyroid cancer still remains uncertain. Further research is required to confirm the association between alcohol intake and the risk of cancer.
References
1. Stewart BW, Wild CP. World cancer report 2014. Lyon: IARC Press;2014.
2. Pellegriti G, Frasca F, Regalbuto C, Squatrito S, Vigneri R. Worldwide increasing incidence of thyroid cancer: update on epidemiology and risk factors. J Cancer Epidemiol. 2013; 2013:965212.
3. Wartofsky L. Increasing world incidence of thyroid cancer: increased detection or higher radiation exposure? Hormones (Athens). 2010; 9:103–8.
5. Ron E, Schneider AB. Thyroid cancer. In : Schottenfeld D, Fraumeni JF, editors. Cancer epidemiology and prevention. 3rd ed. New York: Oxford University Press;2006. p. 975–94.
6. Thyroid cancer: what are the risk factors for thyroid cancer [Internet]. Atlanta, GA: American Cancer Society;2016. [cited 2016 Jan 5]. Available from: http://www.cancer.org/cancer/thyroidcancer/detailedguide/thyroid-cancer-risk-factors.
7. Dal Maso L, Bosetti C, La Vecchia C, Franceschi S. Risk factors for thyroid cancer: an epidemiological review focused on nutritional factors. Cancer Causes Control. 2009; 20:75–86.
8. Truong T, Baron-Dubourdieu D, Rougier Y, Guenel P. Role of dietary iodine and cruciferous vegetables in thyroid cancer: a countrywide case-control study in New Caledonia. Cancer Causes Control. 2010; 21:1183–92.
9. Kitahara CM, Platz EA, Freeman LE, Hsing AW, Linet MS, Park Y, et al. Obesity and thyroid cancer risk among U.S. men and women: a pooled analysis of five prospective studies. Cancer Epidemiol Biomarkers Prev. 2011; 20:464–72.
10. Cho YA, Kim J. Thyroid cancer risk and smoking status: a meta-analysis. Cancer Causes Control. 2014; 25:1187–95.
11. Mack WJ, Preston-Martin S, Dal Maso L, Galanti R, Xiang M, Franceschi S, et al. A pooled analysis of case-control studies of thyroid cancer: cigarette smoking and consumption of alcohol, coffee, and tea. Cancer Causes Control. 2003; 14:773–85.
12. Kitahara CM, Linet MS, Beane Freeman LE, Check DP, Church TR, Park Y, et al. Cigarette smoking, alcohol intake, and thyroid cancer risk: a pooled analysis of five prospective studies in the United States. Cancer Causes Control. 2012; 23:1615–24.
13. Wells GA, Shea B, O’Connell D, Peterson J, Welch V, Losos M, et al. The Newcastle-Ottawa Scale (NOS) for assessing the quality of nonrandomised studies in meta-analyses [Internet]. Ottawa: The Ottwa Hospital, Research Institute;2016. [cited 2016 Feb 2]. Available from: http://www.ohri.ca/programs/clinical_epidemiology/oxford.htm.
14. Higgins JP, Thompson SG. Quantifying heterogeneity in a meta-analysis. Stat Med. 2002; 21:1539–58.
16. Takezaki T, Hirose K, Inoue M, Hamajima N, Kuroishi T, Nakamura S, et al. Risk factors of thyroid cancer among women in Tokai, Japan. J Epidemiol. 1996; 6:140–7.
17. Rossing MA, Cushing KL, Voigt LF, Wicklund KG, Daling JR. Risk of papillary thyroid cancer in women in relation to smoking and alcohol consumption. Epidemiology. 2000; 11:49–54.
18. Iribarren C, Haselkorn T, Tekawa IS, Friedman GD. Cohort study of thyroid cancer in a San Francisco Bay area population. Int J Cancer. 2001; 93:745–50.
19. Navarro Silvera SA, Miller AB, Rohan TE. Risk factors for thyroid cancer: a prospective cohort study. Int J Cancer. 2005; 116:433–8.
20. Guignard R, Truong T, Rougier Y, Baron-Dubourdieu D, Guenel P. Alcohol drinking, tobacco smoking, and anthropometric characteristics as risk factors for thyroid cancer: a countrywide case-control study in New Caledonia. Am J Epidemiol. 2007; 166:1140–9.
21. Nagano J, Mabuchi K, Yoshimoto Y, Hayashi Y, Tsuda N, Land C, et al. A case-control study in Hiroshima and Nagasaki examining non-radiation risk factors for thyroid cancer. J Epidemiol. 2007; 17:76–85.
22. Allen NE, Beral V, Casabonne D, Kan SW, Reeves GK, Brown A, et al. Moderate alcohol intake and cancer incidence in women. J Natl Cancer Inst. 2009; 101:296–305.
23. Meinhold CL, Park Y, Stolzenberg-Solomon RZ, Hollenbeck AR, Schatzkin A, Berrington de Gonzalez A. Alcohol intake and risk of thyroid cancer in the NIH-AARP Diet and Health Study. Br J Cancer. 2009; 101:1630–4.
24. Meinhold CL, Ron E, Schonfeld SJ, Alexander BH, Freedman DM, Linet MS, et al. Nonradiation risk factors for thyroid cancer in the US Radiologic Technologists Study. Am J Epidemiol. 2010; 171:242–52.
25. Han MA, Choi KS, Lee HY, Kim Y, Jun JK, Park EC. Current status of thyroid cancer screening in Korea: results from a nationwide interview survey. Asian Pac J Cancer Prev. 2011; 12:1657–63.
26. Kabat GC, Kim MY, Wactawski-Wende J, Rohan TE. Smoking and alcohol consumption in relation to risk of thyroid cancer in postmenopausal women. Cancer Epidemiol. 2012; 36:335–40.
27. Choi SW, Ryu SY, Han MA, Park J. The association between the socioeconomic status and thyroid cancer prevalence: based on the Korean National Health and Nutrition Examination Survey 2010-2011. J Korean Med Sci. 2013; 28:1734–40.
28. Xhaard C, Ren Y, Clero E, Maillard S, Brindel P, Rachedi F, et al. Differentiated thyroid carcinoma risk factors in French Polynesia. Asian Pac J Cancer Prev. 2014; 15:2675–80.
29. Stansifer KJ, Guynan JF, Wachal BM, Smith RB. Modifiable risk factors and thyroid cancer. Otolaryngol Head Neck Surg. 2015; 152:432–7.
30. Boelaert K. The association between serum TSH concentration and thyroid cancer. Endocr Relat Cancer. 2009; 16:1065–72.
31. Zoeller RT, Fletcher DL, Simonyl A, Rudeen PK. Chronic ethanol treatment reduces the responsiveness of the hypothalamic- pituitary-thyroid axis to central stimulation. Alcohol Clin Exp Res. 1996; 20:954–60.
32. Balhara YP, Deb KS. Impact of alcohol use on thyroid function. Indian J Endocrinol Metab. 2013; 17:580–7.
33. Hegedus L, Rasmussen N, Ravn V, Kastrup J, Krogsgaard K, Aldershvile J. Independent effects of liver disease and chronic alcoholism on thyroid function and size: the possibility of a toxic effect of alcohol on the thyroid gland. Metabolism. 1988; 37:229–33.
34. Knudsen N, Bulow I, Laurberg P, Perrild H, Ovesen L, Jorgensen T. Alcohol consumption is associated with reduced prevalence of goitre and solitary thyroid nodules. Clin Endocrinol (Oxf). 2001; 55:41–6.
Table 1.
Study | Type of study | Country | Years enrolled | Population (sex, age) | Type of thyroid cancer | Definition of alcohol use (highest vs. lowest category) | OR/RR (95% Cl) | Adjusted variable |
---|---|---|---|---|---|---|---|---|
Takezaki et al. (1996) [16] | Case-control study | Japan | 1988-1993 | 94 cases and 26,666 controls (women, 20-79 yr) | Papillary or follicular thyroid cancer | Sometimes or less/≥ 4 times/wk | 0.70 (0.30-1.50) | Age and year of visit |
Rossing et al. (2000) [17] | Case-control study | United States | 1988-1994 | 468 cases and 574 controls, (women, 18-64 yr) | Papillary thyroid cancer | 7 drinks/wk, vs. never, 1 drink: not specified | 0.90 (0.50-1.40) | Age, country of residence, race, marital status, education, history of radiation treatment, and smoking |
fribarren et al. (2001) [18] | Prospective cohort study | United States | 1964-1973 | 204,964 persons and 169 cases (men and women, 10-89 yr) | All types of thyroid cancer | ≥ 6 drinks/day vs. 1-2 drinks/day, 1 drink: not specified | 0.95 (0.30-3.02) | Age, sex, race, level of education, cigarette smoking, self-reported personal history, family history of thyroid disease, body mass index, weight gain, height, and occupational exposures |
Mack et al. (2003) [11] | Pooled analysis of 14 case-control studies | United States, Europe, and Asia | 1980-1997 | 2,725 cases and 4,776 controls (men and women, all ages) | All types of thyroid cancer | > 14 drinks/wk vs. none, 1 drink: one glass of wine or beer | 0.90 (0.70-1.10) | Study, sex, and age |
Navarro Silvera et al. (2005) [19] | Prospective cohort study | Canada | 1980-1985 | 89,835 persons and 169 cases (women, 40-59 yr) | All types of thyroid cancer | ≥ 10 g/day vs. none | 0.84 (0.44-1.58) | Age, education, BMI, and pack-years of smoking |
Nagano et al. (2007) [21] | Case-control study | Japan | 1970-1986 | 362 cases and 435 controls (men and women, > 75 yr) | Papillary or follicular thyroid cancer | Daily vs. never | 0.59 (0.35-1.01) | Family history of cancer, past history of goiter or thyroid nodule, and smoking history |
Guignard et al. (2007) [20] | Case-control study | New Caledonia | 1993-1999 | 332 cases and 412 controls (men and women ≥ 70 yr) | Papillary or follicular thyroid cancer | > 10 drinks/wk vs. never, 1 drink: an ordinary glass of any alcoholic beverage | 0.64 (0.22-1.88) | Age, year of reference, ethnic group, and number of pack-years |
Allen et al. (2009) [22] | Prospective cohort study | United Kingdom | 1996-2001 | 1,280,296 persons and 421 cases (women, average 55 yr) | All types of thyroid cancer | ≥ 15 drinks/wk vs. none, 1 drink: about 10 g of alcohol | 0.54 (0.31-0.92) | Age, region of residence, socioeconomic status,BMI, smoking, physical activity, use of oral contraceptives, and hormone replacement therapy |
Meinhold et al. (2009) [23] | Prospective cohort study | United States | 1995-1996 | 490,159 persons and 370 cases (men and women, 50-71 yr) | All types of thyroid cancer | ≥ 2 drinks/day vs. none, 1 drink: 12.96 g-13.93 g of ethanol according to type of alcoholic beverage | 0.57 (0.36-0.89) | Age, sex, race, education, smoking status, BMI, and family history of cancer |
Meinhold et al. (2010) [24] | Prospective cohort study | United States | 1983-2006 | 90,713 persons and 282 cases (men and women, all years) | All types of thyroid cancer | ≥ 7 drinks/wk vs. none, 1 drink: not specified | 0.86 (0.54-1.39) | Birth year, smoking, BMI, number of radiographs to the head and neck, and medical history of benign thyroid conditions |
Han et al. (2011) [25] | Cross-sectional study | Korea | 2009 | 2,000 persons and 263 cases (≥ 40 yr men, ≥ 30 yr women) | All types of thyroid cancer | ≥ 1 frequency/mo vs. none | 0.61 (0.44-0.86) | Age, residence, education, income, marital status, job, self-rated health, smoking, and vigorous exercise |
Kabat et al. (2012) [26] | Prospective cohort study | United States | 1993-1998 | 159,340 persons and 331 cases (women, 50-79 yr) | All types of thyroid cancer | ≥ 7 drinks/wk vs. none, 1 drink: not specified | 0.66 (0.44-1.01) | Age, education, pack-years of smoking, age of first pregnancy, age at menopause, hormone therapy, history of benign thyroid disease, observational study component/clinical trial component, and randomization status in CT |
Kitahara et al. (2012) [12] | Pooled analysis of five prospective cohort studies | United States | 1983-2009 | 746,097 persons and 1,003 cases (men and women, all years) | All types of thyroid cancer | ≥ 7 drinks/wk vs. none, 1 drink: 14 g of alcohol | 0.72 (0.58-0.90) | Age, sex, education, race, marital status, BMI, and smoking status |
Choi et al. (2013) [27] | Cross-sectional study | Korea | 2010-2011 | 12,276 persons and 71 cases (men and women, all years) | All types of thyroid cancer | Drinking vs. non-drinking | 1.89 (1.08-3.32) | Age, sex, weight, height, survey year, monthly household income, education, marital status, residential area, smoking, and physically active |
Xhaard et al. (2014) [28] | Case-control study | French Polynesia | 1981-2003 | 229 cases and 373 controls men and women, 10-62 yr) | All types of thyroid cancer | Regular alcohol consumption yes vs. no | 1.20 (0.30-4.50) | BMI, height, number of pregnancies, menopausal status, nuclear worker, family history of thyroid cancer, education, and irradiation of the neck |
Stansifer et al. (2015) [29] | Retrospective case-control study | United States | 2013 | 467 cases and 255 controls (men and women, ≥ 18 yr) | All types of thyroid cancer | Current drinker vs. never drinker | 0.46 (0.29-0.73) | None |
Table 2.
Case-control studies (n=6) |
Cohort studies (n=6) |
|||||||||||
---|---|---|---|---|---|---|---|---|---|---|---|---|
Takezaki et al. (1996) [16] | Rossing et al. (2000) [17] | Nagano et al. (2007) [21] | Guignard et al. (2007) [20] | Xhaard et al. (2014) [28] | Stansifer et al. (2015) [29] | Iribarren et al. (2001) [18] | Navarro Silvera et al. (2005) [19] | Allen et al. (2009) [22] | Meinhold et al. (2009) [23] | Meinhold et al. (2010) [24] | Rabat et al. (2012) [26] | |
Selection | ||||||||||||
Adequate definition of cases | 1 | 0 | 1 | 1 | 1 | 0 | - | - | - | - | - | - |
Representativeness of cases | 1 | 1 | 1 | 1 | 1 | 1 | - | - | - | - | - | - |
Selection of controls | 0 | 1 | 1 | 1 | 1 | 1 | - | - | - | - | - | - |
Definition of controls | 1 | 0 | 1 | 1 | 0 | 1 | - | - | - | - | - | - |
Comparability | - | - | - | - | - | - | ||||||
Control for important factor or additional factor | 2 | 2 | 2 | 2 | 2 | 0 | - | - | - | - | - | - |
Exposure | ||||||||||||
Ascertainment of exposure (blinding) | 0 | 0 | 1 | 0 | 0 | 0 | - | - | - | - | - | - |
Same method of ascertainment for participants | 1 | 1 | 1 | 1 | 1 | 1 | - | - | - | - | - | - |
Nonresponse rate | 0 | 0 | 1 | 1 | 0 | 0 | - | - | - | - | - | - |
Total | 6 | 5 | 9 | 8 | 6 | 4 | - | - | - | - | - | - |
Selection | ||||||||||||
Representativeness of the exposed cohort | - | - | - | 1 | 1 | 1 | 1 | 0 | 1 | |||
Selection of the nonexposed cohort | - | - | - | - | - | - | 1 | 1 | 1 | 1 | 1 | 1 |
Ascertainment of exposure | - | - | - | - | - | - | 0 | 0 | 0 | 0 | 0 | 0 |
Outcome of interest was not present at start of study | - | - | - | - | - | - | 0 | 1 | 1 | 1 | 1 | 0 |
Comparability | ||||||||||||
Control for important factor or additional factor | - | - | - | - | - | - | 2 | 2 | 2 | 2 | 2 | 2 |
Outcome | ||||||||||||
Assessment of outcome | - | - | - | - | - | - | 1 | 1 | 1 | 1 | 1 | 1 |
Follow-up long enough for outcomes to occur | - | - | - | - | - | - | 1 | 1 | 1 | 0 | 1 | 1 |
Adequacy of follow-up of cohorts | - | - | - | - | - | - | 0 | 0 | 0 | 0 | 0 | 1 |
Total | - | - | - | - | - | - | 6 | 7 | 7 | 6 | 6 | 7 |
Table 3.
Factor | No. of studies | Summary OR or RR (95% CI) | Heterogeneity, I2 (%) | Model used |
---|---|---|---|---|
All [11,12,16-19] | 33 | 0.74 (0.67-0.83) | 38.6 | Fixed-effect |
Type of cancer | ||||
All types of thyroid cancer [11,12,18,19,22-29] | 29 | 0.74 (0.62-0.89) | 52.3 | Random-effects |
Papillary thyroid cancer [17,19,23,26] | 4 | 0.70 (0.55-0.91) | 0 | Fixed-effect |
Papillary or follicular thyroid cancer [16,19-21] | 4 | 0.68 (0.48-0.96) | 0 | Fixed-effect |
Sex | ||||
Female [16,17,19-26] | 10 | 0.71 (0.60-0.84) | 0 | Fixed-effect |
Male [20,21,23-25] | 5 | 0.57 (0.39-0.82) | 0 | Fixed-effect |
Region | ||||
America [12,17-19,23,24,26,29] | 12 | 0.70 (0.60-0.81) | 0 | Fixed-effect |
Europe [22,28] | 2 | 0.60 (0.36-1.00) | 13.1 | Fixed-effect |
Asia [16,21,25,27] | 4 | 0.82 (0.48-1.42) | 76.3 | Random-effects |
Amount of alcohol consumed (vs. never or rarely drink) | ||||
≤ 1-2 Drinks/wk [11,12,17,20,22-24,26] | 25 | 0.89 (0.82-0.97) | 0 | Fixed-effect |
1-6 Drinks/wk [12,17,20,22-24,26] | 11 | 0.83 (0.76-0.92) | 15.5 | Fixed-effect |
7-14 Drinks/wk [11,12,17,20-24,26,29] | 27 | 0.75 (0.67-0.83) | 15.0 | Fixed-effect |
> 14 Drinks/wk [11,18,22,23] | 17 | 0.80 (0.67-0.96) | 30.2 | Fixed-effect |
Type of alcohol | ||||
Wine [11,23] | 15 | 0.95 (0.76-1.19) | 0 | Fixed-effect |
Beer [11,23] | 15 | 0.63 (0.34-1.16) | 66.3 | Random-effects |
Wine and beer [11] | 14 | 0.90 (0.70-1.10) | NA | Fixed-effect |
Liquor [23] | 1 | 1.02 (0.68-1.53) | NA | Fixed-effect |
Methodological quality | ||||
High quality [19-22,26] | 5 | 0.64 (0.50-0.82) | 0 | Fixed-effect |
Low quality [16-18,23,24,28,29] | 7 | 0.68 (0.55-0.85) | 6.7 | Fixed-effect |
Table 4.
Factor | No. of studies | Summary OR or RR (95% CI) | Heterogeneity, I2 (%) | Model used |
---|---|---|---|---|
All Low quality [11,16,17,20,21,28,29] | 20 | 0.77 (0.65-0.92) | 29.5 | Fixed-effect |
Type of cancer | ||||
All types of thyroid cancer [11,28,29] | 16 | 0.72 (0.41-1.25) | 71.1 | Random-effects |
Papillary thyroid cancer [17] | 1 | 0.90 (0.50-1.40) | NA | Fixed-effect |
Papillary or follicular thyroid cancer [16,20,21] | 3 | 0.62 (0.41-0.94) | 0 | Fixed-effect |
Sex | ||||
Female [16,17,20,21] | 4 | 0.84 (0.59-1.19) | 0 | Fixed-effect |
Male [20,21] | 2 | 0.35 (0.12-1.03) | 0 | Fixed-effect |
Region | ||||
America [17,29] | 2 | 0.64 (0.33-1.23) | 72.4 | Fixed-effect |
Asia [16,21] | 2 | 0.62 (0.40-0.97) | 0 | Fixed-effect |
Europe [28] | 1 | 1.20 (0.30-4.50) | NA | Fixed-effect |
Amount of alcohol consumed (vs. never or rarely drink) | ||||
≤ 1-2 Drinks/wk [11,17,20] | 16 | 0.80 (0.68-0.93) | 25.1 | Fixed-effect |
1-6 Drinks/wk [17,20] | 2 | 0.54 (0.39-0.75) | 0 | Fixed-effect |
7-14 Drinks/wk [11,17,20,21,29] | 18 | 0.72 (0.52-0.98) | 53.5 | Random-effects |
> 14 Drinks/wk [11] | 14 | 0.90 (0.70-1.10) | NA | Fixed-effect |
Methodological quality | ||||
High quality [20,21] | 2 | 0.60 (0.37-0.96) | 0 | Fixed-effect |
Low quality [16,17,28,29] | 4 | 0.65 (0.48-0.89) | 33.5 | Fixed-effect |
Table 5.
Factor | No. of studies | Summary OR or RR (95% CI) | Heterogeneity, I2 (%) | Model used |
---|---|---|---|---|
All [12,18,19,22-24,26] | 11 | 0.70 (0.60-0.82) | 0 | |
Type of cancer | ||||
All types of thyroid cancer [12,18,19,22-24,26] | 11 | 0.70 (0.60-0.82) | 0 | Fixed-effect |
Papillary thyroid cancer [19,23,26] | 3 | 0.65 (0.49-0.87) | 0 | Fixed-effect |
Papillary or follicular thyroid cancer [19] | 1 | 0.84 (0.44-1.58) | NA | Fixed-effect |
Sex | ||||
Female [19,22-24,26] | 5 | 0.67 (0.53-0.84) | 0 | Fixed-effect |
Male [23,24] | 2 | 0.70 (0.43-1.14) | 0 | Fixed-effect |
Region | ||||
America [12,18,19,23,24,26] | 10 | 0.72 (0.61-0.84) | 0 | Fixed-effect |
Europe [22] | 1 | 0.54 (0.31-0.92) | NA | Fixed-effect |
Amount of alcohol consumed (vs. never or rarely drink) | ||||
≤ 1-2 Drinks/wk [12,22-24,26] | 9 | 0.93 (0.85-1.03) | 0 | Fixed-effect |
1-6 Drinks/wk [12,22-24,26] | 9 | 0.87 (0.78-0.96) | 0 | Fixed-effect |
7-14 Drinks/wk [12,22-24,26] | 9 | 0.71 (0.62-0.82) | 0 | Fixed-effect |
> 14 Drinks/wk [18,22,23] | 3 | 0.66 (0.49-0.88) | 0 | Fixed-effect |
Methodological quality | ||||
High quality [19,22,26] | 3 | 0.66 (0.49-0.88) | 0 | Fixed-effect |
Low quality [18,23,24] | 3 | 0.71 (0.52-0.97) | 0 | Fixed-effect |