Introduction
Materials and Methods
1. Cell culture and regents
2. CCK-8 viability assay
3. Flow cytometric assay
4. Western blot
5. Transfection with small interference RNA
6. Real-time fluorescent quantitative polymerase chain reaction
7. Tumor xenograft model
8. Immunohistochemistry
9. Quantitative assessment of apoptosis
10. Statistical analysis
Results
1. Metformin inhibited the proliferation of ESCCs
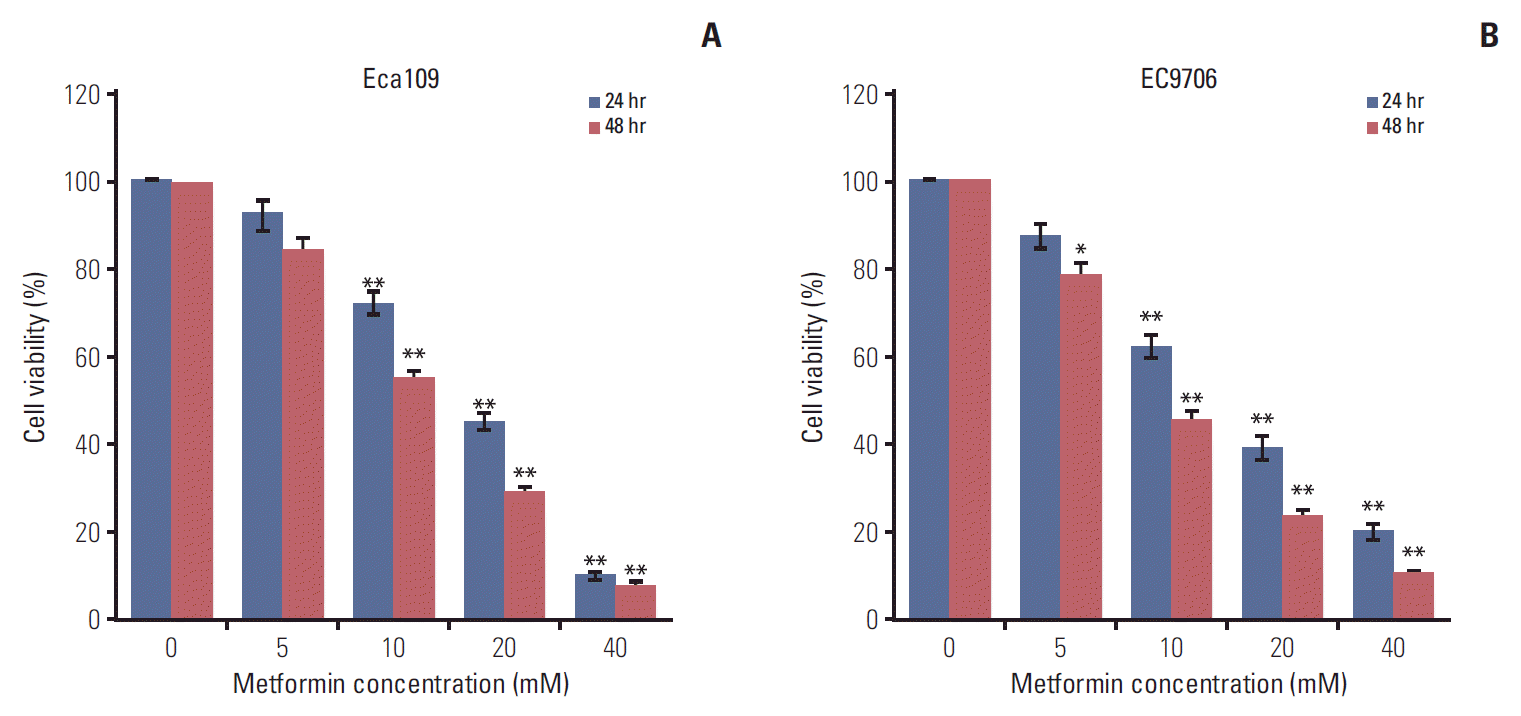 | Fig. 1.Metformin inhibited the proliferation of esophageal cancer cells. Eca109 and EC9706 cells were treated with metformin (0, 5, 10, 20, and 40 mM) for 24 hours and 48 hours. Cell viability was determined by Cell Counting Kit-8. (A) Metformin reduced Eca109 cell viability. (B) Metformin decreased EC9706 cell viability. Data represent the mean±standard deviation of three independent experiments (*p < 0.05, **p < 0.01). |
2. Metformin induced G0/G1 phase cell cycle arrest and apoptosis
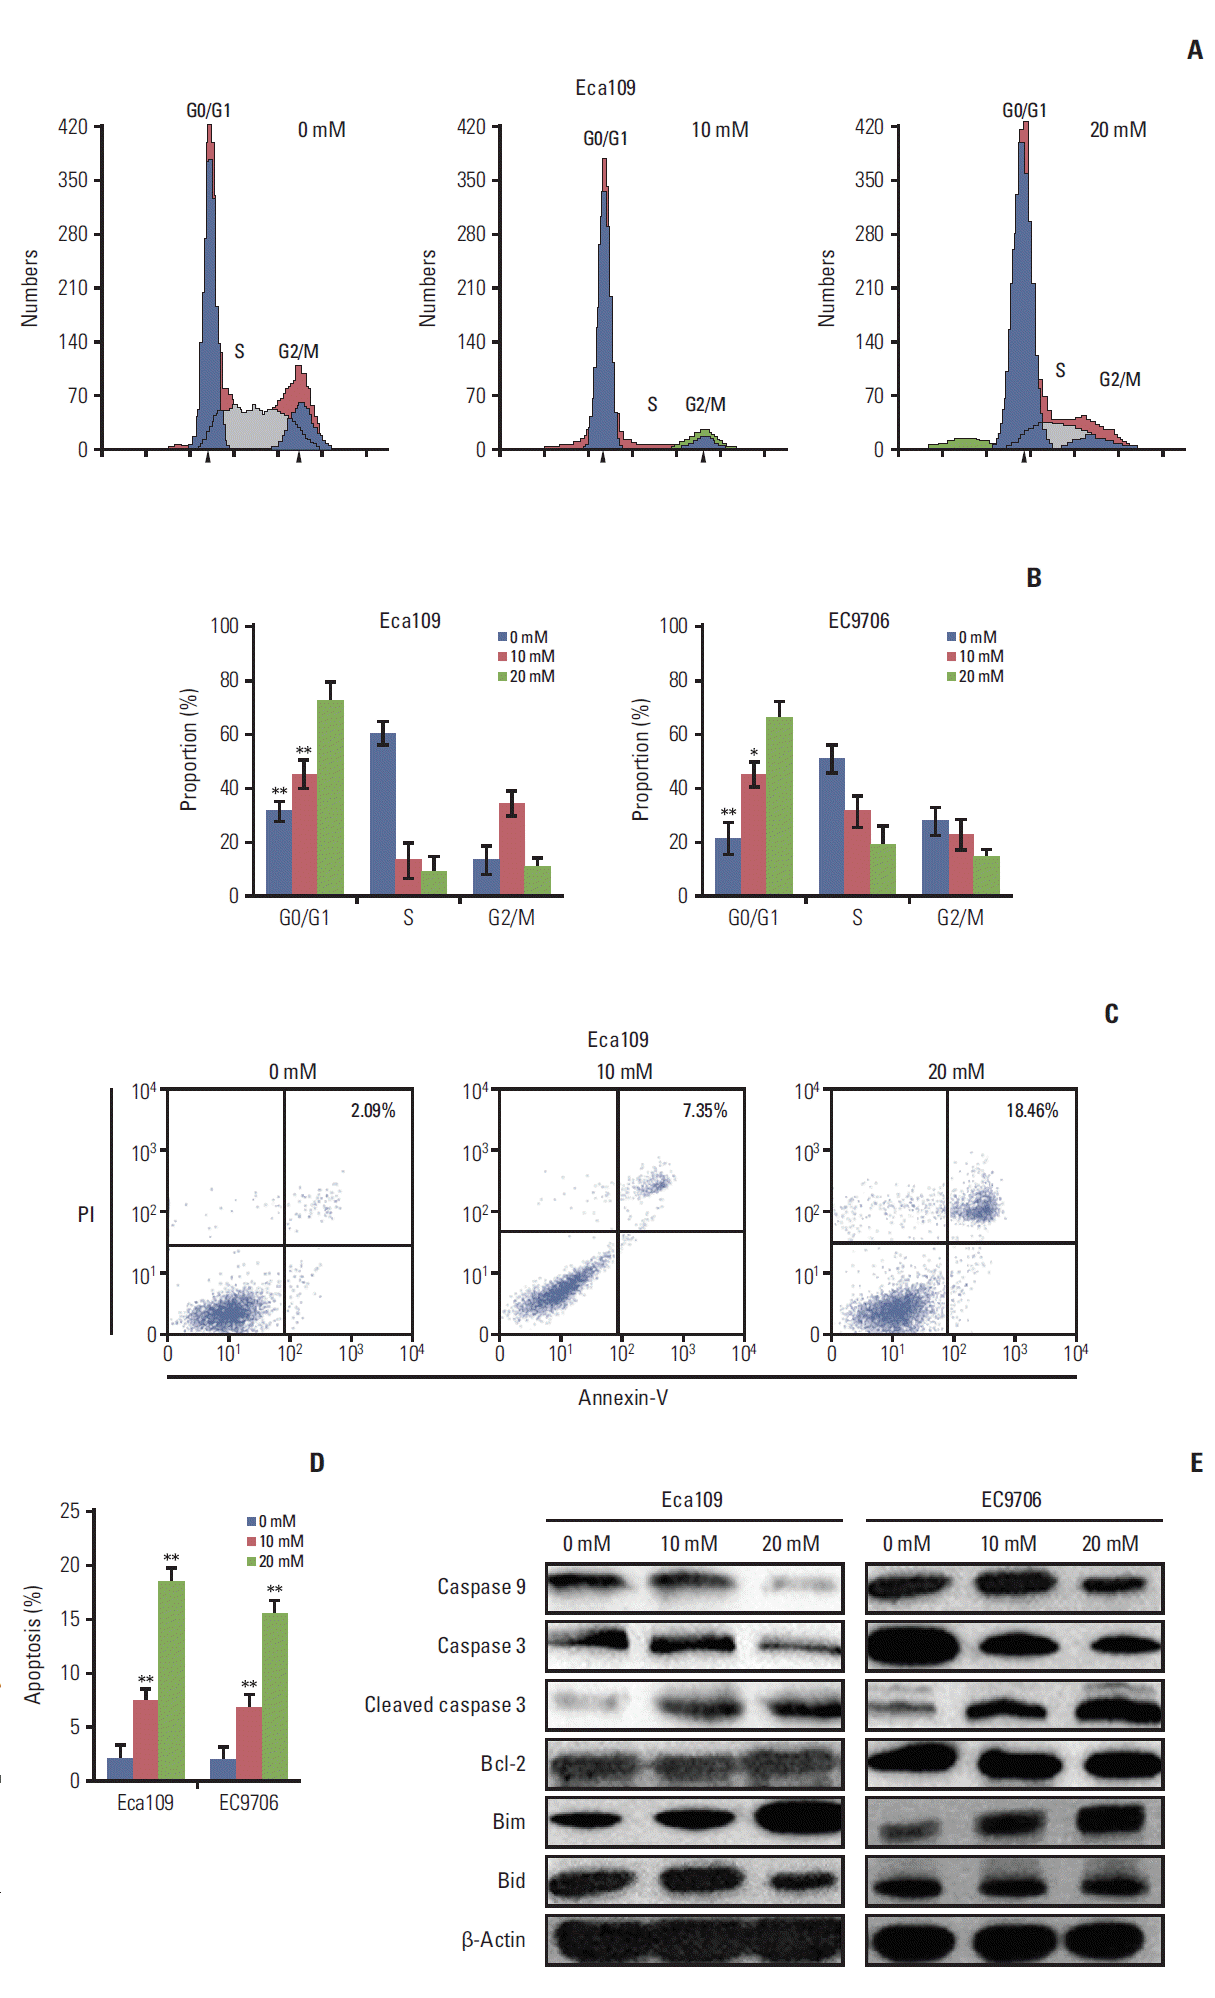 | Fig. 2.Metformin induced cell cycle arrest and apoptosis in esophageal cancer cell cells. Eca109 and EC9706 Cells were treated with metformin (10 and 20 mM) for 24 hours. To investigate the cell cycle, cells were stained with propidium iodide (PI) according to the manufacturer’s instructions. For apoptosis determination, cells were analyzed by flow cytometry after staining with Annexin-V/PI according to the manufacturer’s instructions. (A) Typical flow cytometric graph of cell cycle. (B) The percentage of cells in each cell cycle phase. The results showed that metformin blocked cell arrest in the G0/G1 phrase in Eca109 and EC9706. (C) Typical flow cytometric graph of apoptosis. (D) The percentage of apoptotic cells. The results showed that metformin increased the rate of apoptosis in Eca109 and EC9706. (E) The expression of apoptosis-related proteins. Eca109 and EC9706 were treated with metformin. At 24 hours after treatment, the cells were lysed and subjected to immunoblot analysis. The levels of caspase 3, caspase 9, cleaved caspase 3, Bcl-2, Bim, and Bid were detected. Data represent the mean±standard deviation from three independent experiments (*p < 0.05 and **p < 0.01 compared to control, n=3). |
3. Metformin suppressed PI3K/AKT/mTOR signaling pathway
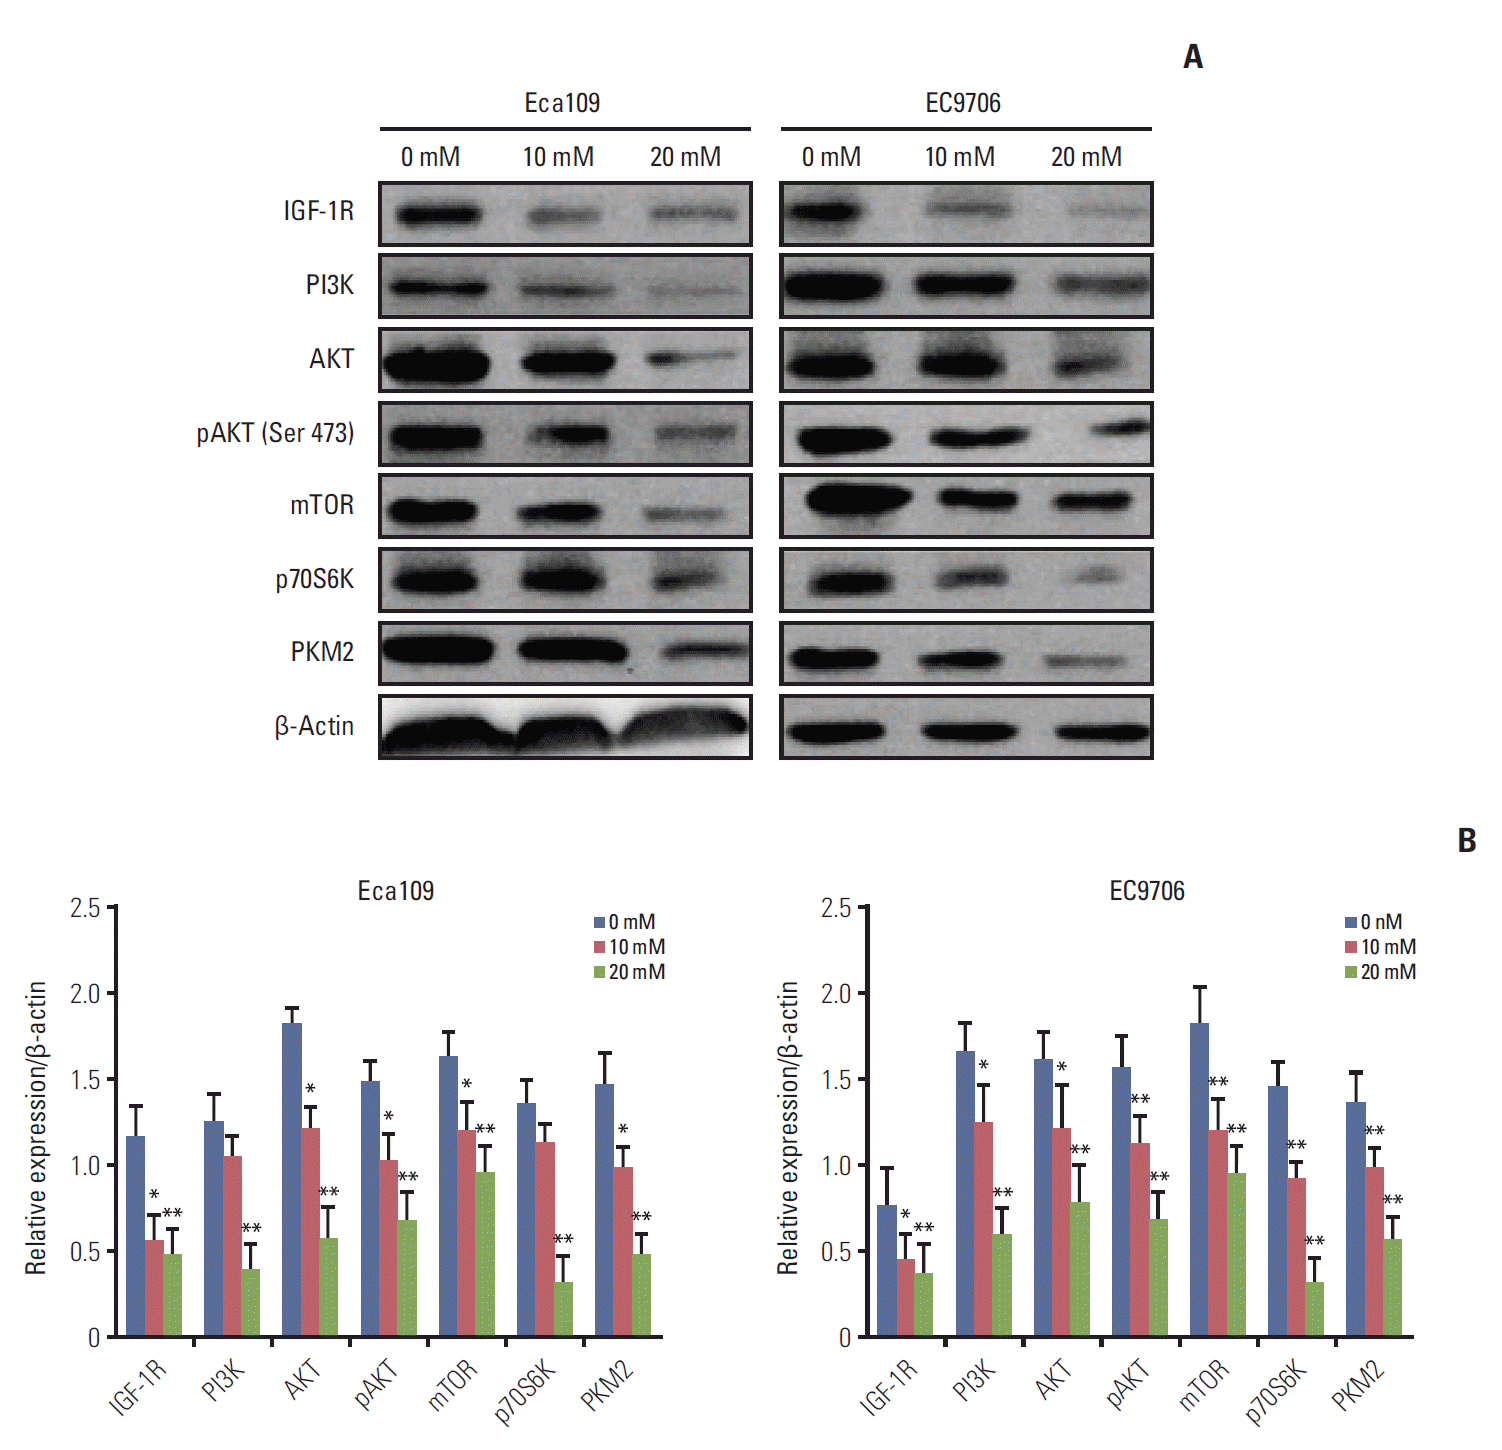 | Fig. 3.Metformin suppressed the PI3K/AKT/mTOR signaling pathway. Eca109 and EC9706 cells were treated with metformin (0, 10, and 20 mM) for 24 hours. Total proteins were extracted as previously described. (A) Western blot analyses of IGF-1R, PI3K, AKT, pAKT, mTOR, p70S6K, and PKM2. Metformin reduced the IGF-1R expression and suppressed the PI3K/AKT/mTOR/PKM2 pathway. (B) Graph depicts densitometric analyses of IGF-1R, PI3K, AKT, pAKT, mTOR, p70S6K, and PKM2 normalized by β-actin (*p < 0.05 and **p < 0.01 compared to control, n=3). PI3K, phosphoinositide 3-kinase; pAKT, phosphorylation of AKT; mTOR, mammalian target of rapamycin; PKM2, pyruvate kinase muscle isozyme 2; IGF-1R, insulin-like growth factor 1 receptor. |
4. IGF partly reversed the effect of metformin-induced apoptosis and attenuated the repression effect of metformin on the PI3K/AKT/mTOR/PKM2 pathway
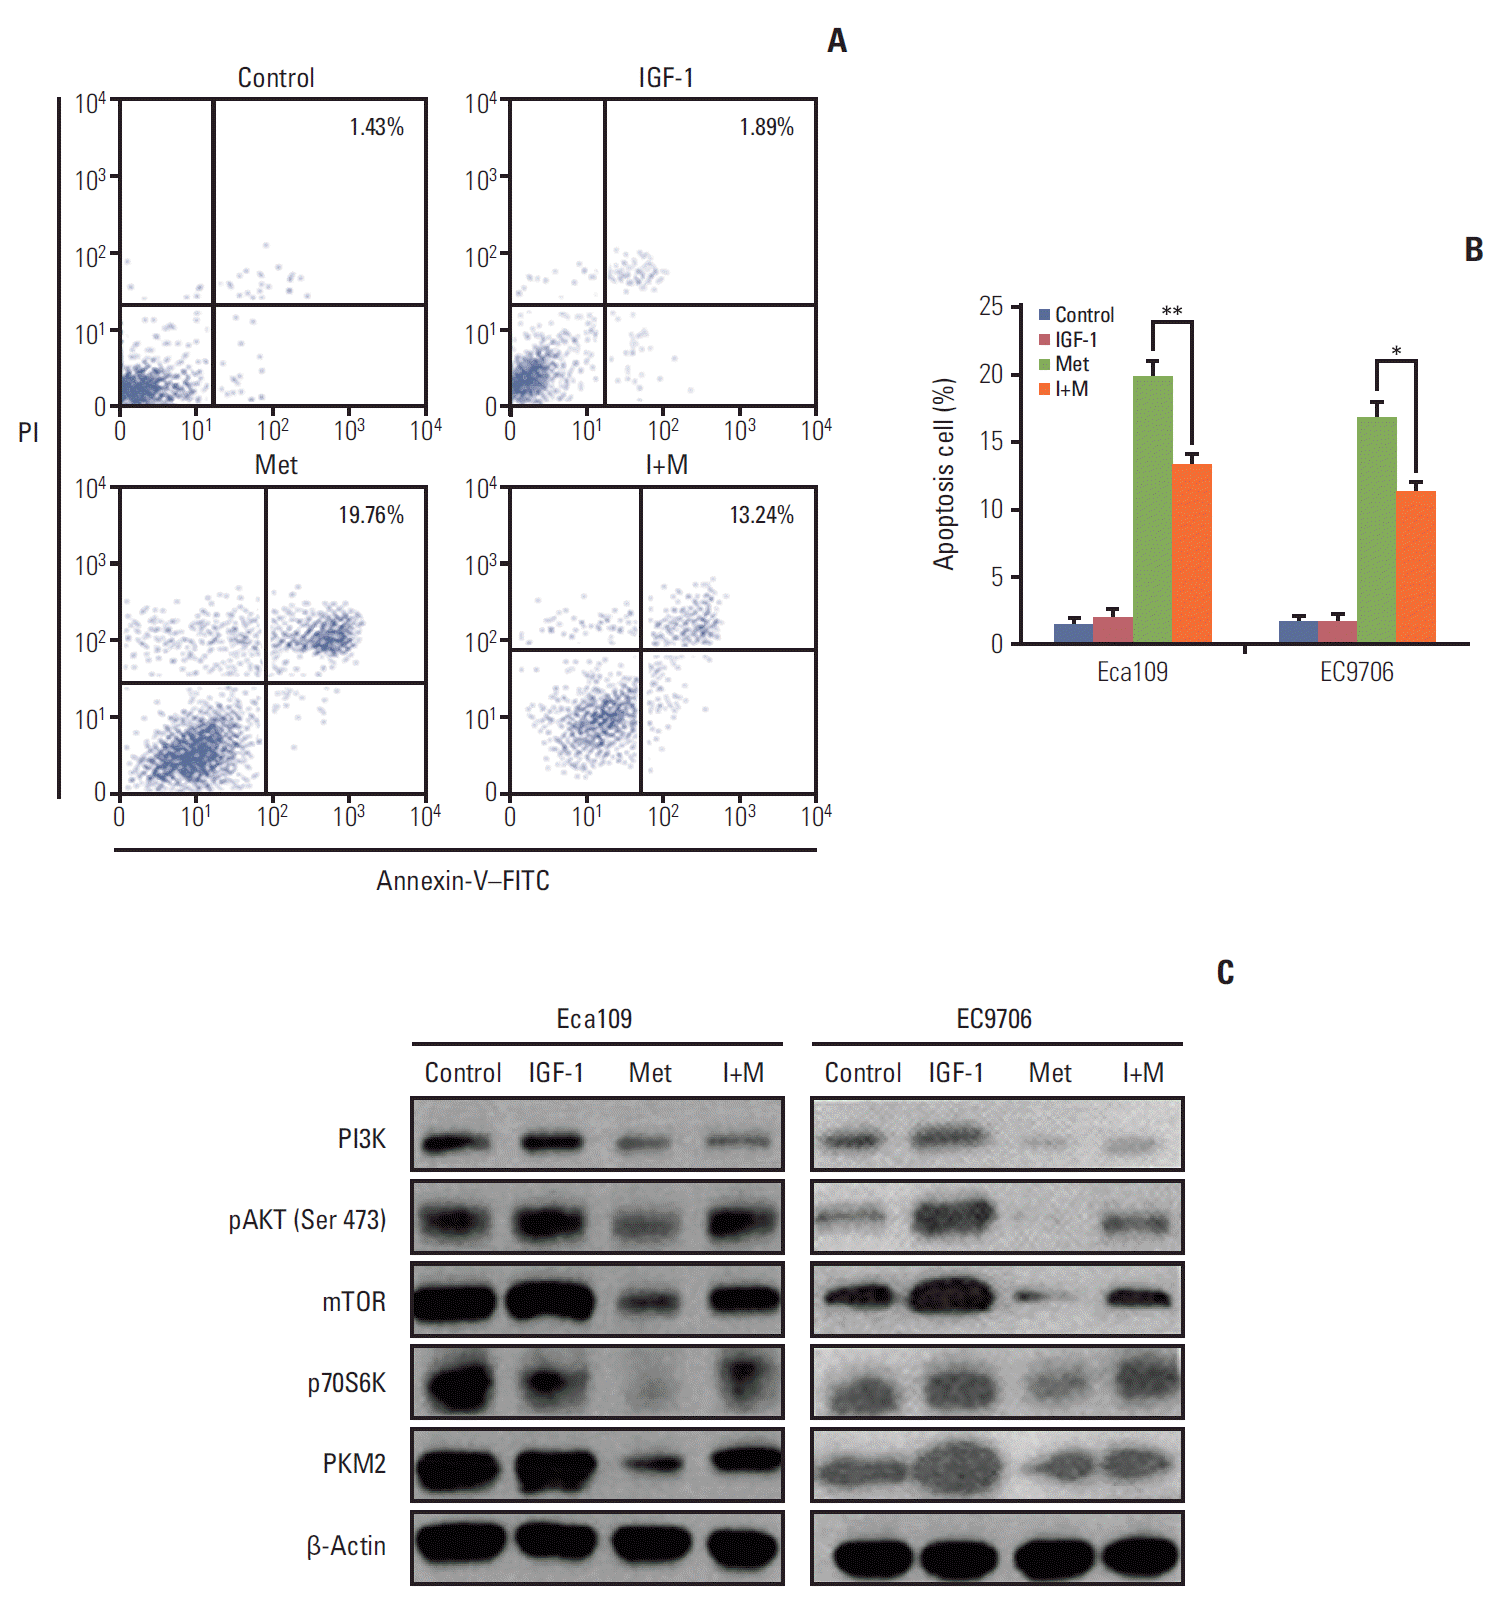 | Fig. 4.IGF partly reversed the effect of metformin-induced apoptosis and attenuated the repression action of metfomin toward PI3K, pAKT, mTOR, p70S6K, and PKM2 in esophageal cancer cells. Eca109 and EC9706 cells were pre-treated with IGF-1 (100 ng/mL) for 2 hours, then with metformin for 24 hours. Apoptosis was determined by flow cytometry. (A) Typical flow cytometric graph of apoptosis. (B) The average percentage of apoptosis in Eca109 and EC9706 cells after treatment with metformin. The results showed that metformin partly prevented the metformin-induced apoptosis. (C) The expression of PI3K, pAKT, mTOR, p70S6K, and PKM2 was detected by western blot. The outcome indicates that IGF-1 attenuates the repression action of metformin toward PI3K, pAKT, mTOR, p70S6K, and PKM2 in Eca109 and EC9706 cells (*p < 0.05 and **p < 0.01 compared to control, n=3). PI3K, phosphoinositide 3-kinase; pAKT, phosphorylation of AKT; PKM2, pyruvate kinase muscle isozyme 2; IGF-1, insulin-like growth factor 1; mTOR, mammalian target of rapamycin; PI, propidium iodide; Met, metformin; I+M, insulin-like growth factors+metformin; FITC, fluorescein isothiocyanate. |
5. Knockdown PKM2 altered apoptosis-related protein expression
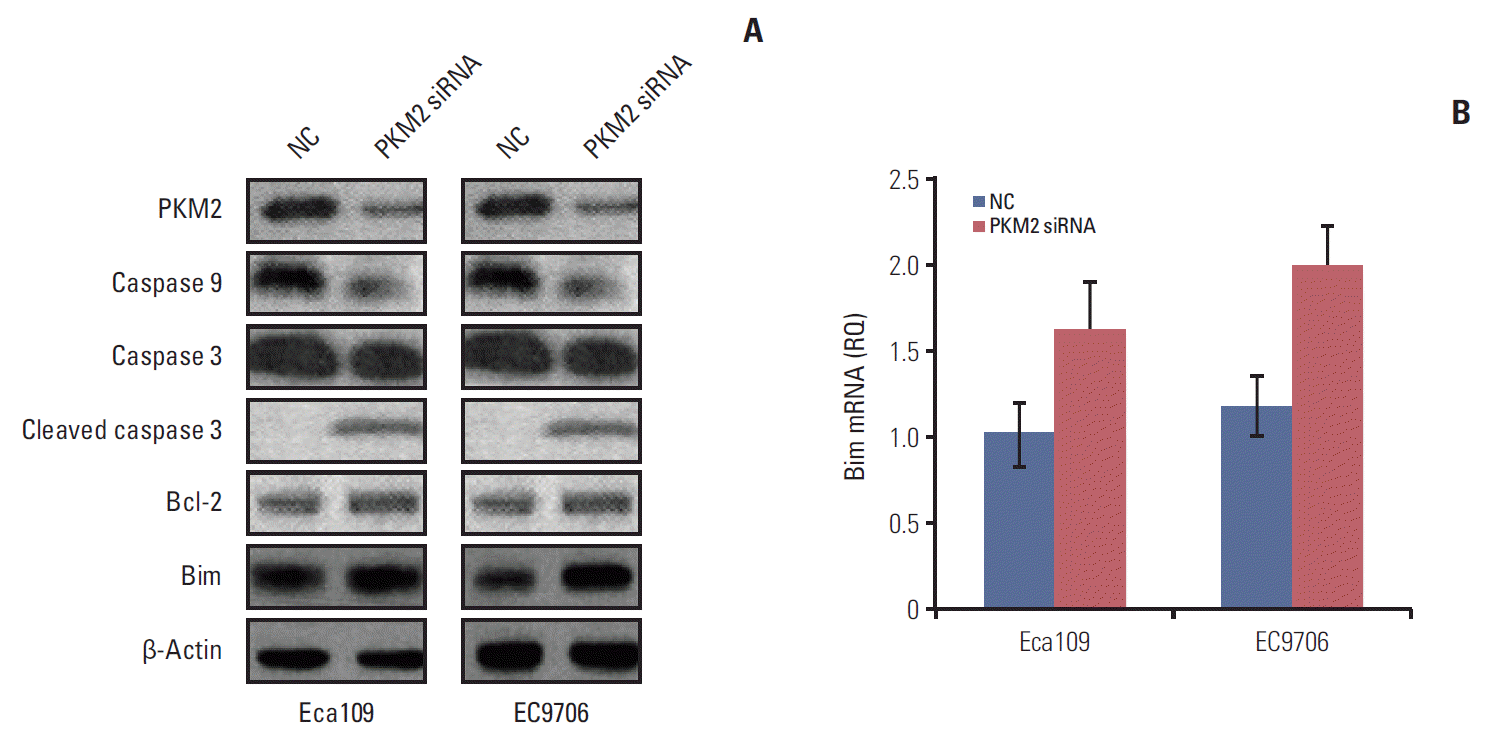 | Fig. 5.Knockdown of PKM2 altered the expression of apoptosis-related proteins. Eca109 or EC9706 cells (3×10⁵ cells/well) were plated in a 12-well plate. PKM2 was knocked down in Eca109 and EC9706 cells by siRNA (50 nM final concentration for both PKM2-specific and NC siRNA). At 48 hours after transfection, the whole cell extracts were collected for western blot. Total RNA was extracted from cultured cells (Eca109 and EC9706) using Trizol reagent according to the manufacturer’s instructions. β-Actin and Bim mRNA were quantified in duplicate by SYBR Green 2-step, real-time reverse transcription polymerase chain reaction. (A) Caspase 9, caspase 3, cleaved caspase 3, Bcl-2, and Bim were detected by western blot. The results showed that knockout PKM2 activated caspase 3 and downregulated caspase 9. Bim protein expression was evidently increased. (B) Bim mRNA level was increased in depletion PKM2 esophageal cancer cells. PKM2, pyruvate kinase muscle isozyme 2; NC, normal control. |
6. Antitumor effect of metformin in vivo
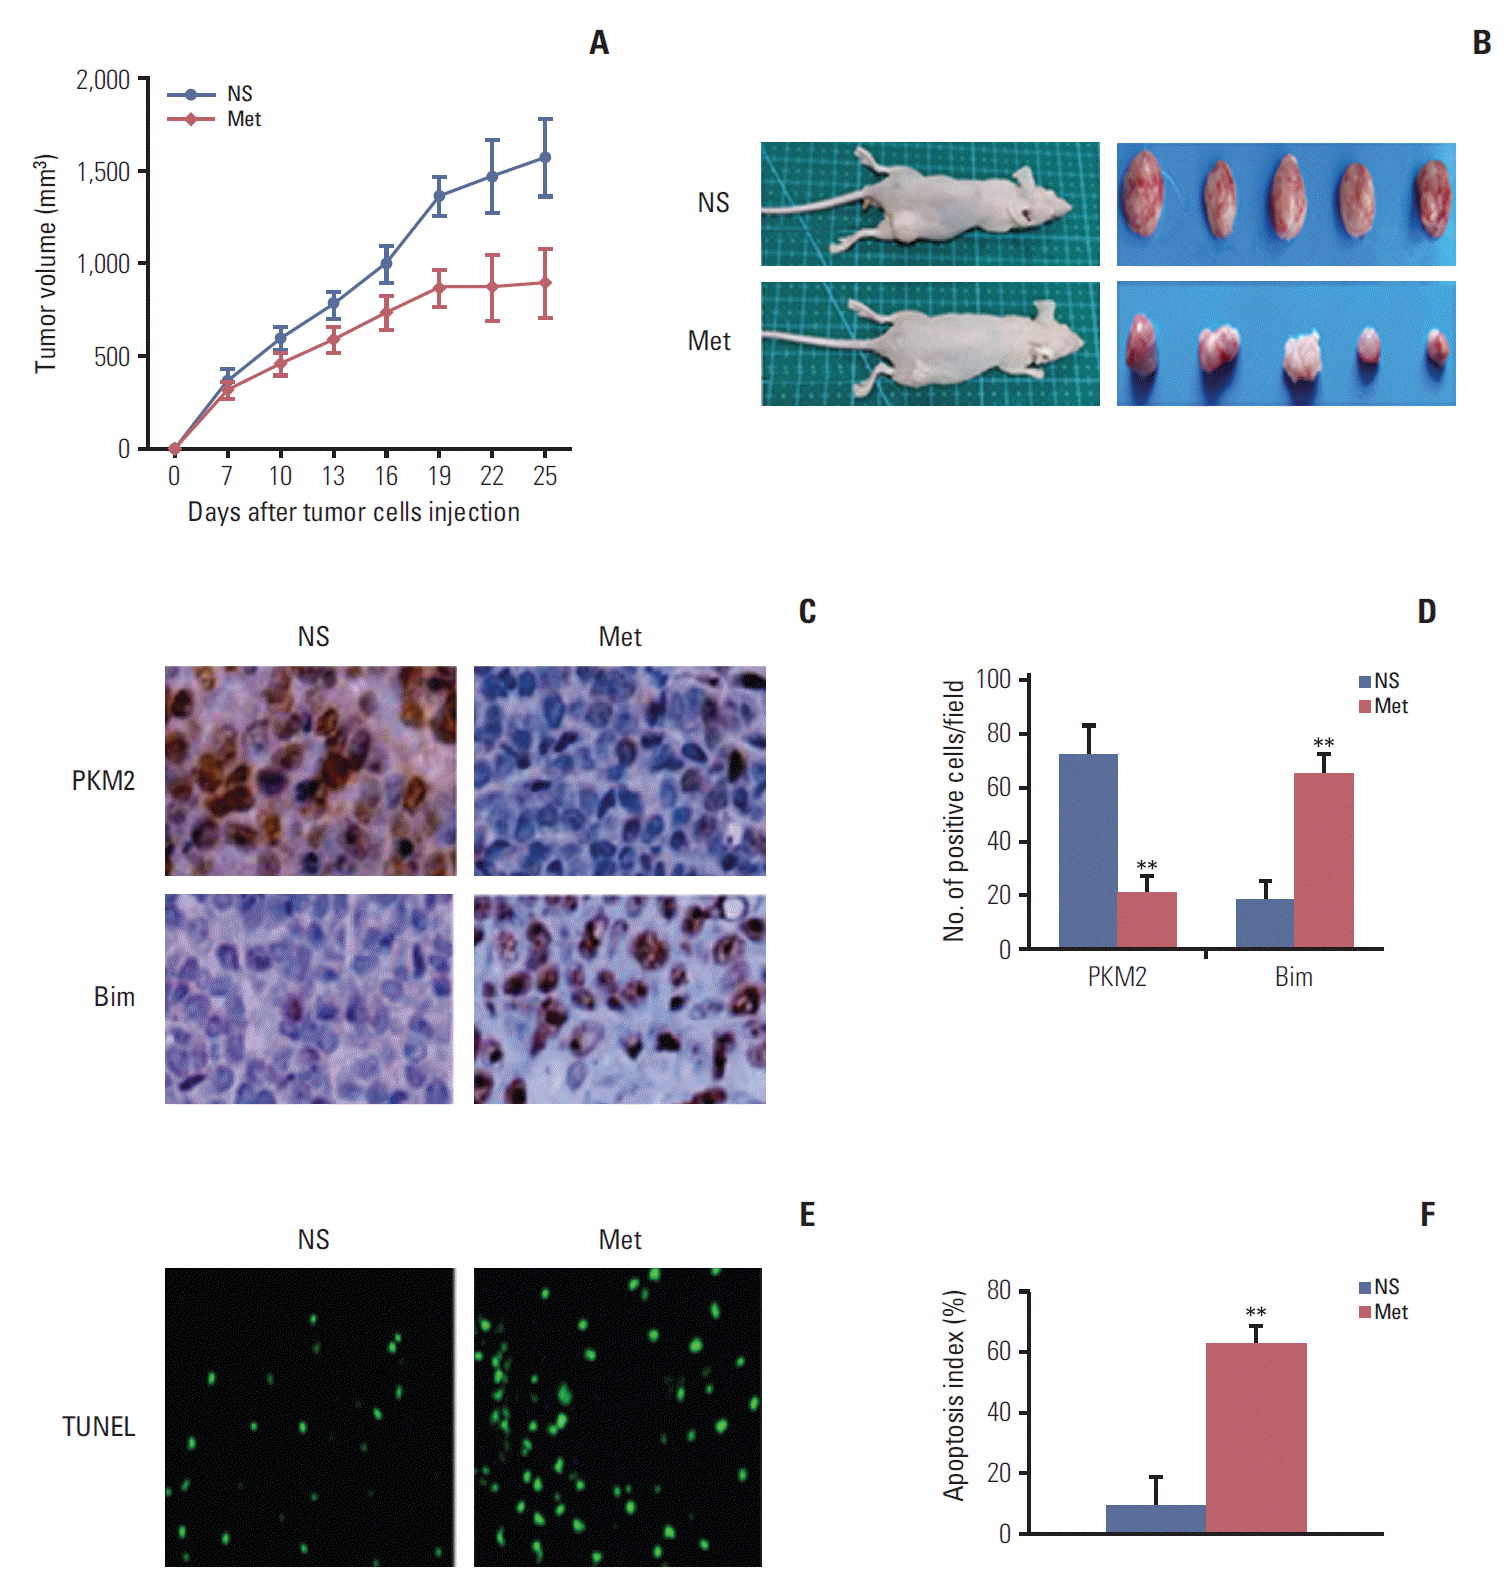 | Fig. 6.Metformin inhibited tumor growth in vivo. Mice were treated with NS or metformin (300 mg/kg/day) for 21 days at the same time (n=5 per group). (A) Suppressed growth of tumor in mice. The results showed that metformin inhibited tumor growth (n=5, p < 0.01). Data are shown as the mean±standard deviation. (B) Representation of photos of tumors from mice bearing Eca109 receiving different treatments. Mice were sacrificed when they were moribund. (C) Typical graph of immunohistochemical staining of PKM2 and Bim in tumor tissues (×400). (D) Quantification of the number of PKM2 and Bim positive cells per field. Metformin treatment significantly decreased the number of PKM2-positive cells and increased the number of Bim-positive cells. (E) Typical sections from tumor tissue. (F) Apoptotic index within tissues. Metformin showed a significant increase of apoptotic cells in tumor tissues compared to the control (**p < 0.001). Data are expressed as the mean apoptotic index±standard deviation of cancer cells. NS, normal saline; PKM2, pyruvate kinase muscle isozyme 2; Met, metformin; TUNEL, terminal deoxynucleotidyl transferase dUTP nick end labeling. |


 PDF
PDF Citation
 Print
Print


 XML Download