Abstract
Purpose
Materials and Methods
Results
ACKNOWLEDGMENTS
References
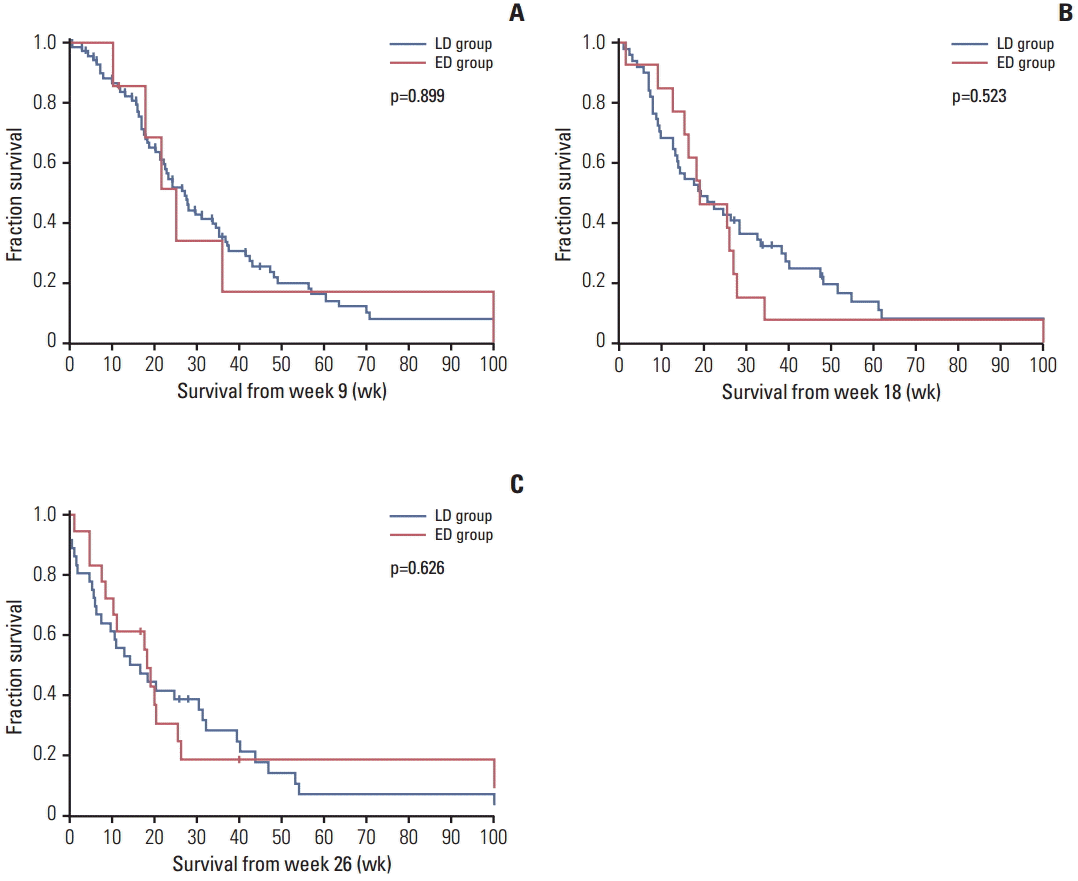
Fig. 1.

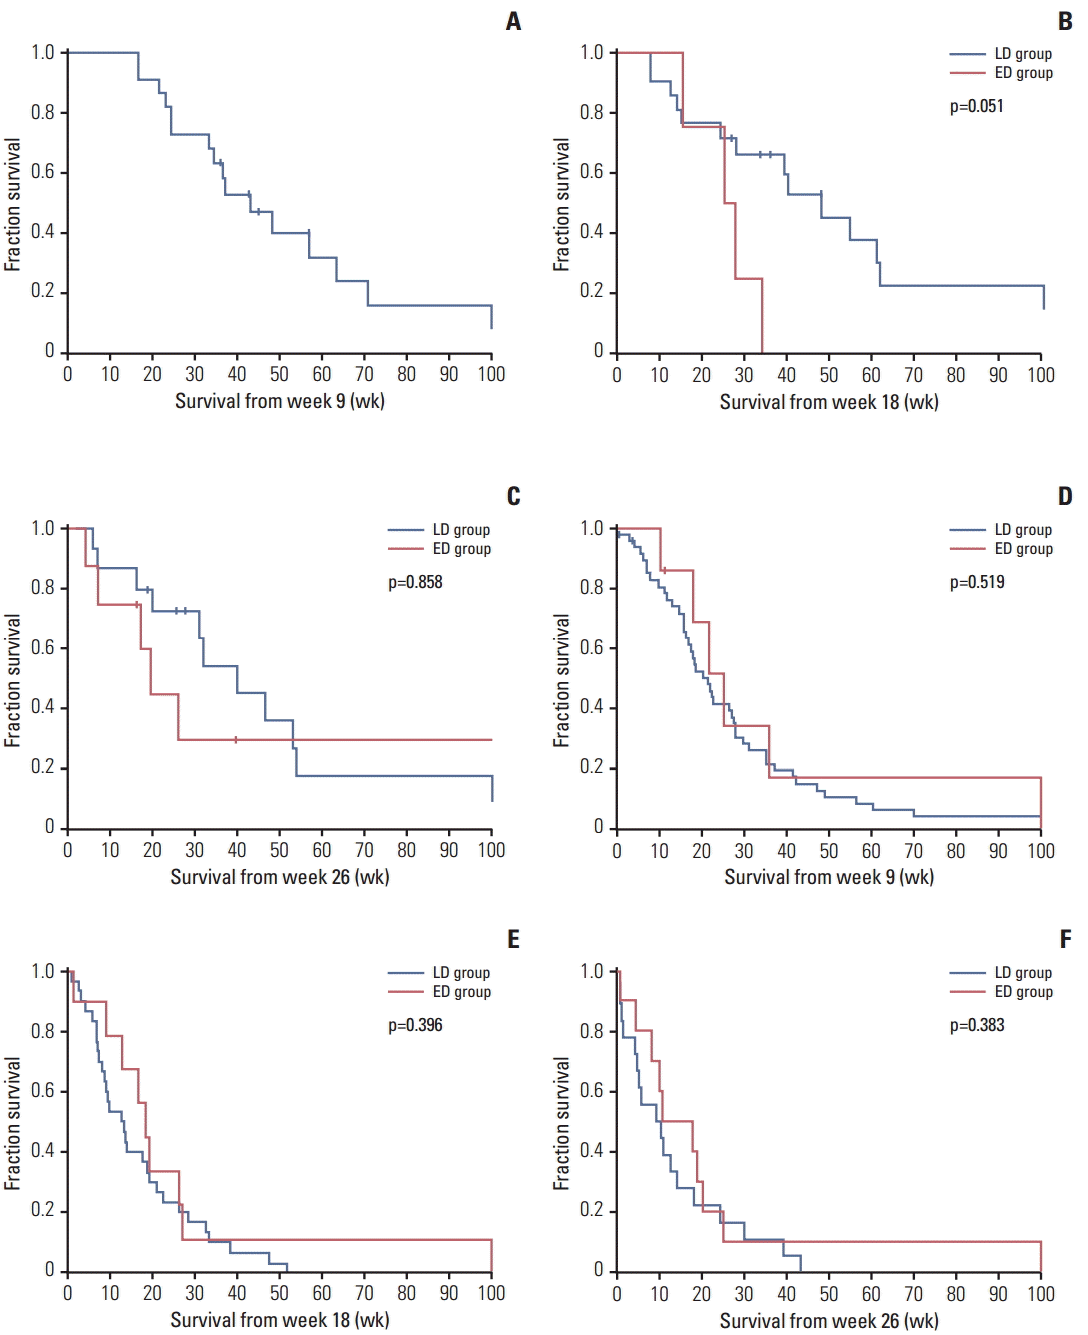
Fig. 2.

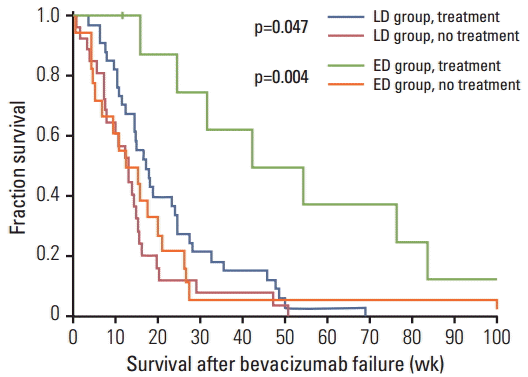
Fig. 3.

Table 1.
| Variable |
Timing of discontinuationa) |
p-value | |
|---|---|---|---|
| LD (n=62) | ED (n=27) | ||
| Age (yr) | 45 (17-78) | 51 (19-79) | 0.062 |
| Sex | |||
| Male | 40 (64.5) | 18 (66.7) | > 0.99 |
| Female | 22 (35.5) | 9 (33.3) | |
| ECOG performance scale | |||
| 0 | 2 (3.2) | 0 | 0.954 |
| 1 | 40 (64.5) | 18 (66.7) | |
| 2 | 13 (21.0) | 8 (29.6) | |
| 3 | 7 (11.3) | 1 (3.7) | |
| Histology | |||
| Glioblastoma multiforme | 39 (62.9) | 17 (63.0) | > 0.99 |
| Anaplastic glioma | 23 (37.1) | 10 (37.0) | |
| Surgical resection | 39 (63.9) | 16 (59.3) | 0.812 |
| Radiation therapy | 59 (95.2) | 27 (100) | 0.550 |
| No. of recurrences, median (range) | 2 (1-4) | 2 (1-4) | 0.942 |
| Time from diagnosis (wk) | 55.3 (12.1-255.7) | 72.6 (14.3-231.9) | 0.313 |
Table 2.
| Variable |
Timing of discontinuationa) |
p-value | |
|---|---|---|---|
| LD (n=62) | ED (n=27) | ||
| Bevacizumab treatment regimen, n (%) | |||
| Bevacizumab+irinotecan | 57 (91.9) | 27 (100) | 0.317 |
| Bevacizumab alone | 5 (8.1) | 0 | |
| Duration of treatment, median (range, wk) | 11.4 (1.0-53.0) | 14.9 (1.0-64.9) | 0.993 |
| Cycles of treatment, median (range) | 6 (1-23) | 6 (1-24) | 0.727 |
| Response, n (%)b) | |||
| CR/PR | 14 (22.6) | 11 (45.8) | 0.055 |
| SD | 37 (59.7) | 12 (50.0) | |
| PD | 11 (17.7) | 1 (4.2) | |
| Duration of treatment by responses, median (wk) | |||
| CR/PR | 29.4 | 26.0 | 0.551 |
| SD | 11.7 | 8.9 | 0.226 |
| PFS, median (95% CI, wk)c) | 16.7 (14.2-19.3) | - | |
| 6-Month PFS (95% CI, %)c) | 22.7 (14.4-31.0) | - | |
| OS, median (95% CI, wk)c) | 32.0 (28.1-35.9) | - | |
| 6-Month OS (95% CI, %)c) | 67.7 (58.5-76.9) | - | |
| 12-Month OS (95% CI, %)c) | 24.6 (16.1-33.1) | - | |
LD, late discontinuation; ED, early discontinuation; CR, complete response; PR, partial response; SD, stable disease; PD, progressive disease; PFS, progression-free survival; CI, confidence interval; OS, overall survival.
Table 3.
| Overall survival from landmark |
Week 9 |
Week 18 |
Week 26 |
|||
|---|---|---|---|---|---|---|
| LD | ED | LD | ED | LD | ED | |
| Overall population, n | 69 | 7 | 51 | 14 | 36 | 18 |
| Median weeks (95% CI) | 27.3 (22.1-32.5) | 25.4 (17.3-33.6) | 19.1 (8.9-29.4) | 19.0 (8.3-29.7) | 14.3 (3.8-24.8) | 18.1 (15.4-20.9) |
| p (log-rank) | 0.899 | 0.523 | 0.626 | |||
| Adjusted hazard ratio (95% CI)a) | - | 1.02 (0.40-2.60) | - | 1.13 (0.56-2.29) | - | 0.72 (0.37-1.39) |
| p (Wald) | 0.963 | 0.727 | 0.327 | |||
| Patients with CR/PRb), n | 22 | 0 | 21 | 4 | 17 | 8 |
| Median weeks (95% CI) | 43.3 (29.2-574) | - | 48.0 (30.8-65.2) | 25.6 (13.5-37.6) | 32.1 (18.1-46.2) | 19.9 (14.2-25.5) |
| p (log-rank) | - | 0.051 | 0.858 | |||
| Patients with SDb), n | 47 | 7 | 30 | 10 | 19 | 10 |
| Median weeks (95% CI) | 21.7 (16.7-26.8) | 25.4 (17.3-33.6) | 12.7 (7.2-18.3) | 18.3 (12.9-23.7) | 9.7 (2.6-16.8) | 11.0 (0.0-13.0) |
| p (log-rank) | 0.519 | 0.396 | 0.383 | |||
LD, late discontinuation; ED, early discontinuation; CI, confidence interval; CR, complete response; PR, partial response, SD, stable disease; ECOG, Eastern Cooperative Oncology Group.
Table 4.
| Overall survival from landmark |
Week 9 |
Week 18 |
Week 26 |
|||
|---|---|---|---|---|---|---|
| LD | ED | LD | ED | LD | ED | |
| Overall population, n | 43 | 5 | 32 | 9 | 21 | 12 |
| Median (95% CI, wk) | 23.0 (17.7-28.3) | 25.0 (17.8-33.1) | 14.3 (8.7-19.8) | 19.0 (16.9-21.1) | 12.9 (2.6-23.1) | 17.6 (5.6-29.5) |
| p (log-rank) | 0.778 | 0.948 | 0.297 | |||
| Adjusted hazard ratio (95% CI)a) | - | 1.13 (0.37-3.43) | - | 1.02 (0.42-2.44) | - | 0.75 (0.31-1.84) |
| p (Wald) | 0.838 | 0.969 | 0.535 | |||
| Patients with CR/PRb), n | 9 | 0 | 10 | 2 | 7 | 5 |
| Median (95% CI, wk) | 63.7 (33.9-93.6) | - | 54.7 (0.0-130.3) | 25.6 | 46.7 (4.0-89.4) | 26.3 |
| p (log-rank) | - | 0.084 | 0.416 | |||
| Patients with SDb), n | 34 | 5 | 22 | 7 | 14 | 7 |
| Median (95% CI, wk) | 20.4 (15.8-25.1) | 21.7 (16.6-26.9) | 9.9 (5.1-14.6) | 18.3 (13.5-23.1) | 6.0 (0.0-13.3) | 10.3 (5.5-15.1) |
| p (log-rank) | 0.383 | 0.194 | 0.641 | |||
LD, late discontinuation; ED, early discontinuation; CI, confidence interval; CR, complete response; PR, partial response, SD, stable disease; ECOG, Eastern Cooperative Oncology Group.
Table 5.
| Overall survival from landmark |
Week 9 |
Week 18 |
Week 26 |
|||
|---|---|---|---|---|---|---|
| LD | ED | LD | ED | LD | ED | |
| Overall population, n | 26 | 2 | 19 | 5 | 15 | 6 |
| Median weeks (95% CI) | 33.6 (22.4-44.7) | 10.6 | 28.3 (15.9-40.7) | 26.1 (5.8-46.5) | 10.7 (0.0-41.3) | 7.5 (3.4-32.9) |
| p (log-rank) | 0.246 | 0.129 | 0.219 | |||
| Adjusted hazard ratio (95% CI)a) | - | 1.50 (0.15-15.10) | - | 2.42 (0.58-10.09) | - | 1.33 (0.38-4.65) |
| p (Wald) | 0.730 | 0.224 | 0.659 | |||
| Patients with CR/PRb), n | 13 | 0 | 11 | 2 | 10 | 3 |
| Median (95% CI, wk) | 37.3 (31.4-43.2) | - | 39.3 (19.6-59.0) | 15.6 | 31.3 (5.5-57.1) | 7.6 (3.0-12.1) |
| p (log-rank) | - | 0.228 | 0.057 | |||
| Patients with SDb), n | 13 | 2 | 8 | 3 | 5 | 3 |
| Median (95% CI, wk) | 27.7 (14.6-40.8) | 10.6 | 18.7 (4.3-33.2) | 26.1 | 10.7 (0.0-32.2) | 20.4 (16.8-24.1) |
| p (log-rank) | 0.684 | 0.536 | 0.520 | |||
LD, late discontinuation; ED, early discontinuation; CI, confidence interval; CR, complete response; PR, partial response, SD, stable disease; ECOG, Eastern Cooperative Oncology Group.
Table 6.
| Variable |
Timing of discontinuationa) |
p-value | |
|---|---|---|---|
| LD | ED | ||
| Overall population | |||
| Discontinuation to progression (wk) | 62 | 27 | |
| Median (95% CI) | - | 11.4 (8.0-14.9) | - |
| Range | - | 2.3-132.1 | |
| Non-enhancing progression, n (%)b) | 13 (21.3) | 3 (13.6) | 0.746 |
| Progression to death (wk)b) | |||
| Median (95% CI) | 14.4 (12.5-16.4) | 15.7 (12.3-19.1) | 0.251 |
| Discontinuation to death (wk) | |||
| Median (95% CI) | - | 28.6 (25.0-32.1) | - |
| GBM | |||
| Discontinuation to progression (wk) | 38 | 17 | |
| Median (95% CI) | - | 13.1 (9.3-17.0) | - |
| Range | - | 2.4-132.1 | |
| Non-enhancing progression, n (%)c) | 6 (15.8) | 1 (7.1) | 0.655 |
| Progression to death (wk)c) | |||
| Median (95% CI) | 14.0 (10.9-17.1) | 15.6 (14.3-16.9) | 0.219 |
| Discontinuation to death (wk) | |||
| Median (95% CI) | - | 28.7 (23.0-34.4) | - |
| AG | |||
| Discontinuation to progression (wk) | 23 | 10 | |
| Median (95% CI) | - | 6.0 (1.6-10.4) | - |
| Range | - | 2.3-19.4 | |
| Non-enhancing progression, n (%)d) | 7 (30.4) | 2 (25.0) | > 0.99 |
| Progression to death (wk)d) | |||
| Median (95% CI) | 14.6 (11.7-17.5) | 19.9 (3.3-36.4) | 0.919 |
| Discontinuation to death (wk) | |||
| Median (95% CI) | - | 27.9 (20.7-35.0) | - |
LD, late discontinuation; ED, early discontinuation; CI, confidence interval; GBM, glioblastoma multiforme; AG, anaplastic glioma.
a) The patients shown in this table were categorized into LD and ED groups as determined at the time of the last follow-up visit,
b) Calculated for 83 patients who progressed on bevacizumab (61 in LD and 22 in ED groups, respectively),
Table 7.
| Treatment | No. (%) | LD (n=33) | ED (n=5) | p-value |
|---|---|---|---|---|
| Surgical therapy | 1 (2.6) | 1 (3.0) | 0 | 0.358a) |
| Radiation therapy | 9 (23.7) | 9 (27.3) | 0 | - |
| Chemotherapy | 28 (73.7) | 23 (69.7) | 5 (100) | |
| Metronomic temozolomide | 10 (26.3) | 9 (27.3) | 1 (20.0) | 0.146b) |
| ACNU+CDDP | 8 (21.1) | 7 (21.2) | 1 (20.0) | |
| Bevacizumab re-introduction | 3 (7.9) | 1 (3.0) | 2 (40.0) | |
| Erlotinib | 4 (10.5) | 4 (12.1) | 0 | |
| PCV (procarbazine+CCNU+vincristine) | 3 (7.9) | 2 (6.1) | 1 (20.0) |


 PDF
PDF Citation
 Print
Print


 XML Download