Journal List > Cancer Res Treat > v.48(3) > 1153372

Kang, Kim, Jang, Kim, Cho, Yoo, Seo, Paik, and Cha: The Clinical Status of Radiation Therapy in Korea in 2009 and 2013

Abstract

Purpose

The purpose of this study is to estimate the clinical status of radiation therapy (RT) in Korea.

Materials and Methods

We analyzed open claims data from the Health Insurance Review and Assessment Service (HIRA). The subjects were patients with malignant neoplasms who had procedure codes concerning RT in 2009 and 2013.

Results

The total numbers of patients who underwent RT in 2009 and 2013 were 42,483 and 56,850, respectively. The numbers of men and women were 20,012 and 22,471 in 2009 and 26,936 and 29,914 in 2013, respectively. The five most frequent RT sites were metastatic, breast, gastrointestinal, thoracic, and gynecologic cancers in 2009, and metastatic, breast, gastrointestinal, thoracic and head and neck cancers in 2013. The three leading types of cancer among men were metastatic, gastrointestinal, and thoracic, and breast, metastatic, and gynecologic among women. According to age, the most common treatment site was the central nervous system for those aged 20 years or less, the breast for those in their 30s to 50s, and metastatic sites for those in their 60s or older.

Conclusion

Data from this study provide an overview of the clinical status of RT in Korea.

Introduction

As in many other parts of the world, cancer is the leading cause of death and is a major public health problem in Korea. According to the annual report of the Korea Central Cancer Registry, 224,177 patients were newly diagnosed with cancer in 2012, and overall incidence rates have increased by 3%-4% per year [1]. The number of individuals diagnosed with cancer has increased each year, due in large part to aging and particularly for some cancers (e.g., breast and colorectal cancer) because of the increasing prevalence of obesity attributed to westernized eating habits, and for some other cancers (e.g., thyroid and prostate cancer) because of the development of diagnostic tools and as a result of a medical system that encourages cancer screening [2].
In addition to surgery and chemotherapy, radiation therapy (RT) is one of the three primary modalities for modern cancer treatment. As the market and clinical demand for RT grow in importance, providing accurate, nationally based databases concerning the clinical status of RT has become important for understanding the status and development of cancer treatment in Korea. Official records concerning the clinical status of RT were reported from 1999 to 2006 in Korea [3-6]. The results were compiled from questionnaires mailed to radiation oncology facilities. A website with relevant RT statistics from the Korean Society for Radiation Oncology (KOSRO) was recently developed and is being operated as an on-line statistical program [7]; these developments may be helpful for taking inventory of the RT equipment and for evaluating the manpower status for radiation oncology in Korea. However, these approaches require a long period of time as well as the cooperation of all RT facilities for data collection.
In this study, we analyzed the clinical status of RT in 2009 and 2013 in Korea using open claims data from the Health Insurance Review and Assessment Service (HIRA).

Materials and Methods

The claims data from the HIRA are open access to approved researchers who submit a profile of their work and R&D plan. The claims data from the HIRA contain information on 46 million patients per year who account for 90% of the total population in Korea; the claims data include information regarding patients’ diagnoses, treatment, procedures, surgical history, and prescription drugs, which provide a valuable resource for healthcare research [8].
The customized source population criteria for this study are shown in Table 1. The source population consisted of all patients who had any of the International Classification of Diseases 10 (ICD-10) cancer diagnoses (C00-C97) and at least one of the procedure codes related to receiving RT (Table 2) from January to December in 2009 and 2013. Patients who received two or more sessions of RT with interruption through January to December were counted as one patient. Patients with a diagnostic code concerning metastases (C77-79) were categorized as having received RT to a metastatic site. Patients with two or more diagnostic codes related to malignant neoplasms were categorized as having received RT to the metastatic site, followed by the main, secondary, and third diagnostic codes.
The site of RT category classification was based on the annual reports from the KOSRO, except for the breast and thyroid, which were classified independently rather than as part of the thoracic category.

Results

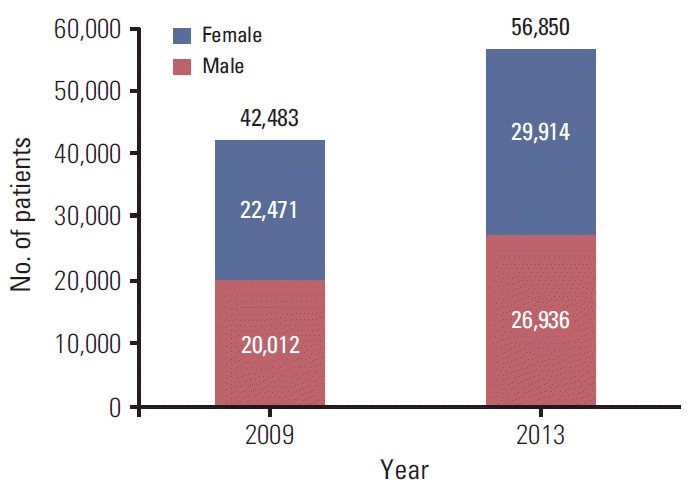
The total numbers of patients who underwent RT in 2009 and 2013 were 42,483 and 56,850, respectively. The total numbers of male and female patients who received RT were 20,012 and 22,471 in 2009, 26,936 and 29,914 in 2013, respectively (Fig. 1). The numbers of patient who received RT in 2009 and 2013 by cancer sites and sex are shown in Table 3. The five most frequent sites for patients who underwent RT in 2009 were as follows: metastatic (brain, bone, lymph node, and others), breast, gastrointestinal, thoracic, and gynecologic. However, the fifth most frequent site in 2013 was head and neck cancer instead of gynecologic cancer. The three leading sites among male patients were metastatic, gastrointestinal, and thoracic cancer, and breast, metastatic, and gynecologic cancer among women, in that order. The numbers of patients who received RT according to site and age group in 2013 are shown in Table 4. The most common treatment site was the central nervous system for those in their 20s or younger, while the breast was the most frequent site through the 30s to 50s, and metastasis was most common for those in their 60s or older. Similar trends were observed in 2009.

Discussion

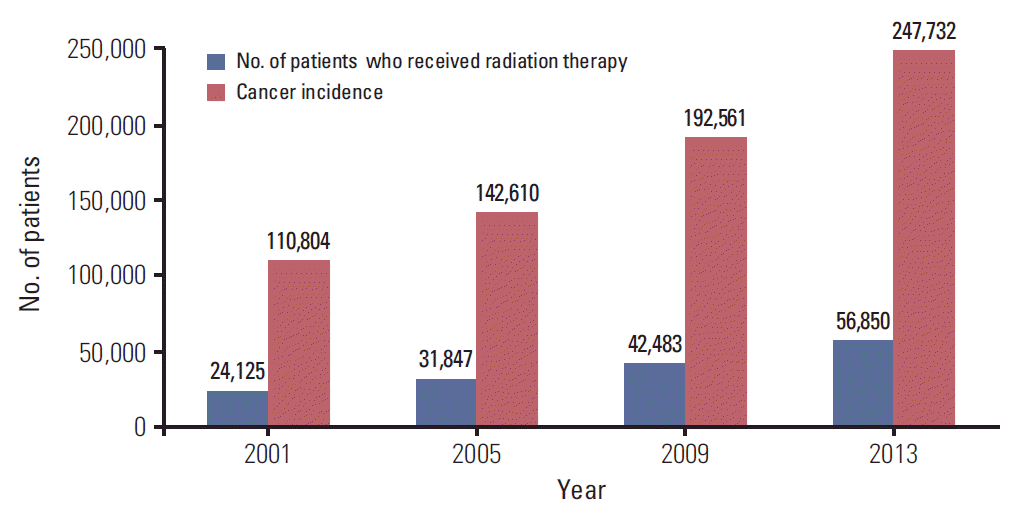
This study was conducted to analyze the clinical status of RT in 2009 and 2013 in Korea using claims data from the HIRA. Using the annual reports of KOSRO, we determined that the total number of patients who received RT increased by 33% every 4 years (Fig. 2). Although the absolute number of patients who received RT has been increasing steadily, because the cancer incidence has also increased steadily over the same period [9-12], the percentages of cancer patients who underwent irradiation were expected to be consistently below 30% over the period from 1999 to 2013.
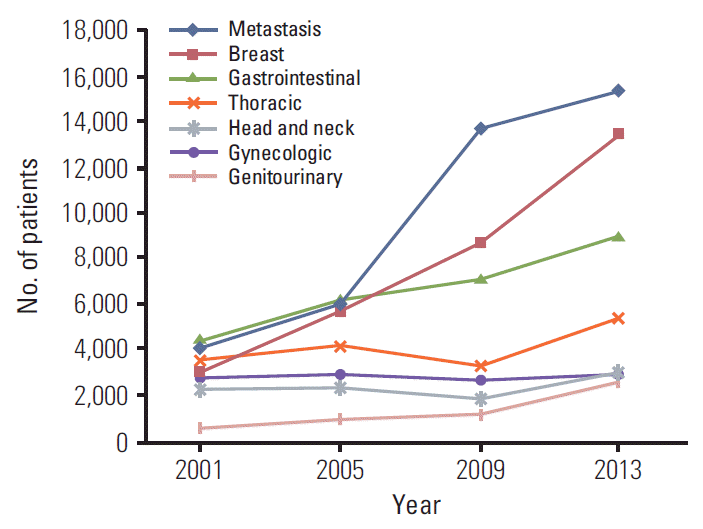
Breast, gastrointestinal, and genitourinary cancers have shown the steepest increase in number and proportion (Fig. 3). This tendency could be explained not only by the increasing cancer incidence, but also by the increasing evidence supporting the use of RT through well-designed studies and with the advancement of RT techniques.
This approach, using claims data from the HIRA, could reduce the amount of time required to obtain data from participants from each RT facility and eliminate the possible recall bias associated with questionnaire-based studies. In addition, claims data from the HIRA can be analyzed easily by age group, as shown in Table 4.
However, this study had several limitations. Because the claims data from the HIRA only include the insured cases, uninsured treatments, such as intensity modulated RT, cannot be analyzed. In addition, we included patients with the ‘C’ code and excluded benign disease. Therefore, patients who had a ‘D’ diagnostic code, which is expected to be a somewhat large portion of patients with ductal carcinoma in situ of the breast treated by RT, were excluded from this analysis. As a result, the actual number of patients who received RT is expected to be more than what is reported. To the contrary, because the patients who received RT on multiple sites including primary or metastatic sites throughout the treated years could be re-counted as annual new patients, the actual total number of patients who received RT is expected to be less than what we reported. Therefore, the annual number of patients who received RT should be considered under these limitations. In addition, the ‘metastasis’ category, which accounts for the largest proportion of patients in this study, may reduce the number of patients who received RT to each primary cancer site. Because we cannot distinguish whether the patients actually received RT to a metastatic site or to a primary site in cases with a metastatic diagnostic code, we assumed that the patients with metastatic diagnostic codes received RT to a metastatic site. As a result, the proportions of patients who received RT to metastatic sites were high in this study. According to the RT statistics data published in KOSRO, the portion of the ‘metastasis’ category for all patients receiving RT was 15%-18% between 1999 and 2006 [3-6]; however, the proportions of the ‘metastasis’ category were 32% in 2009 and 27% in 2013 in the current study. This may have been an under-estimation of the number of each primary cancer site.

Conclusion

In conclusion, the number of patients who received RT in Korea has shown a steady increase; however, the percentages of cancer patients who underwent irradiation were expected to still be below 30%. Although the use of claims data from the HIRA has some limitations, it provided useful cumulative clinical data supporting RT as one of the main modalities for cancer treatment in Korea.

Notes

Conflict of interest relevant to this article was not reported.

ACKNOWLEDGMENTS

This work was supported by the National Nuclear R & D program of the Ministry of Education, Science and Technology, Republic of Korea.

References

1. Jung KW, Won YJ, Kong HJ, Oh CM, Cho H, Lee DH, et al. Cancer statistics in Korea: incidence, mortality, survival, and prevalence in 2012. Cancer Res Treat. 2015; 47:127–41.
crossref
2. Lee TJ, Kim S, Cho HJ, Lee JH. The incidence of thyroid cancer is affected by the characteristics of a healthcare system. J Korean Med Sci. 2012; 27:1491–8.
crossref
3. You SY, Kim MS, Ji YH, Cho CK, Yang KM, Ryu HJ. National statistics of radiation oncology in Korea (1999-2001). J Korean Soc Ther Radiol Oncol. 2004; 22:234–6.
4. Kim MS, Ji YH, You SY, Cho CK, Yang KM, Ryu HJ. National statistics of radiation oncology in Korea (2002-2004). J Korean Soc Ther Radiol Oncol. 2006; 24:77–80.
5. Kim MS, Ji YH, You SY, Cho CK, Yang KM, Ryu HJ, et al. National statistics of radiation oncology in Korea (2005). J Korean Soc Ther Radiol Oncol. 2006; 24:207–9.
6. Ji YH, Kim MS, You SY, You DH, Choi MS, Jung HJ. National statistics of radiation oncology in Korea (2006). J Korean Soc Ther Radiol Oncol. 2008; 26:131–3.
7. Song SY, Ahn SD, Chung WK, Shin KH, Choi EK, Cho KH. Development of new on-line statistical program for the Korean Society for Radiation Oncology. Radiat Oncol J. 2015; 33:142–8.
crossref
8. Kim L, Kim JA, Kim S. A guide for the utilization of Health Insurance Review and Assessment Service National Patient Samples. Epidemiol Health. 2014; 36:e2014008.
crossref
9. Ji YH, Kim MS, Jung H, Yoo SY, Cho CK. Clinical characteristics of radiation oncology in Korea during past 10 years. J Korean Med Sci. 2009; 24:1165–9.
crossref
10. Jung KW, Won YJ, Park S, Kong HJ, Sung J, Shin HR, et al. Cancer statistics in Korea: incidence, mortality and survival in 2005. J Korean Med Sci. 2009; 24:995–1003.
crossref
11. Jung KW, Park S, Kong HJ, Won YJ, Lee JY, Seo HG, et al. Cancer statistics in Korea: incidence, mortality, survival, and prevalence in 2009. Cancer Res Treat. 2012; 44:11–24.
crossref
12. Jung KW, Won YJ, Kong HJ, Oh CM, Seo HG, Lee JS. Prediction of cancer incidence and mortality in Korea, 2013. Cancer Res Treat. 2013; 45:15–21.
crossref

Fig. 1.
Total number of patients who underwent radiation therapy in 2009 and 2013 in Korea.
crt-2015-370f1.tif
Fig. 2.
Cancer incidence and total number of patients who received radiation therapy through 2001 to 2013 in Korea. The cancer incidence for 2013 is the value predicted by Jung et al. [12].
crt-2015-370f2.tif
Fig. 3.
Time course of the number of patients who received radiation therapy at seven main sites.
crt-2015-370f3.tif
Table 1.
The customized source population
List Criterion
Treatment period 2009 Jan 1-2009 Dec 31, 2013 Jan 1-2013 Dec 31
Type of healthcare facility Tertiary, secondary
Diagnostic code C00-C97
Type of insurance Health insurance, medical aid
Hospital region National
Sex Male, female
Age All ages
Table 2.
Procedure codes related to radiation therapy
Procedure code Name of procedure codes
HD051 Teletherapy-Low energy-Single port
HD052 Teletherapy-Middle energy-Single port
HD053 Teletherapy-High energy-Single port
HD054 Teletherapy-Low energy-Paralleled opposed ports
HD055 Teletherapy-Middle energy-Paralleled opposed ports
HD056 Teletherapy-High energy-Paralleled opposed ports
HD058 Rotational irradiation-Middle energy radiation therapy
HD059 Rotational irradiation-High energy radiation therapy
HD061 3-Dimensional conformal therapy
HD080 External radioisotope therapy
HD081-HD082 Intracavitary therapy-High dose rate
HD083-HD084 Intracavitary therapy-Low dose rate
HD085-HD086 Interstitial, intraluminal therapy-High dose rate
HD088 Interstitial, intraluminal therapy-Low dose rate
HD089 Brachytherapy
HD091 Total body irradiation
HD092 Total body lymph node irradiation
HD093 Total skin electron beam therapy
HD110 Fractionated stereotactic radiotherapy
HD111-HD112 Body stereotactic radiosurgery-Using linear accelerator
HD113 Cranial stereotactic radiosurgery-Gamma knife
HD114 Cranial stereotactic radiosurgery-Cyber knife
HD115 Cranial stereotactic radiosurgery-Linear accelerator
HD121 Proton therapy
HD211-HD212 Stereotactic body radiosurgery-Using cyber knife
HZ271 Intensity modulated radiation therapy
Table 3.
Distribution of patients who received radiation therapy according to tumor site and sex in 2009 and 2013
Site Sub-site (diagnostic code) No. of patients in 2009
No. of patients in 2013
Male Female Total Male Female Total
Metastasis (C77-C79) 7,435 6,280 13,715 8,529 6,894 15,423
Breast (C50) 11 8,731 8,742 17 13,480 13,497
Gastrointestinal Colorectum (C18-C20) 2,129 1,109 3,238 2,416 1,203 3,619
Hepatobiliary (C22-C24) 1,706 566 2,272 2,329 746 3,075
Esophagus (C15) 737 43 780 992 79 1,071
Pancreas (C25) 226 147 373 397 275 672
Stomach (C16) 232 108 340 290 133 423
Anus (C21) 49 72 121 62 109 171
Small bowel (C17) 13 5 18 17 12 29
Other (C26) 2 0 2 1 0 1
Subtotal 5,094 2,050 7,144 6,504 2,557 9,061
Thoracic Lung (C34) 2,576 551 3,127 4,073 1,045 5,118
Thymus (C37) 86 70 156 115 80 195
Mediastinum (C38) 20 4 24 31 7 38
Trachea (C33) 6 7 13 6 8 14
Other (C39) 1 0 1 1 0 1
Subtotal 2,689 632 3,321 4,226 1,140 5,366
Head and neck Larynx (C32) 575 32 607 832 36 868
Oral cavity (C02-C06) 183 89 272 304 178 482
Oropharynx (C01, C09-C10) 193 35 228 395 66 461
Nasopharynx (C11) 125 42 167 271 92 363
Salivary gland (C07-C08) 127 77 204 163 116 279
Hypopharynx (C12-C13) 181 14 195 248 17 265
Paranasal sinus (C31) 57 27 84 82 39 121
Nasal cavity (C30) 48 19 67 64 34 98
Eye and orbit (C69) 17 16 33 23 16 39
Lip (C00) 8 2 10 5 5 10
Other (C14) 4 1 5 15 0 15
Subtotal 1,518 354 1,872 2,402 599 3,001
Gynecologic Uterine cervix (C53) - 1,942 1,942 - 2,095 2,095
Uterine corpus (C54-C55) - 521 521 - 618 618
Ovary and tubes (C56) - 72 72 - 111 111
Vagina and vulva (C51-C52) - 87 87 - 84 84
Other (C57-C58) - 3 3 - 5 5
Subtotal - 2,625 2,625 - 2,913 2,913
Genitourinary Prostate (C61) 847 - 847 2,097 - 2,097
Ureter and bladder (C66-C67) 178 52 230 291 69 360
Kidney (C64-C65) 47 17 64 77 38 115
Penis and testis (C60, C62-C63) 34 - 34 53 - 53
Other (C68) 0 4 4 0 7 7
Subtotal 1,106 73 1,179 2,518 114 2,632
Central nervous system Brain (C70-C71) 700 557 1,257 815 656 1,471
Spinal cord (C72) 20 12 32 17 24 41
Other (C47) 11 7 18 23 18 41
Subtotal 731 576 1,307 855 698 1,553
Lymphoma Hodgkin's disease (C81) 58 23 81 61 26 87
Non-Hodgkin's lymphoma (C82-C88) 541 398 939 676 542 1,218
Other (C96) 2 2 4 9 7 16
Subtotal 601 423 1,024 746 575 1,321
Soft tissue (C46, C49) 177 140 317 295 219 514
Myeloma and plasmacytoma (C90) 132 125 257 179 163 342
Leukemia (C91-C95) 159 115 274 170 132 302
Skin (C44) 84 83 167 123 102 225
Thyroid (C73) 57 122 179 72 134 206
Malignant melanoma (C43) 38 34 72 68 61 129
Primary bone and cartilage (C40-C41) 69 42 111 59 38 97
Endocrine (C74-C75) 26 14 40 37 22 59
Others (C45, C48, C76, C80, C97) 85 52 137 136 73 209
Total 20,012 22,471 42,483 26,936 29,914 56,850
Table 4.
The number of patients who received radiation therapy by site and age group in 2013
Treatment site Age group
Total
20s or under 30s 40s 50s 60s 70s or older
Metastasis 150 614 2,150 4,351 4,240 3,918 15,423
Breast 137 1,411 4,976 4,412 1,872 689 13,497
Gastrointestinal 15 178 880 2,605 2,753 2,630 9,061
Respiratory 18 60 300 989 1,774 2,225 5,366
Head and neck 54 132 343 816 867 789 3,001
Gynecologic 45 257 611 911 529 560 2,913
Genitourinary 13 20 58 289 854 1,398 2,632
Central nervous system 227 159 285 343 300 239 1,553
Lymphoma 126 127 215 333 243 277 1,321
Soft tissue 61 53 75 99 105 125 518
Myeloma and plasmacytoma 0 8 34 87 118 95 342
Leukemia 118 66 47 45 23 3 302
Skin 3 11 25 32 42 112 225
Thyroid 7 10 26 60 42 61 206
Malignant melanoma 0 8 17 36 37 31 129
Primary bone and cartilage 25 5 12 26 16 13 97
Endocrine 18 5 10 8 10 8 59
Others 9 6 24 51 53 62 205
All cancer 1,026 3,130 10,088 15,493 13,878 13,235 56,850
TOOLS
Similar articles