Introduction
Materials and Methods
1. Study participants
Table 1.
2. Measurement of Se and Cu level
3. Statistical analysis
Results
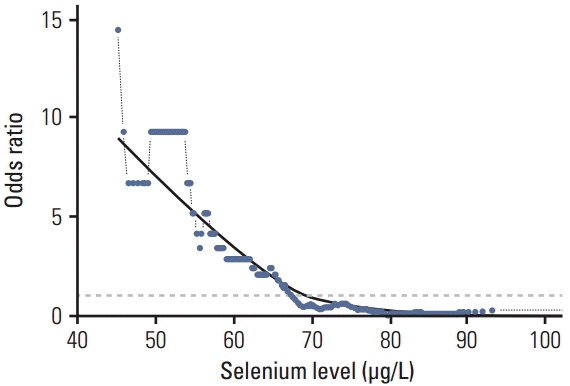
1. Se levels in PaCa patients compared to control subjects
 | Fig. 1.The probability curve of developing pancreatic cancer (odds ratio) for selenium levels (μg/L) shown for a sliding window approach (window size, 30 observations). Values above that line indicate an increased probability, values below indicate a decreased probability of developing pancreatic cancer. The reference proportion is 1:1 for the whole series (odds ratio 1, dotted grey line). A Lowess-regression was applied to these calculated data points to estimate the underlying probability curve. Note that the odds ratio scale is not proportional: e.g., a 10-fold increased probability of developing pancreatic cancer corresponds to odds ratio 10, while a 10-fold decreased probability corresponds to odds ratio 0.1. |
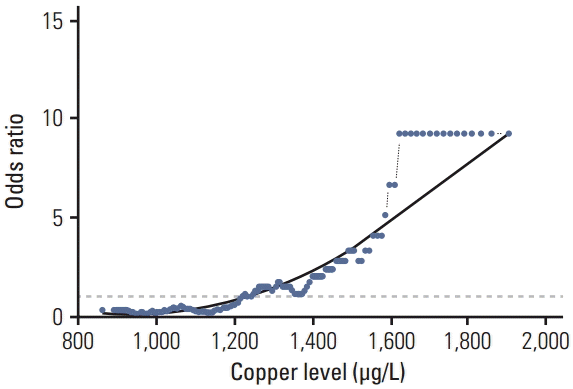
2. Cu levels in PaCa patients compared to control subjects
 | Fig. 2.The probability curve of developing pancreatic cancer (odds ratio) for copper levels (μg/L) shown for a sliding window approach (window size, 30 observations). Values above that line indicate an increased probability, values below indicated a decreased probability of developing pancreatic cancer. The reference proportion is 1:1 for the whole series (odds ratio 1, dotted grey line). A Lowess-regression was applied to these calculated data points to estimate the underlying probability curve. Note that the odds ratio scale is not proportional: e.g., a 10-fold increased probability of developing pancreatic cancer corresponds to odds ratio 10, while a 10-fold decreased probability corresponds to odds ratio 0.1. |
Table 3.
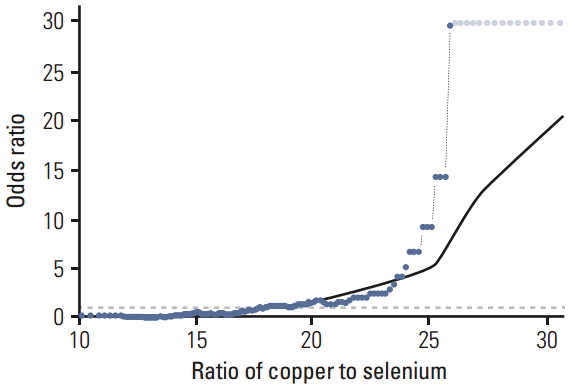
3. Cu:Se ratio in PaCa patients compared to control subjects
 | Fig. 3.The probability curve of developing pancreatic cancer (odds ratio) for the ratio of copper to selenium levels shown for a sliding window approach (window size: 30 observations). Values above that line indicate an increased probability, values below indicate a decrease probability of developing pancreatic cancer. The reference proportion is 1:1 for the whole series (odds ratio 1, dotted grey line). A lowess-regreesion was applied to these calculated data points to estimate the underlying probability curve. Note that the odds ratio scale is not proportional: e.g., a 10-fold increased probability of developing pancreatic cancer corresponds to odds ratio 10, while a 10-fold decreased probability corresponds to odds ratio 0.1. For highest proportions of copper to selenium, where there are no controls, just cases, for the overlapping windows odds ratio was conservatively estimated to be the same as the last calculated odds ratio. Such odds ratios were marked with a grey color in the graphic to avoid confusion. |
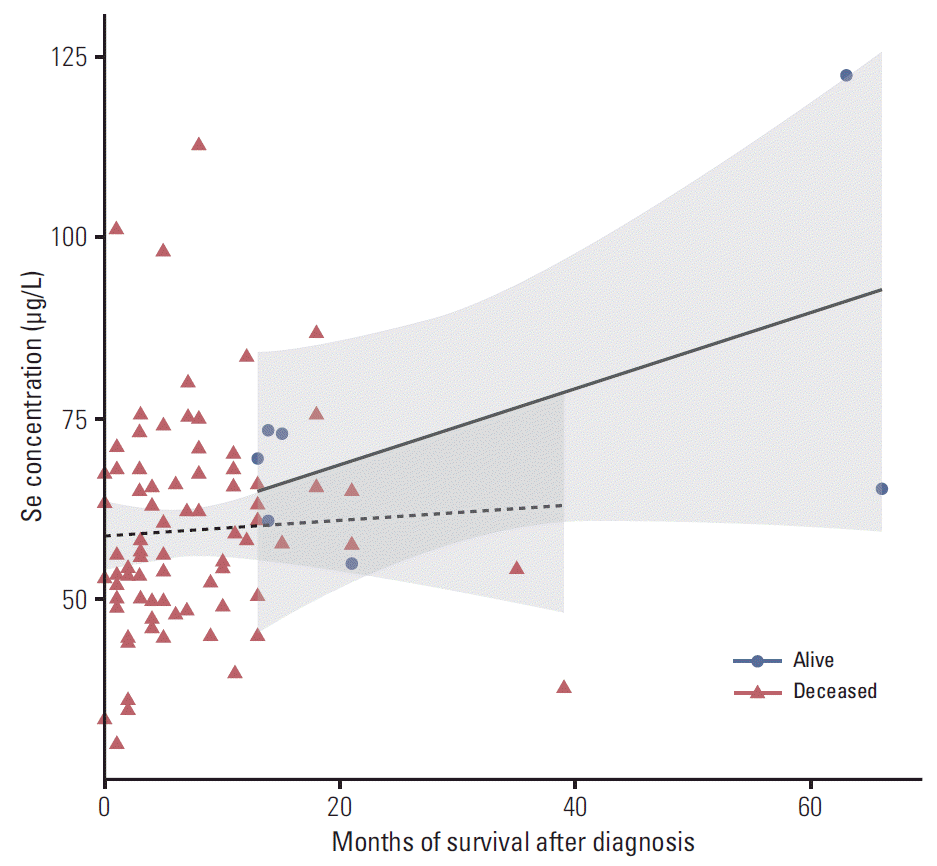
4. Prognosis of PaCa patients appears dependent on serum Se concentration
 | Fig. 4.The relationship between survival time and selenium (Se) blood plasma level among pancreatic cancer patients (separated for patients still alive and already deceased) is depicted as two regression lines (with confidence intervals shown in gray). Higher Se values seem to be associated with increasing survival time; however, this association is not significant (generalized linear model adjusted for age, sex, pack-years, and survival status, p=0.0820). |


 PDF
PDF Citation
 Print
Print


 XML Download