Journal List > Cancer Res Treat > v.48(3) > 1153356

Lee and Park: Cost Effectiveness of Colorectal Cancer Screening Interventions with Their Effects on Health Disparity Being Considered

Abstract

Purpose

The purpose of this study was to evaluate the cost effectiveness of colorectal cancer screening interventions with their effects on health disparity being considered.

Materials and Methods

Markov cohort simulation was conducted with the cycle/duration of 1/40 year(s). Data came from the results of randomized trials and others. Participants were hypothetical cohorts aged 50 years as of year 2013 in 16 Korean provinces. The interventions until the age of 80 were annual organized fecal occult blood test (FOBT) (standard screening), annual FOBT with basic reminders for provinces with higher mortalities than the national average (targeted reminder) and annual FOBT with basic/enhanced reminders for all provinces (universal reminder 1 and 2). The comparison was non-screening, the outcome was quality-adjusted life years, and only medical costs for screening and treatment were considered from a societal perspective. The Atkinson incremental cost effectiveness ratio (Atkinson ICER), the incremental cost effectiveness ratio adjusted by the Atkinson Inequality Index, was used to evaluate the cost effectiveness of the four interventions with their impacts on regional health disparity being considered.

Results

Health disparity was smallest (or greatest) in non-screening (or the standard screening). The targeted reminder had smaller health disparity, and smaller Atkinson ICER with respect to standard screening, than did the universal reminder 1 and 2.

Conclusion

The targeted reminder might be more cost effective than the universal reminders with their effects on health disparity being considered. This study helps to develop promotional effort for colorectal cancer screening with both the greatest cost effectiveness and the smallest health disparity

Introduction

Colorectal cancer is the fourth most common cause of cancer death in the world (0.69 million, 8.5%) [1]. Early detection and treatment are essential for reducing high mortality from colorectal cancer, given that adenomas and early colorectal cancers are usually small and asymptomatic [2]. However, participation in colorectal cancer screening shows a wide variation across different socioeconomic or regional conditions, e.g., from 53% in Oklahoma to 72% in Delaware in the United States during 2006-2010 [2], from 33% in the most deprived area to 67% in the least deprived area in England for the year 2008 (organized screening) [3], and from 22% in Gyeongnam (a rural province) to 28% in Daejeon (a metropolitan province) in South Korea (Korea hereafter) for the year 2012 (organized screening) [4]. This disparity in colorectal cancer screening might exacerbate disparity in health status, making more contribution to those with higher participation in this intervention.
However, the current cost effectiveness analysis of colorectal cancer screening focuses on improving population health and ignores health disparity generated by this intervention. But recent studies show that the purposes of maximizing population health and minimizing health disparity often contradict with each other: the promotion of a “targeted” reminder designed to increase participation in organized colorectal cancer screening among deprived populations with ethnic diversity minimizes health disparity, whereas the promotion of a “universal” reminder designed to increase participation in organized colorectal cancer screening among the entire population maximizes population health in the United Kingdom [5]. For this reason, several researchers started to develop distributional cost effectiveness analysis (DCEA) of healthcare interventions, a combination of cost effectiveness analysis and health disparity examination.
This study might be the first DCEA of cancer screening interventions in East Asia. Socioeconomic disparity in organized colorectal cancer screening has slightly decreased in Korea since 2005, e.g., 10.3% vs. 16.9% for medicaid vs. insured in 2006, then 22.2% vs. 26.1% in 2012 [4]. However, regional disparity in this intervention still persists in the nation, i.e., from 22% in Gyeongnam (a rural province) to 28% in Daejeon (a metropolitan province) for 2012 [4]. Indeed, Korea has much lower national participation in organized colorectal cancer screening than does the United Kingdom, i.e., 26% in 2012 vs. 52% in 2008 [3,4]. In this context, this study evaluated the cost effectiveness of organized colorectal cancer screening interventions (i.e., screening with various types of reminders), with their impacts on regional health disparity being considered.

Materials and Methods

1. Participant, intervention, comparison, and outcome

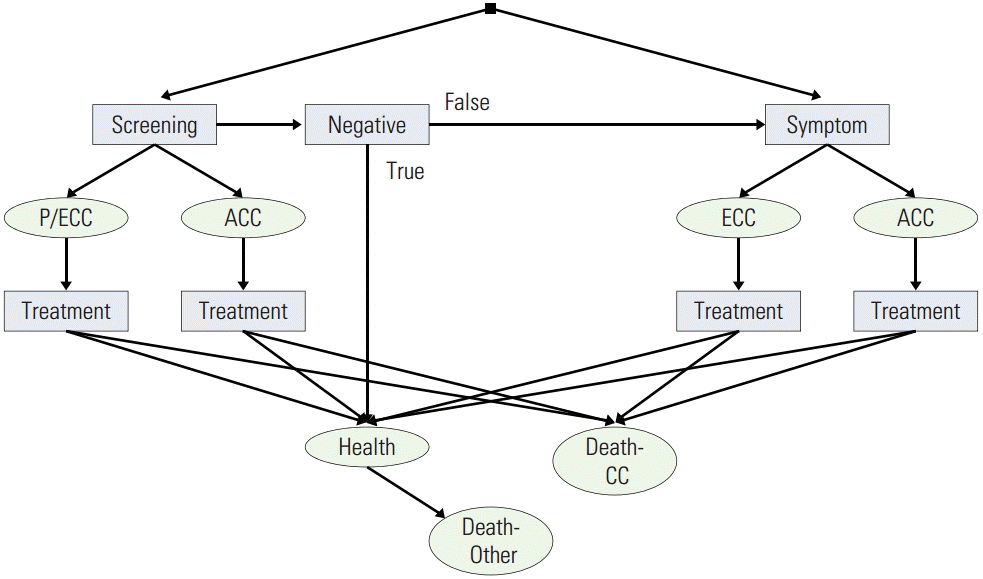
Markov cohort simulation was conducted for hypothetical cohorts aged 50 years as of the year 2013 in each of 16 Korean provinces. The interventions until the age of 80 were (1) annual fecal occult blood test (FOBT) (standard screening), (2) annual FOBT with basic reminder letters for eight provinces with higher mortalities from either all causes or colorectal cancer than the national average (i.e., Busan [metropolis], Gangwon, Chungbuk, Chungnam, Jeonbuk, Jeonnam, Gyeongbuk, and Gyeongnam [rural areas]) [6] (targeted reminder), (3) annual FOBT with basic reminder letters for all provinces (universal reminder 1), and (4) annual FOBT with enhanced reminder letters (i.e., personal reminder letters with tailored information packages) for all provinces (universal reminder 2). The comparison was non-screening. The outcome measure was quality-adjusted life years (QALYs). The Markov states were (1) healthy, (2) polyps not detected by screening (P1), (3) polyps detected by screening (P2), (4) symptom-free early colorectal cancer not detected by screening (ECC1), (5) symptom-free early colorectal cancer detected by screening (ECC2), (6) symptomatic early colorectal cancer (ECC3), (7) symptom-free advanced colorectal cancer not detected by screening (ACC1), (8) symptom-free advanced colorectal cancer detected by screening (ACC2), (9) symptomatic advanced colorectal cancer (ACC3), (10) death from colorectal cancer, and (11) death from other causes (the true positive goes through colorectal cancer treatment without further colorectal cancer screening). The length of the cycle was 1 year and the length of the duration was 40 years between the ages of 50 and 90. Only medical costs for screening and treatment were considered from a societal perspective. The “Atkinson incremental cost effectiveness ratio (Atkinson ICER),” the incremental cost effectiveness ratio adjusted by the Atkinson Inequality Index (to be elaborated below) was used to evaluate the cost effectiveness of the four interventions with their impacts on health disparity being considered.

2. Model structure

Fig. 1 shows a simplified version of the Markov model for cohort simulation. In each cycle, the healthy can stay healthy, develops polys (P1/2) or dies from causes other than colorectal cancer. Without treatment (polypectomy), one with polyps (1) stays as he or she is, (2) develops early colorectal cancer with the annual polyp-ECC transition rate of 0.005 [2,7,8], i.e., P1 to ECC1, P2 to ECC2, or (3) dies from causes other than colorectal cancer. Without treatment, one with early colorectal cancer (1) stays as he or she is, (2) develops advanced colorectal cancer with the mean ECC dwelling time of 2 years [2,7,8], i.e., ECC1 to ACC1, ECC2 to ACC2, ECC3 to ACC3, or (3) dies from causes other than colorectal cancer. Also, without treatment, the mean sojourn time from symptom-free to symptomatic colorectal cancer (i.e., from ECC1/2 to ECC3, from ACC1/2 to ACC3) is 5 years [9]. A new incidence of polyps is detected by a screening, while a new incidence of colorectal cancer is detected by either a screening or a symptom. The incidence rate of polyps or colorectal cancer is the same between screened and unscreened groups. Suspicious lesions detected by colonoscopy are biopsied and those detected by FOBT receive colonoscopy (and biopsy if applicable). One who receives polypectomy becomes healthy or dies from causes other than colorectal cancer. Patients who receive treatment either stay as cancer patients or die, and those who survived for 5 years after treatment have the same mortality rates with healthy people in the same age group. Table 1 summarizes the parameters, values and references for the model described above.

3. Utility, screening, natural history, and survival after treatment and cost

Utilities for the 11 Markov states came from a systematic review of colorectal cancer utilities [10] and a cost effectiveness analysis of colorectal cancer screening with blood-based biomarkers [11]. Three percent were introduced as annual discount rates for utility. Values on screening-related variables and the natural history of colorectal cancer were obtained from Statistics Korea [6], previous studies on cancer registry data (for Korea [4,12] and for Germany [9]), existing literature on the cost effectiveness of colorectal cancer screening [2,7,8,13], and Bayesian calibration for the natural history of colorectal cancer [14]. Data sources on survival after treatment were randomized trials through 13 and 30 years of follow-up for the cost effectiveness of colorectal cancer screening in the United States [15,16]. The cost of a basic/enhanced reminder letter, FOBT, colonoscopy and biopsy per participant in Korea for 2013 were derived from randomized trials for the cost effectiveness of reminder letters for colorectal cancer screening in the United States and UK for 2005 and 2009, respectively [17,18], the Korea Ministry of Health and Welfare notifications and the Korea Health Insurance Review and Assessment Service guidelines on health insurance medical cost including drug components and materials for medical treatment [19].
Based on the randomized trials, the basic (or enhanced) reminder letters are expected to increase the participation rate in colorectal cancer screening by 6% (or 12%) [17,18] (the cost of the reminder letter in the United States/United Kingdom was adjusted by the ratio of Korea’s per-capita health expenditure to its United States/United Kingdom counterpart for 2013 [20]). For instance, screening participation was assumed to be higher by 6% in the targeted-reminder intervention than in the standard-screening intervention in Busan, Gangwon, Chungbuk, Chungnam, Jeonbuk, Jeonnam, Gyeongbuk, and Gyeongnam, e.g., 27%, 35%, and 25% for those aged 51-60, 61-70, and 71-80 in Busan from Supplementary Table 1, respectively. The participation gap between the universal-reminder-1 and standard-screening interventions was presumed to be 6% in every area, e.g., 31%, 41%, and 29% for those aged 51-60, 61-70, and 71-80 in Seoul from Supplementary Table 1, respectively. Likewise, the participation difference between the universal-reminder-2 and standard-screening interventions was supposed to be 12% in every area, e.g., 37%, 47%, and 35% for those aged 51-60, 61-70, and 71-80 in Seoul from Supplementary Table 1, respectively. For the calculation of treatment cost per patient for colorectal cancer by the phase of care in Korea for the year 2013, treatment cost per patient for colorectal cancer from the Korea National Health Insurance Corporation [21] was adjusted by the share of direct cost for cancer care in the United States for the year 2010 by the phase of care [22]. The cost in Korean Won was converted to US dollars with the exchange rate of $1=1,055.4 Won as of the year 2013 [6]. The annual inflation rate adjusted by the annual discount rate for cost was assumed to be 1.

4. Social welfare analysis

The crux of DCEA is to adjust total effectiveness outcome (the “un-weighted” mean or sum of individuals’ effectiveness outcomes in the conventional cost effectiveness analysis) by an inequality index so that interventions with greater health disparity lead to smaller total effectiveness outcomes. One of popular inequality indexes is the Atkinson Inequality Index in Eq. (1) [23], a function of inequality aversion, i.e., public aversion to health disparity. Usually, inequality aversion on income distribution is measured as public opinion on the ideal rate of exchange between the incomes of those with highest income and those with the lowest income (Leaky Bucket Questionnaire) [24]. Likewise, inequality aversion on health distribution can be measured as public opinion on the ideal rate of exchange between the health of those with the best health and those with the worst health. Once the Atkinson Inequality Index is calculated for every intervention, the Atkinson ICER in Eq. (2), the incremental cost effectiveness ratio adjusted by the Atkinson Inequality Index, can be used to compare both cost effectiveness and health disparity from the interventions. Total effectiveness outcome in the Atkinson ICER, the denominator of Eq. (2), is different from the conventional ICER in the following manner: as inequality aversion increases, individuals with smaller QALYs/worse health have more weights in total effectiveness outcome than do those with greater QALYs/better health. The Atkinson Inequality Index becomes 0 and the Atkinson ICER becomes the conventional ICER when inequality aversion becomes 0. In this vein, the Atkinson Inequality Index and the Atkinson ICER were calculated to compare both cost effectiveness and health disparity from the standard screening, the targeted reminder and, the universal reminder 1 and 2 in Korea. Per-capita QALYs and percapita cost were computed for each intervention for each area based on the Markov cohort simulation described above (2014, TreeAge Software Inc., Williamstown, MA). Then, the Atkinson Inequality Index and the Atkinson ICER for the nation were calculated based on the equations below.
(1)
A=1-[1ni=1n(QiQ)1- ]11-
  • A Atkinson inequality index for ∈

  • n Population size

  • Qi QALY, individual i

  • Q QALY, per-capita (mean)

  • ∈ Inequality aversion

(2)
ICER=C2-C1(1-A2)Q2-(1-A1)Q1
  • ICER ICER for ∈

  • C2/1 Intervention 2/1’s per-capita cost

  • A2/1 Intervention 2/1’s Atkinson index

  • Q2/1 Intervention 2/1’s per-capita QALY

  • ∈ Inequality aversion

Results

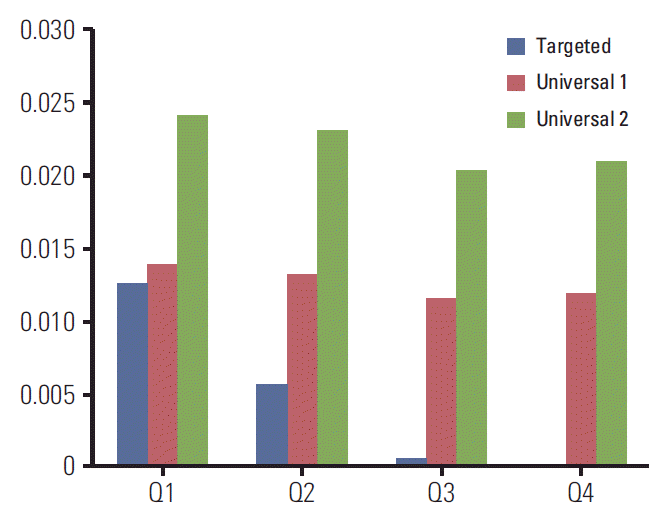
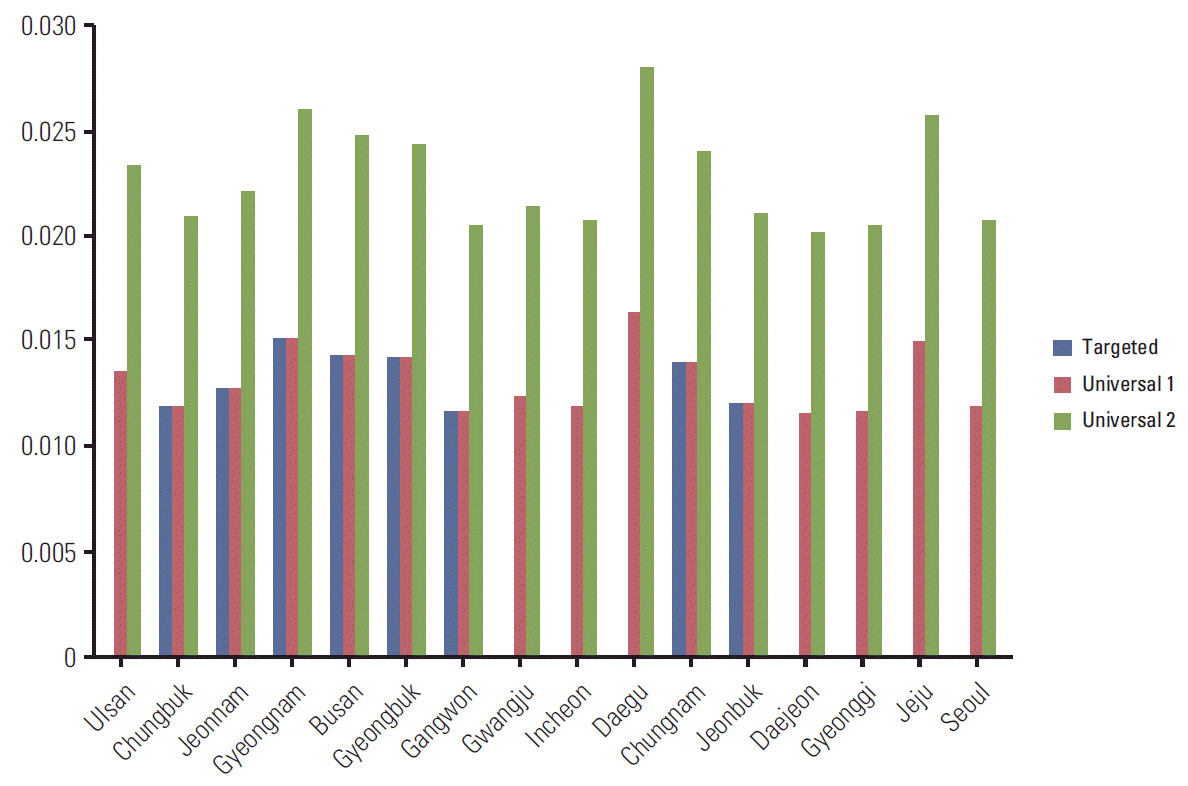
Table 2 shows per-capita QALYs and cost of interventions and the comparison by province in Korea. On a national level, non-screening was dominated by the standard screening, the targeted reminder and, the universal reminder 1 and 2: on a national level, non-screening resulted in smaller percapita QALYs and greater per-capita cost than did the standard screening, the targeted reminder, and the universal reminder 1 and 2. Only four provinces had higher per-capita QALYs than the national mean across interventions and the comparison, i.e., Seoul (the capital of the nation), Gyeonggi (the province surrounding Seoul), Daejeon (the province specialized in research and development), and Jeju (a southern island). The pattern was similar for the per-capita cost of non-screening, the standard screening, and the universal reminder 1 and 2. As expected, however, eight provinces with basic reminder letters, i.e., Busan (metropolis), Gangwon, Chungbuk, Chungnam, Jeonbuk, Jeonnam, Gyeongbuk, and Gyeongnam (rural areas), had the higher per-capita cost of the targeted-reminder intervention than the national mean. Figs. 2 or 3 presents per-capita QALY gains of the targeted reminder, and the universal reminder 1 and 2 compared to the standard screening by QALY group (or by province). Assume that the cohort consists of 100,000 participants. Then, in Fig. 2, Q1 is 25,000 participants with the smallest QALYs and Q2 is 25,000 with QALYs greater than Q1’s and smaller than the median QALY of the cohort. Likewise, Q4 is 25,000 participants with the greatest QALYs and Q3 is 25,000 with QALYs smaller than Q4’s and greater than the median QALY of the cohort. The per-capita QALY gain of the targeted-reminder intervention compared to the standard screening was greatest for Q1 (0.0125), followed by Q2 (0.0056), Q3 (0.0006), and Q4 (0.0000). A similar pattern was found for the universal reminder 1 and 2 albeit by a smaller gap between Q1 and another QALY group in terms of percapita QALY gain.
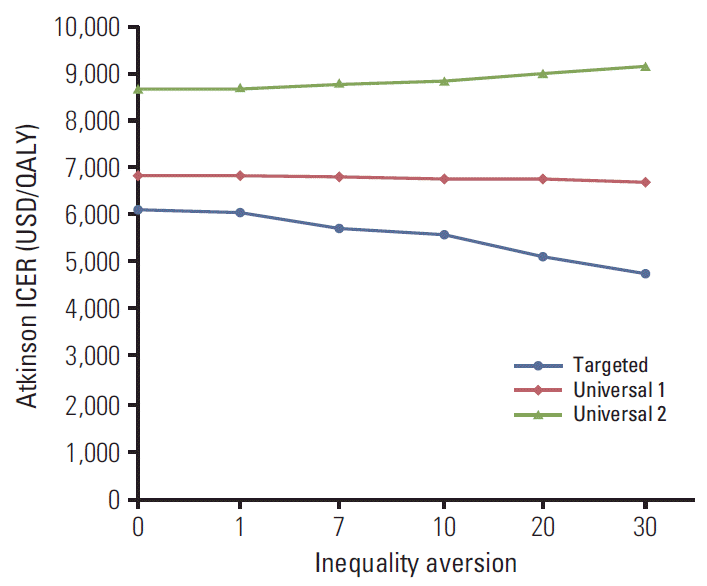
Table 3 displays the Atkinson Inequality Indexes and the Atkinson ICERs of interventions and the comparison across different values of inequality aversion. Health disparity, measured by the Atkinson Inequality Index, was smallest (or greatest) in non-screening (or the standard screening). Across inequality aversion, indeed, the targeted reminder had smaller health disparity, and greater cost effectiveness with respect to the standard screening, than did the universal reminder 1 and 2, e.g., $6,140 vs. $6,868 and $8,726 (or $5,744 vs. $6,831 and $8,835) for the Atkinson ICER with the inequality aversion of 0 (or 7). Moreover, as inequality aversion increases, (1) the Atkinson ICER of the targeted reminder becomes smaller, (2) the Atkinson ICER of the universal reminder 2 becomes greater, and (3) a gap between the targeted reminder and the universal reminder 1 (or 2) in terms of the Atkinson ICER expands (Fig. 4). If public aversion to health disparity becomes greater, these results suggest, the gap between the cost effectiveness of the targeted reminder (minimizing health disparity) and the universal reminder 1 and 2 (maximizing population health) will become greater.

Discussion

This study might be the first DCEA of cancer screening interventions in East Asia, evaluating the cost effectiveness of organized colorectal cancer screening interventions with various types of reminders, with their impacts on regional health disparity being considered. Based on the results of this study, health disparity was smallest (or greatest) in non-screening (or the standard screening) across inequality aversion. Across inequality aversion, in addition, the targeted reminder had smaller health disparity, and greater cost effectiveness with respect to the standard screening, than did the universal reminder 1 and 2. Moreover, if public aversion to health disparity increases, a difference between the cost effectiveness of the targeted reminder (minimizing health disparity) and the universal reminder 1 and 2 (maximizing population health) will increase.
These findings are largely consistent with those on the distributional cost effectiveness of organized colorectal cancer screening interventions in the United Kingdom (i.e., the standard screening, the targeted reminder and the universal reminder 1) [5]. As in Korea, across all or most values of inequality aversion, health disparity was smallest in non-screening and the targeted reminder had smaller health disparity and greater cost effectiveness (with respect to the standard screening) than did the universal reminder 1 in the United Kingdom.
(1)
A=1-[1ni=1n(QiQ)1- ]11-
  • A Atkinson inequality index for ∈

  • n Population size

  • Qi QALY, individual i

  • Q QALY, per-capita (mean)

  • ∈ Inequality aversion

(2)
ICER=C2-C1(1-A2)Q2-(1-A1)Q1
  • ICER ICER for ∈

  • C2/1 Intervention 2/1’s per-capita cost

  • A2/1 Intervention 2/1’s Atkinson index

  • Q2/1 Intervention 2/1’s per-capita QALY

  • ∈ Inequality aversion

For model validation, simulated results for Seoul and Gyeonggi (covering 45% of Korea’s population) were compared with actual data from randomized trials through 30 years of follow-up for the cost effectiveness of colorectal cancer screening in the United States [16]. Simulation outcomes were comparable to actual data regarding the relative risk of 30-year mortality with annual screening for a cohort aged 60 at the baseline, i.e., 0.62 for Seoul and Gyeonggi vs. 0.68 for the United States.
A major policy implication of this study and DCEA in general is that public aversion to health disparity can be an important factor for the cost effectiveness of a healthcare intervention especially in a region with significant health disparity: If inequality aversion increases, healthcare interventions designed to minimize health disparity (e.g., the targeted reminder) will become relatively more cost effective than those designed to maximize population health (e.g., the universal reminder 1 and 2). Based on a global analysis of inequality aversion on income distribution for 1999 [25], the range of inequality aversion was 0.42-1.88 in the United States, 0.67-3.35 in the United Kingdom, 0.68-3.67 in Spain, and 0.72-3.83 in Italy with population sizes and per-capita GDPs of the latter three nations comparable to Korea’s for the year 2013. Unfortunately, however, no such examination has been available on health distribution. This line of research might make great contribution to DCEA.
This study has the following limitations as well. First, sensitivity analysis for different values of utility for polyps and colorectal cancer might present additional insights on this line of research, even though these values in this study came from well-established existing literature including a systematic review of colorectal cancer utilities and a cost effectiveness analysis of colorectal cancer screening with blood-based biomarkers. Second, this study did not consider whether various types of reminders are economically feasible. In some cases, new interventions, which were proven to be cost effective, cannot be funded. Examining the economic feasibility of these reminders is expected to expand the boundary of knowledge on this topic. Third, this study focused on a dynamic interplay between cost effectiveness and regional health disparity from colorectal cancer screening interventions. Using micro-simulation to highlight disparity in patient-level variables such as family history, socioeconomic status and social support might be another promising direction of research on this important issue. Fourth, a significant part of data for this study came from existing literature for other nations with different healthcare systems. The results of this study need to be interpreted with a caution.

Conclusion

As promotional effort for colorectal cancer screening, the targeted reminder might be more cost effective than its universal-reminder counterpart with their effects on health disparity being considered. This study helps to develop promotional effort for colorectal cancer screening with the greatest cost effectiveness and the smallest health disparity at the same time.

Electronic Supplementary Material

Supplementary materials are available at Cancer Research and Treatment website (http://www.e-crt.org).

Notes

Conflict of interest relevant to this article was not reported.

ACKNOWLEDGMENTS

This work was supported by the Korean National Cancer Center [2014-141348].

References

1. International Agency for Research on Cancer. GLOBOCAN 2012: estimated cancer incidence, mortality and prevalence worldwide in 2012 [Internet]. Lyon: IARC;2015. [cited 2015 Jul 26]. Available from: http://globocan.iarc.fr/Default.aspx.
2. American Cancer Society. Colorectal cancer facts and figures 2011-2013. Atlanta, GA: American Cancer Society;2011.
3. Logan RF, Patnick J, Nickerson C, Coleman L, Rutter MD, von Wagner C. Outcomes of the Bowel Cancer Screening Programme (BCSP) in England after the first 1 million tests. Gut. 2012; 61:1439–46.
crossref
4. Korean National Cancer Center. Korea cancer facts and figures 2014. Goyang: Korean National Cancer Center;2014.
5. Asaria M, Griffin S, Cookson R, Whyte S, Tappenden P. Distributional cost-effectiveness analysis of health care programmes: a methodological case study of the UK Bowel Cancer Screening Programme. Health Econ. 2015; 24:742–54.
6. Korean Statistical Information Service [Internet]. Daejeon: Statistics Korea;2015. [cited 2015 Feb 28]. Available from: http://kosis.kr/.
7. Park SM, Yun YH, Kwon S. Feasible economic strategies to improve screening compliance for colorectal cancer in Korea. World J Gastroenterol. 2005; 11:1587–93.
crossref
8. Markowitz AJ, Winawer SJ. Management of colorectal polyps. CA Cancer J Clin. 1997; 47:93–112.
crossref
9. Brenner H, Altenhofen L, Katalinic A, Lansdorp-Vogelaar I, Hoffmeister M. Sojourn time of preclinical colorectal cancer by sex and age: estimates from the German national screening colonoscopy database. Am J Epidemiol. 2011; 174:1140–6.
crossref
10. Djalalov S, Rabeneck L, Tomlinson G, Bremner KE, Hilsden R, Hoch JS. A review and meta-analysis of colorectal cancer utilities. Med Decis Making. 2014; 34:809–18.
crossref
11. Ladabaum U, Allen J, Wandell M, Ramsey S. Colorectal cancer screening with blood-based biomarkers: cost-effectiveness of methylated septin 9 DNA versus current strategies. Cancer Epidemiol Biomarkers Prev. 2013; 22:1567–76.
crossref
12. Shin A, Choi KS, Jun JK, Noh DK, Suh M, Jung KW, et al. Validity of fecal occult blood test in the national cancer screening program, Korea. PLoS One. 2013; 8:e79292.
crossref
13. Lansdorp-Vogelaar I, Knudsen AB, Brenner H. Cost-effectiveness of colorectal cancer screening. Epidemiol Rev. 2011; 33:88–100.
crossref
14. Whyte S, Walsh C, Chilcott J. Bayesian calibration of a natural history model with application to a population model for colorectal cancer. Med Decis Making. 2011; 31:625–41.
crossref
15. Mandel JS, Bond JH, Church TR, Snover DC, Bradley GM, Schuman LM, et al. Reducing mortality from colorectal cancer by screening for fecal occult blood. Minnesota Colon Cancer Control Study. N Engl J Med. 1993; 328:1365–71.
16. Shaukat A, Mongin SJ, Geisser MS, Lederle FA, Bond JH, Mandel JS, et al. Long-term mortality after screening for colorectal cancer. N Engl J Med. 2013; 369:1106–14.
crossref
17. Shankaran V, McKoy JM, Dandade N, Nonzee N, Tigue CA, Bennett CL, et al. Costs and cost-effectiveness of a low-intensity patient-directed intervention to promote colorectal cancer screening. J Clin Oncol. 2007; 25:5248–53.
crossref
18. Hewitson P, Ward AM, Heneghan C, Halloran SP, Mant D. Primary care endorsement letter and a patient leaflet to improve participation in colorectal cancer screening: results of a factorial randomised trial. Br J Cancer. 2011; 105:475–80.
crossref
19. Korea Ministry of Health and Welfare. Notification 2014-2: National medicial checkup guideline. Sejong: Korea Ministry of Health and Welfare;2014.
20. World Bank. World development indicators [Internet]. Washington, DC: World Bank;2015. [cited 2015 Feb 28]. Available from: http://data.worldbank.org/data-catalog/world-development-indicators.
21. Korea National Health Insurance Corporation. Korea national insurance statistical yearbook 2012. Wonju: Korea National Health Insurance Corporation;2013.
22. Mariotto AB, Yabroff KR, Shao Y, Feuer EJ, Brown ML. Projections of the cost of cancer care in the United States: 2010-2020. J Natl Cancer Inst. 2011; 103:117–28.
crossref
23. Atkinson AB. On the measure of inequality. J Econ Theor. 1970; 2:244–63.
24. Pirttila J, Uusitalo R. A ‘Leaky Bucket’ in the real world: estimating inequality aversion using survey data. Economica. 2010; 77:60–76.
25. Lambert PJ, Millimet DL, Slottje D. Inequality aversion and the natural rate of subjective inequality. J Public Econ. 2003; 87:1061–90.
crossref

Fig. 1.
Simplified version of Markov cohort simulation model. P, polyp; ECC, early colorectal cancer; ACC, advanced colorectal cancer; CC, colorectal cancer.
crt-2015-279f1.tif
Fig. 2.
Per-capita quality-adjusted life years (QALY) gains of interventions compared to the standard screening: by QALY group.
crt-2015-279f2.tif
Fig. 3.
Per-capita quality-adjusted life years gains of interventions compared to the standard screening: by province.
crt-2015-279f3.tif
Fig. 4.
Atkinson International Centre for Economic Research (ICERs) of interventions compared to the standard screening: by inequality aversion. QALY, qualityadjusted life years.
crt-2015-279f4.tif
Table 1.
Parameters, values, and references
Parameter Value Reference
Utility [10,11]
 Healthy 1
 Polyp1 (undetected, symptom-free) 0.9
 PoIyp2 (detected, symptom-free) 0.9
 ECC1 (undetected, symptom-free) 0.8
 ECC2 (detected, symptom-free) 0.8
 ECC3 (detected, symptomatic) 0.8
 ACC1 (undetected, symptom-free) 0.76
 ACC2 (detected, symptom-free) 0.76
 ACC3 (detected, symptomatic) 0.68
 Dead 0
Screening
 Participation rate Supplementary Table 1 [4]
Sensitivity
 FOBT, polyp 0.1 [12]
 FOBT, cancer by age [13]
  51-60 yr 0.62
  61-70 yr 0.6
  71-80 yr 0.57
 CoIonoscopy, poIyp 0.85 [12]
 CoIonoscopy, cancer 0.97 [12]
Natural history of colorectal cancer
 PoIyp prevaIence per 100,000 at age 50 yr 25,000 [2,7,8]
 Polyp incidence per 100,000 by age, annual [14]
  50-59 yr 530
  60-69 yr 1,100
  70-79 yr 1,560
  ≥ 80 yr 190
 Polyp-ECC transition rate, annual 0.005 [2,7,8]
 ECC dwelling time (yr) 2 [2,7,8]
 Mean sojourn time (yr) 5 [9]
5-Year survival rate after operation [15,16]
 ECC2 (symptom-free) 0.94
 ECC3 (symptomatic) 0.94
 ACC2 (symptom-free) 0.57
 ACC3 (symptomatic) 0.57
Mortality from other causes by age, annual Supplementary Table 2 [6]
Cost (current USD)
 Targeted/UniversaI-1/UniversaI-2 Reminder 3/3/5 [6,17,18,22]
 FOBT 4 [6,19]
 CoIonoscopy 58 [6,19]
 Biopsy 43 [6,19]
 PoIypectomy 163 [6,19]
 Treatment [20,21]
  Initial 4,342
  Continuing 215
  Final 6,737

ECC, early colorectal cancer; ACC, advanced colorectal cancer; FOBT, fecal occult blood test; USD, US dollar.

Table 2.
Per-capita quality-adjusted life years and cost of interventions and comparison
Population No screening Standard Targeted Universal 1 Universal 2
QALY
 Nation 100,000 19.28966 19.52593 19.53064 19.53863 19.54810
 Seoul 19,577 19.62310 19.86957 19.86957 19.88138 19.89033
 Busan 6,842 19.07803 19.30357 19.31790 19.31790 19.32834
 Daegu 5,132 19.19457 19.41565 19.41565 19.43205 19.44369
 Daejeon 2,954 19.34365 19.58492 19.58492 19.59643 19.60519
 Incheon 6,155 19.16985 19.40671 19.40671 19.41852 19.42746
 Gwangju 2,842 19.16234 19.39668 19.39668 19.40895 19.41815
 Ulsan 2,555 18.85813 19.08096 19.08096 19.09442 19.10432
 Gyeonggi 25,084 19.38493 19.62702 19.62702 19.63866 19.64750
 Gangwon 2,962 19.15597 19.39398 19.40563 19.40563 19.41447
 Chungbuk 2,978 18.99632 19.22904 19.24099 19.24099 19.25000
 Chungnam 3,897 19.21233 19.44323 19.45712 19.45712 19.46730
 Jeonbuk 3,273 19.21761 19.45502 19.46702 19.46702 19.47607
 Jeonnam 3,274 19.04510 19.27671 19.28942 19.28942 19.29889
 Gyeongbuk 5,012 19.10479 19.33233 19.34646 19.34646 19.35677
 Gyeongnam 6,372 19.05105 19.27367 19.28880 19.28880 19.29970
 Jeju 1,090 19.39602 19.62808 19.62808 19.64303 19.65385
Cost (current USD)
 Seoul 19,577 1,674 1,234 1,234 1,326 1,395
 Busan 6,842 1,614 1,198 1,279 1,279 1,340
 Daegu 5,132 1,628 1,214 1,214 1,291 1,349
 Daejeon 2,954 1,642 1,211 1,211 1,302 1,369
 Incheon 6,155 1,623 1,198 1,198 1,286 1,353
 Gwangju 2,842 1,624 1,199 1,199 1,286 1,351
 Ulsan 2,555 1,589 1,177 1,177 1,258 1,319
 Gyeonggi 25,084 1,647 1,215 1,215 1,306 1,373
 Gangwon 2,962 1,620 1,196 1,285 1,285 1,352
 Chungbuk 2,978 1,604 1,185 1,272 1,272 1,337
 Chungnam 3,897 1,628 1,207 1,291 1,291 1,353
 Jeonbuk 3,273 1,629 1,203 1,291 1,291 1,358
 Jeonnam 3,274 1,609 1,190 1,276 1,276 1,340
 Gyeongbuk 5,012 1,616 1,199 1,281 1,281 1,342
 Gyeongnam 6,372 1,610 1,197 1,276 1,276 1,336
 Jeju 1,090 1,646 1,223 1,223 1,306 1,368

Standard, standard screening; Targeted, targeted reminder; Universal 1 (or 2), universal reminder 1 (or 2); QALY, quality-adjusted life years; USD, US dollar.

Table 3.
Atkinson Inequality Indexes and Atkinson ICERs of interventions across inequality aversion
Inequality aversiona) No screening Standard Targeted Universal 1 Universal 2
Atkinson Inequality Index (Aε)
0 0.00000 0.00000 0.00000 0.00000 0.00000
1 0.00006 0.00006 0.00006 0.00006 0.00006
7 0.00042b) 0.00044c) 0.00042 0.00043 0.00043
10 0.00059b) 0.00062c) 0.00060 0.00062 0.00061
20 0.00118b) 0.00123c) 0.00118 0.00122 0.00121
30 0.00175b) 0.00183c) 0.00176 0.00181 0.00180
Atkinson ICERε
0 - - 6,140d) 6,868d) 8,726d)
1 - - 6,080d) 6,863d) 8,741d)
7 - - 5,744d) 6,831d) 8,835d)
10 - - 5,592d) 6,816d) 8,882d)
20 - - 5,147d) 6,766d) 9,037d)
30 - - 4,786d) 6,718d) 9,188d)

Atkinson ICER, Atkinson incremental cost effectiveness ratios; Standard, standard screening; Targeted, targeted reminder; Universal 1 (or 2), universal reminder 1 (or 2).

a) e=1 shows low relative inequality aversion, whereas, e=30 represents high inequality aversion,

b) Minimums,

c) Maximums,

d) Cost effective compared to standard screening (Korea’s 2013 per capita GDP $25,977).

TOOLS
Similar articles