Introduction
Materials and Methods
1. Cell culture
2. Primary human gastric tissues
3. Reverse transcription polymerase chain reaction (RT-PCR)and quantitative real-time RT-PCR
4. Bisulfite genomic sequencing analyses and pyrosequencing
5. Chromatin immunoprecipitation
6. Drug treatment and siRNA transfection
7. Cell growth inhibition assays
Results
1. Epigenetic silencing of LPHN2 in human gastric and colorectal cancer cells
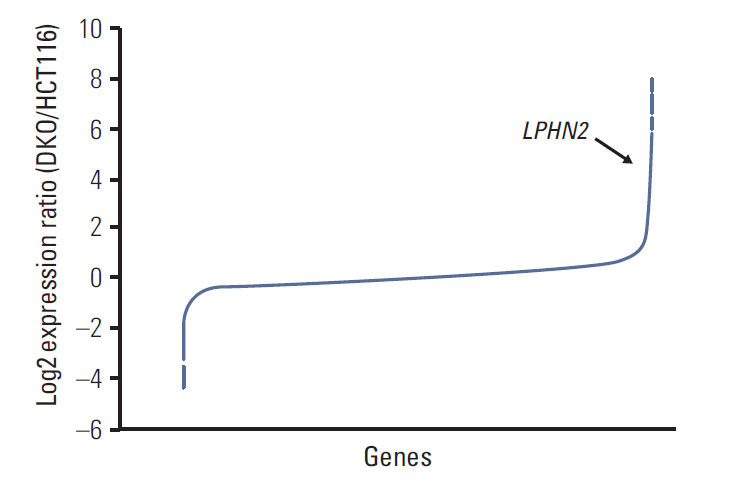 | Fig. 1.Microarray analyses of mRNA expression in HCT116 and DKO cells. Microarray analyses were performed in HCT116 cells and DNMT1/DNMT3B double knockout derivative DKO cells. Microarray data results are shown as the log2 expression ratio of genes between HCT116 and DKO. The black arrow indicates LPHN2. |
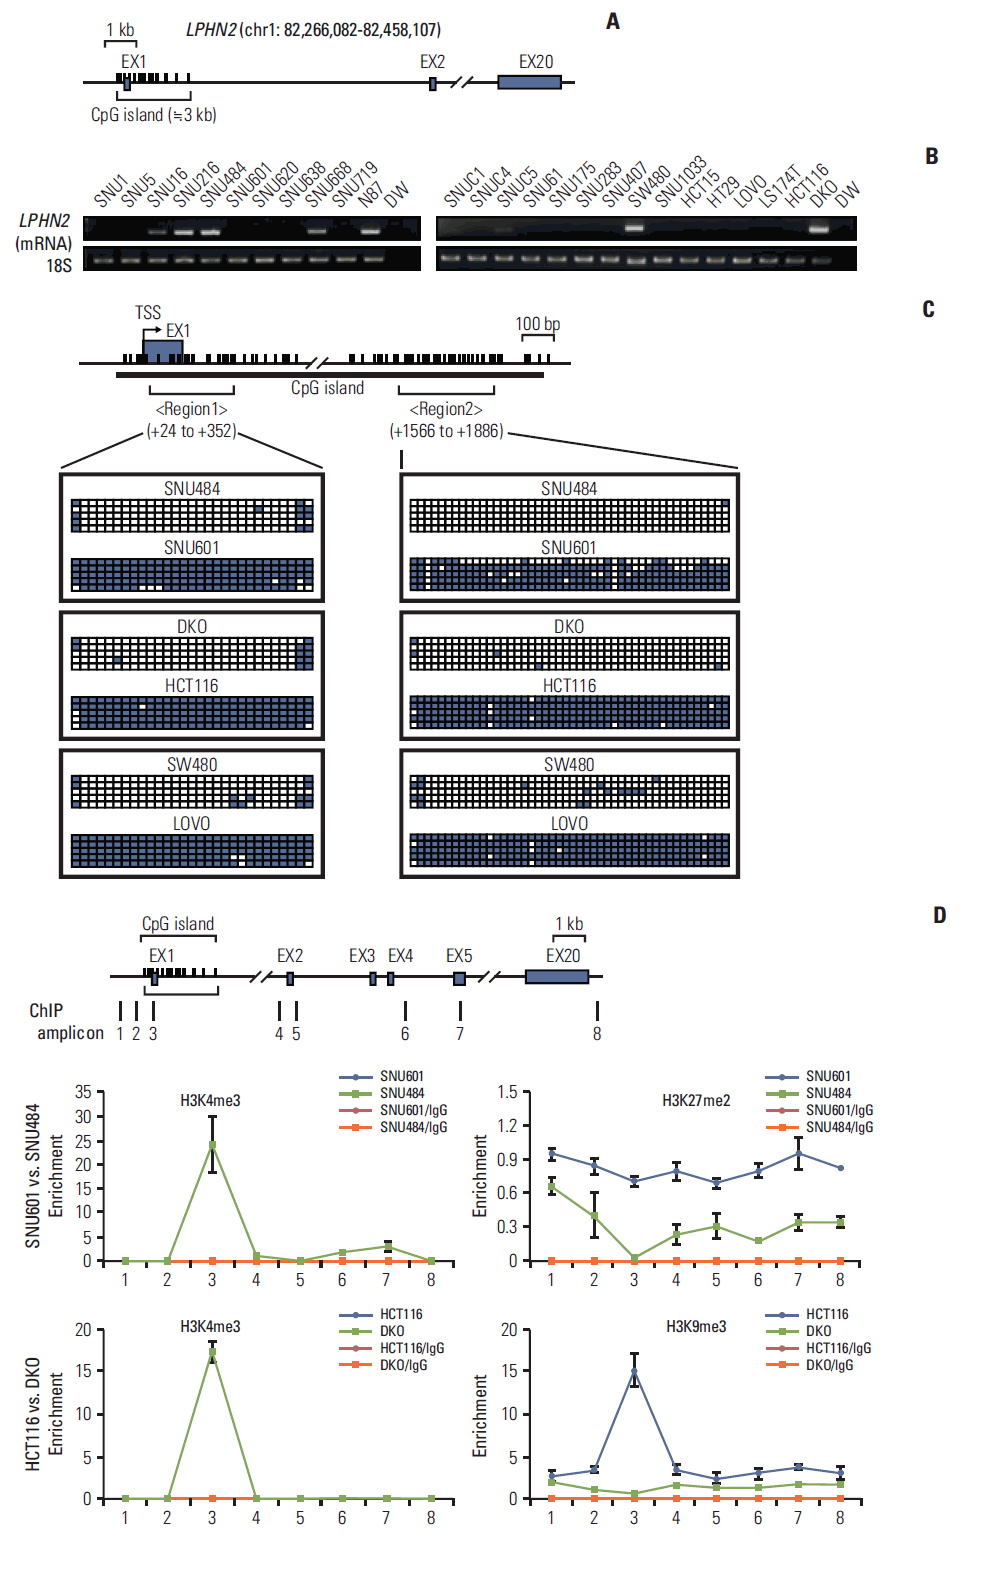 | Fig. 2.DNA methylation and histone modifications of LPHN2 in human gastric and colon cancer cells. (A) Schematic representation of LPHN2. LPHN2 exons are indicated by gray boxes. Vertical bars represent each CpG site. The CpG island is indicated according to University of California Santa Cruz (UCSC) genome browser. (B) LPHN2 mRNA from 11 gastric cancer cell lines (left panel) and 15 colorectal cancer cell lines (right panel) was analyzed by reverse transcription polymerase chain reaction (RT-PCR). 18S ribosomal RNA served as an internal control. DW, distilled water. (C) Bisulfite genomic sequencing analyses of the LPHN2 CpG islands in SNU601, SNU484, HCT116, DKO, LOVO, and SW480 cells. Each row of squares denotes a single plasmid cloned and sequenced from polymerase chain reaction products amplified from bisulfitetreated gDNA. Open and filled squares represent unmethylated and methylated CpG sites, respectively. TSS, transcriptional start site. (D) Characterization of chromatin modification patterns around LPHN2. Chromatin immunoprecipitation (ChIP) assays were performed in SNU601, SNU484, HCT116, and DKO cells using antibodies specific for the active histone marker H3K4me3 and the inactive histone markers H3K27me2 and H3K9me3. Enrichment was measured using quantitative real-time RT-PCR. Error bars represent the standard error of the mean for triplicate chromatin preparations. |
2. Demethylation of the LPHN2 CpG island restores LPHN2 expression
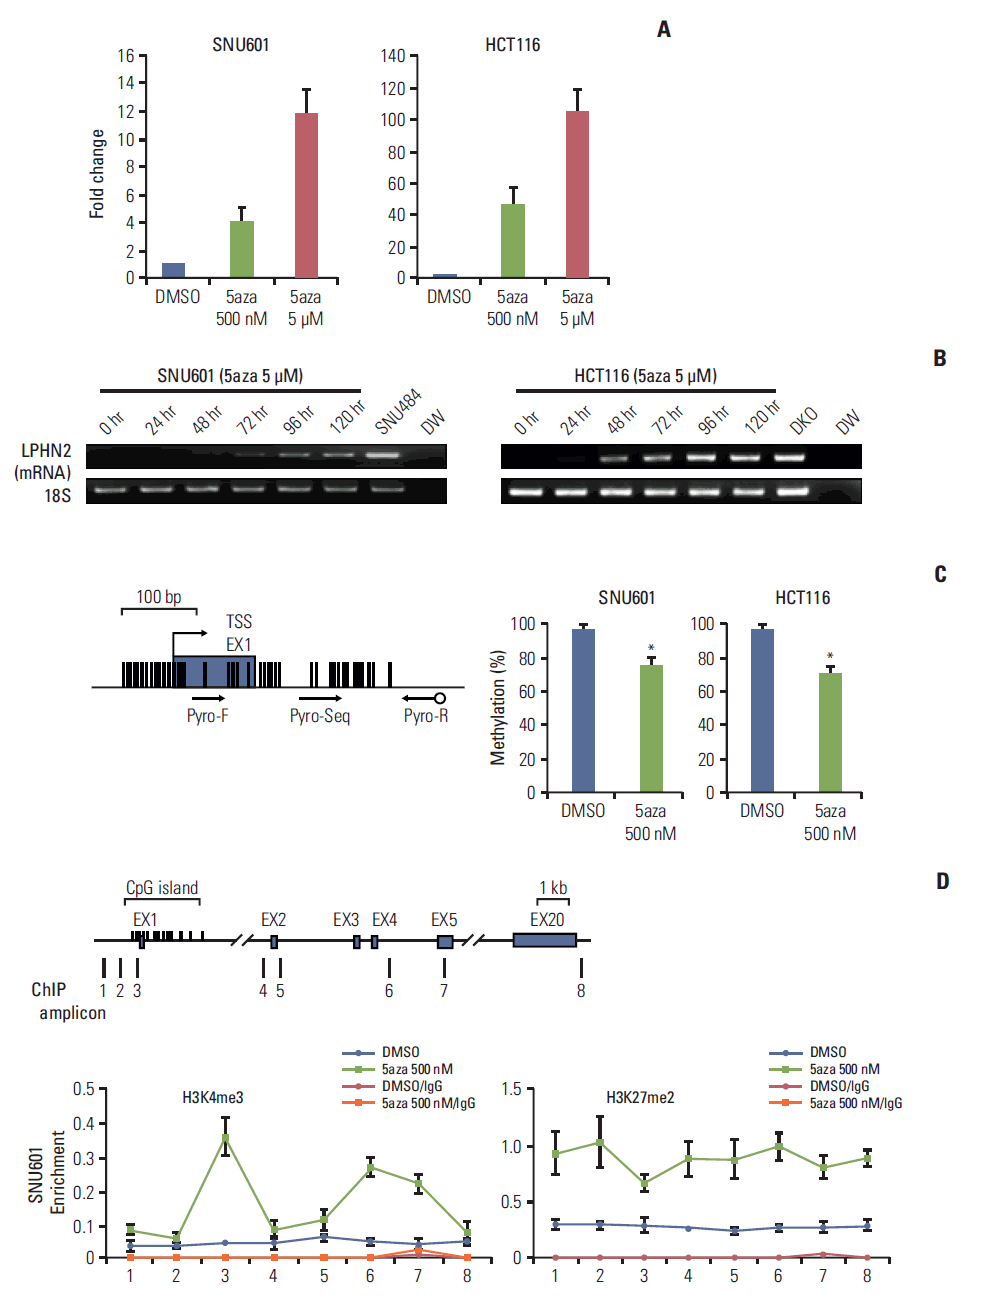 | Fig. 3.Restoration of LPHN2 expression after treatment with 5-aza-2'-deoxycytidine (5-Aza-CdR). (A) SNU601 and HCT116 cells were treated with dimethyl sulfoxide (DMSO) or 5-Aza-CdR for 4 days. LPHN2 mRNA expression was measured using quantitative real-time reverse transcription polymerase chain reaction (qRT-PCR). Each value was normalized to 18S ribosomal RNA. Error bars represent the standard deviation (SD) for three independent RNA preparations. (B) SNU601 and HCT116 cells were treated with 5 μM 5-Aza-CdR for 5 days. LPHN2 mRNA and 18S ribosomal RNA expression was analyzed by reverse transcription polymerase chain reaction at the indicated times. DW, distilled water. (C) After treatment with DMSO or 500 nM 5-Aza-CdR, the quantitative methylation status of LPHN2 in SNU601 and HCT116 cells was determined by pyrosequencing. The location of analyzed CpG sites corresponding to the pyrosequencing primer set is indicated by arrows. Error bars represent the SD for three independent preparations of bisulfite-treated gDNA. *p < 0.05 using Student’s t tests. (D) Dynamics of histone modifications after 5-Aza-CdR treatment in SNU601 cells. Chromatin was prepared from SNU601 cells treated with DMSO or 5-Aza-CdR (500 nM) for 4 days. Enrichment of the active histone mark (H3K4me3) and inactive histone mark (H3K27me2) was measured using qRT-PCR. Data are presented as the mean±standard error of the mean for three independent chromatin preparations. 5aza, 5-aza-2'-deoxycytidine. |
3. Methylation status and LPHN2 mRNA levels in primary gastric and colon tumor tissues
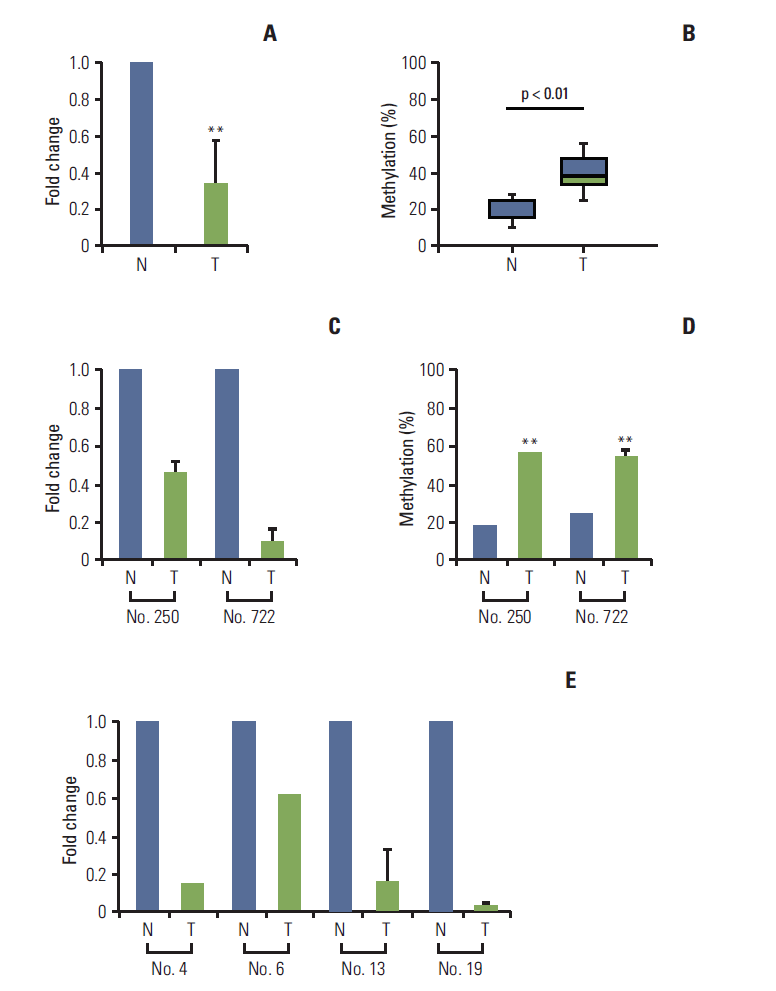 | Fig. 4.Loss of LPHN2 expression in human gastric and colon primary tissues. mRNA expression in primary gastric tissues was analyzed using quantitative real-time reverse transcription polymerase chain reaction (qRT-PCR) and the methylation status of LPHN2 was confirmed via pyrosequencing analyses. Loss of LPHN2 mRNA expression was shown in 18 of 24 primary gastric tissues. (A) A summary of LPHN2 expression in 18 primary gastric tissues compared with normal tissues presented as fold change of relative mRNA expression. (B) Among 18 primary gastric tissues, nine of 18 showed hypermethylation of LPHN2 CpG islands compared to normal control tissues. The methylation ratio percentage is also presented as a box plot. (C) LPHN2 expression levels in primary gastric tissues were analyzed using qRT-PCR. LPHN2 expression was normalized to 18S ribosomal RNA and is shown as fold change relative to their normal tissue samples. Data are expressed as the mean±standard deivation. (D) Bisulfite-treated gDNAs from patient No. 250 and No. 722 were used to determine the methylation status of the LPHN2 promoter region using pyrosequencing analyses. (E) LPHN2 expression levels in primary colon tissues were analyzed by qRT-PCR and are shown as fold change relative to their normal tissue samples. N, normal tissue; T, tumor tissue. **p < 0.01 using Student’s t test. |
4. Cancer cells with LPHN2 methylation exhibit higher sensitivity to cisplatin
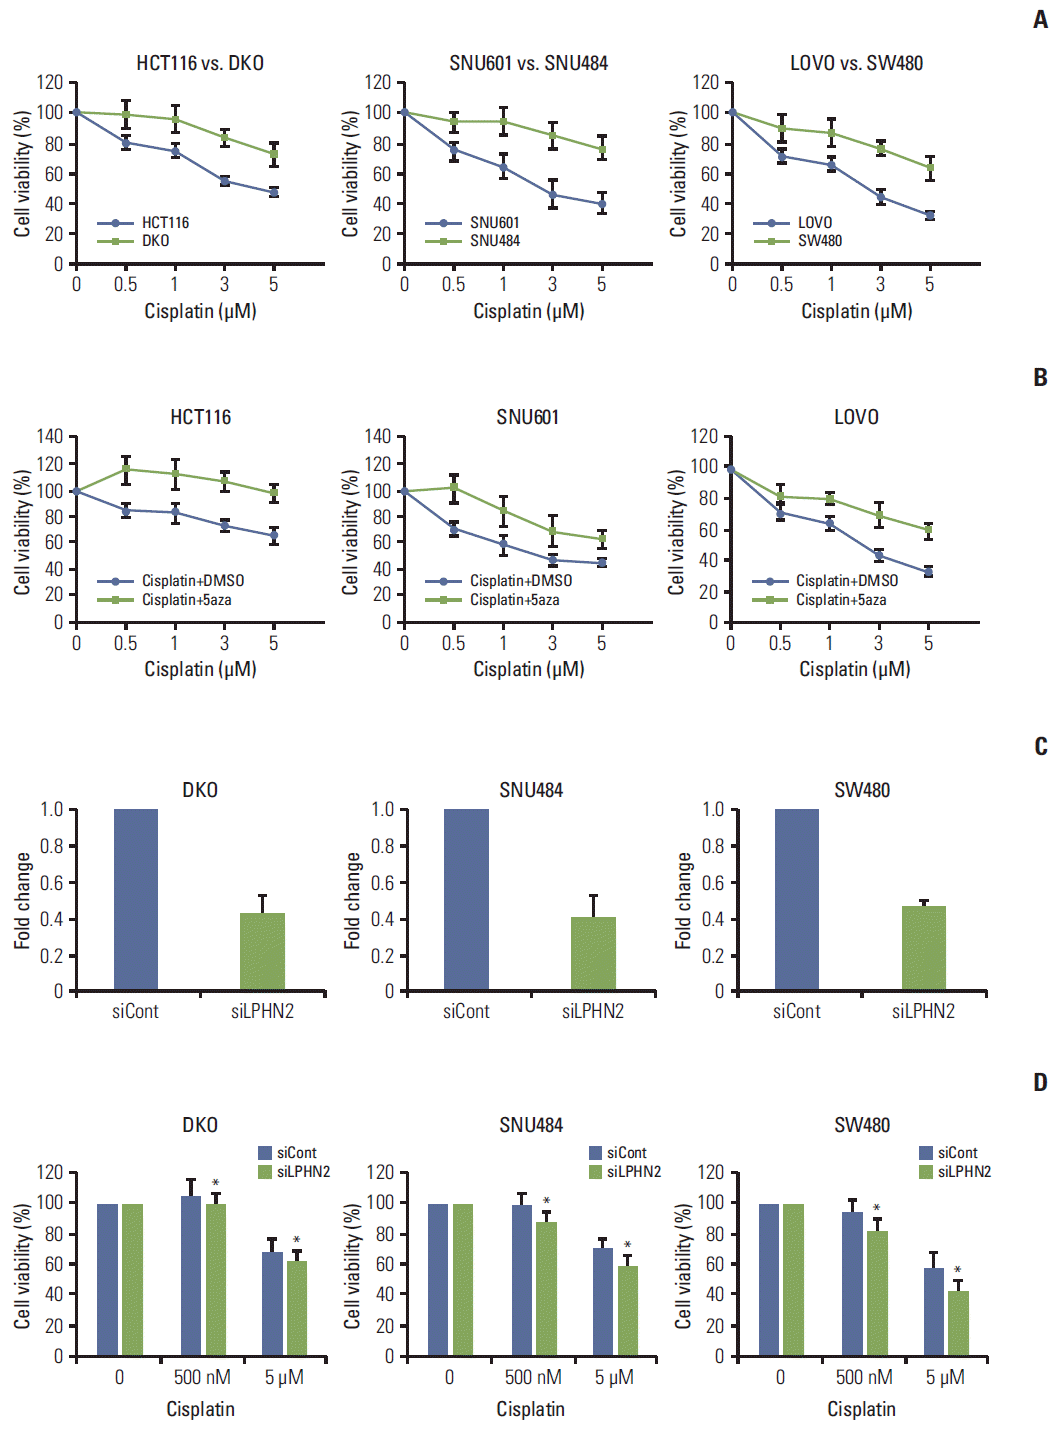 | Fig. 5.Methylation status of LPHN2 determines the differential response to cisplatin. (A) Cells were treated with increasing concentrations of cisplatin (0.5, 1, 3, or 5 μM) for 72 hours. Cell viability was confirmed using MTT assays. Cell viability is expressed as a percentage relative to untreated cells. Data represent the mean±standard deviation (SD) of three independent experiments. (B) Cells were treated with dimethyl sulfoxide or 500 nM 5-aza-2'-deoxycytidine in combination with different doses of cisplatin (0.5, 1, 3, or 5 μM). The number of viable cells was measured after 72 hours. Data are expressed as the mean±SD (n=3). (C, D) Cells were transfected with control or LPHN2-specific siRNAs for 8 hours. Cells were plated in 96-well plates, followed by cisplatin treatment (0.5 μM or 5 μM) for 72 hours. LPHN2 expression (C) and cell viability (D) were measured using quantitative real-time reverse transcription polymerase chain reaction and MTT assays, respectively. Error bars represent the SD (n=3, *p < 0.05). 5aza, 5-aza-2'-deoxycytidine. |


 PDF
PDF Citation
 Print
Print


 XML Download