Introduction
Materials and Methods
1. Patients
2. Immunohistochemistry
3. Statistical analysis
Results
1. Clinicopathological data
Table 1.
| Characteristic | No (%) |
DFS |
OS |
||
|---|---|---|---|---|---|
| HR | p-value | HR | p-value | ||
| Sex | |||||
| Male | 26 (38.2) | 1 | 1 | 0.881 | |
| Female | 42 (61.8) | 0.78 | 0.463 | 1.09 | |
| Age (yr) | |||||
| ≤ 45 | 17 (25.0) | 1 | 1 | 0.658 | |
| > 45 | 51 (75.0) | 1.55 | 0.251 | 1.30 | |
| Primary site | |||||
| Salivary gland | 36 (52.9) | 1 | 1 | ||
| Nasal cavity, paranasal sinus | 16 (23.5) | 2.34 | 0.022 | 1.61 | 0.420 |
| Tongue, oral cavity | 7 (10.3) | 2.01 | 0.146 | 0.81 | 0.841 |
| Lung, trachea | 4 (5.9) | 0.33 | 0.280 | 1.44 | 0.738 |
| Othersa) | 5 (7.4) | 1.00 | 0.995 | 1.01 | 0.994 |
| Local treatment | |||||
| Operation with PORT | 49 (72.1) | 0.96 | 0.919 | 2.16 | 0.311 |
| Operation without PORT | 19 (27.9) | 1 | 1 | ||
| Any chemotherapy | |||||
| Yes | 11 (16.2) | -b) | -b) | 2.32 | 0.116 |
| No | 57 (83.8) | - | 1 | ||
| Perineural invasion | |||||
| Yes | 23 (33.8) | 1.26 | 0.501 | 3.05 | 0.032 |
| No | 45 (66.2) | 1 | 1 | ||
| Resection margin | |||||
| Positive | 39 (57.4) | 0.97 | 0.913 | 1.49 | 0.456 |
| Negative | 29 (42.6) | 1 | 1 | ||
2. Immunohistochemical data
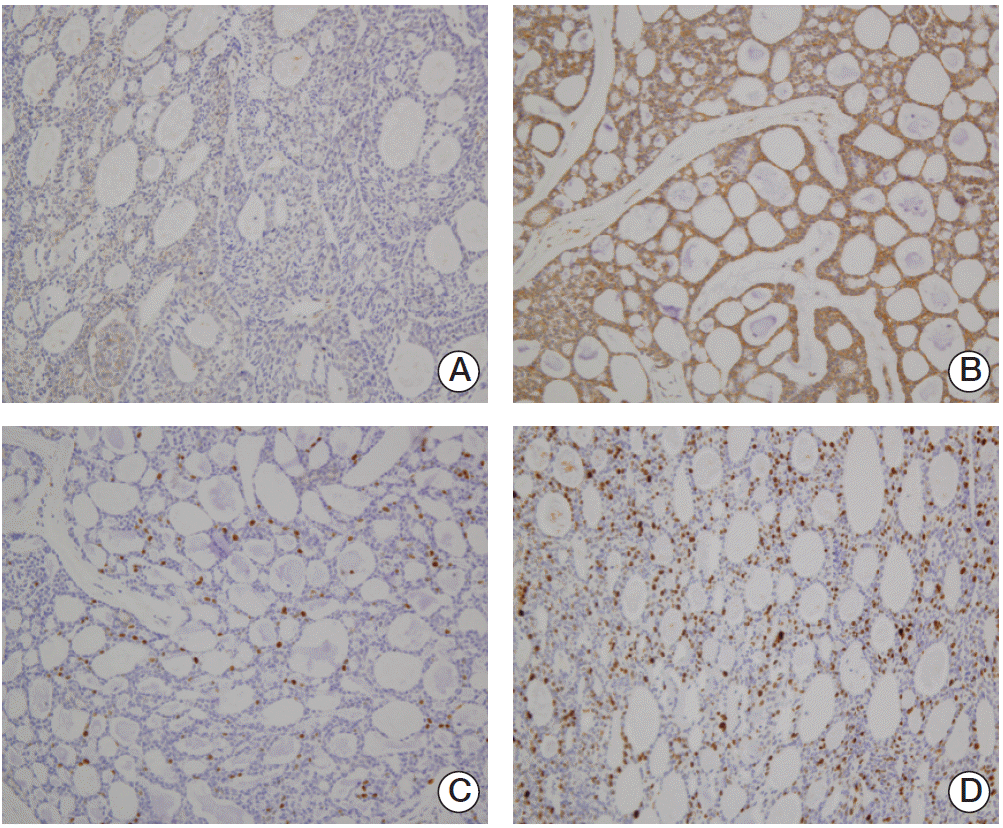
 | Fig. 1.Immunohistochemical staining of adenoid cystic carcinoma. (A) Low expression of vascular endothelial growth factor (VEGF). (B) High expression of VEGF. (C) Low expression of Ki-67. (D) High expression of Ki-67 (A-D, ×200). |
Table 2.
DFS, disease-free survival; OS, overall survival; HR, hazard ratio; CI, confidence interval; bFGF, basic fibroblast growth factor; FGFR2, fibroblast growth factor receptor 2; FGFR3, fibroblast growth factor receptor 3; MYB, Myb proto-oncogene protein; PDGFR-beta, platelet-derived growth factor receptor beta; VEGF, vascular endothelial growth factor.
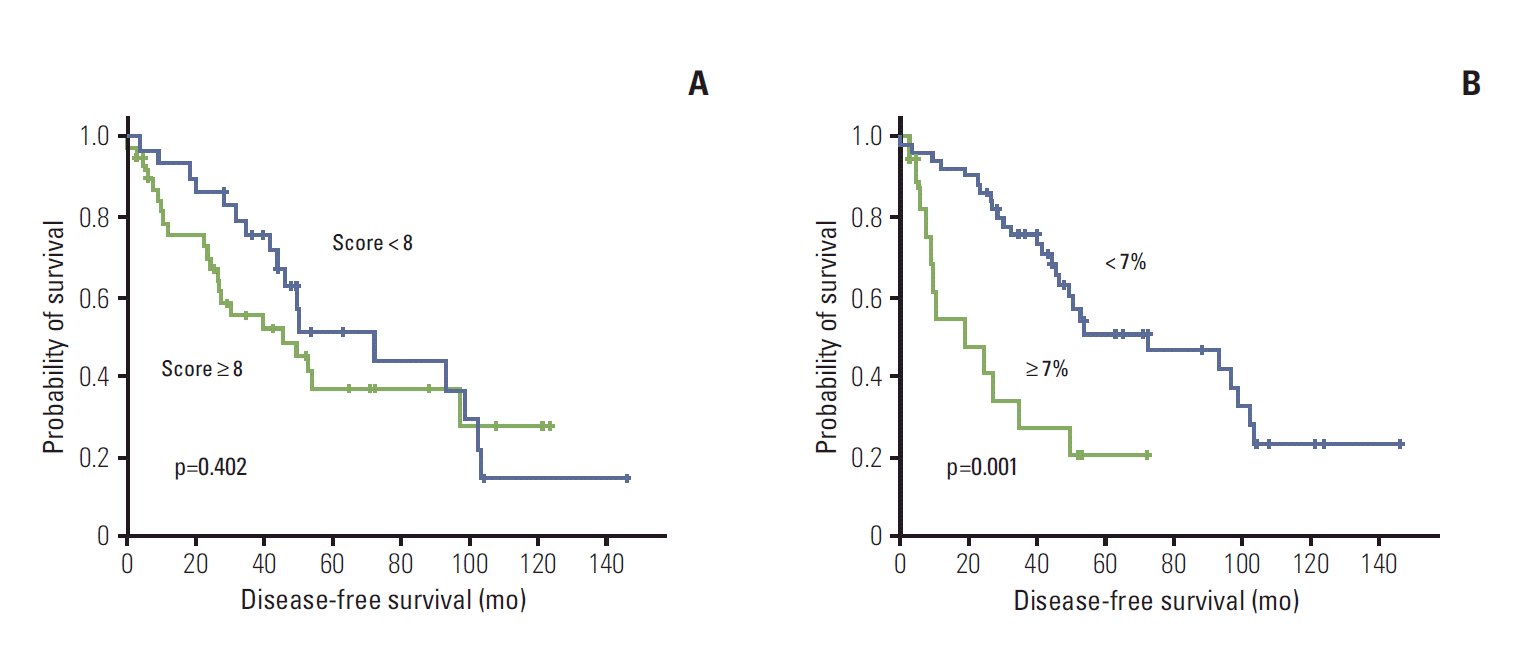
 | Fig. 2.Kaplan-Meier curve for disease-free survival by vascular endothelial growth factor expression (A) and Ki-67 expression (B). Comparisons were made using the log-rank test. |
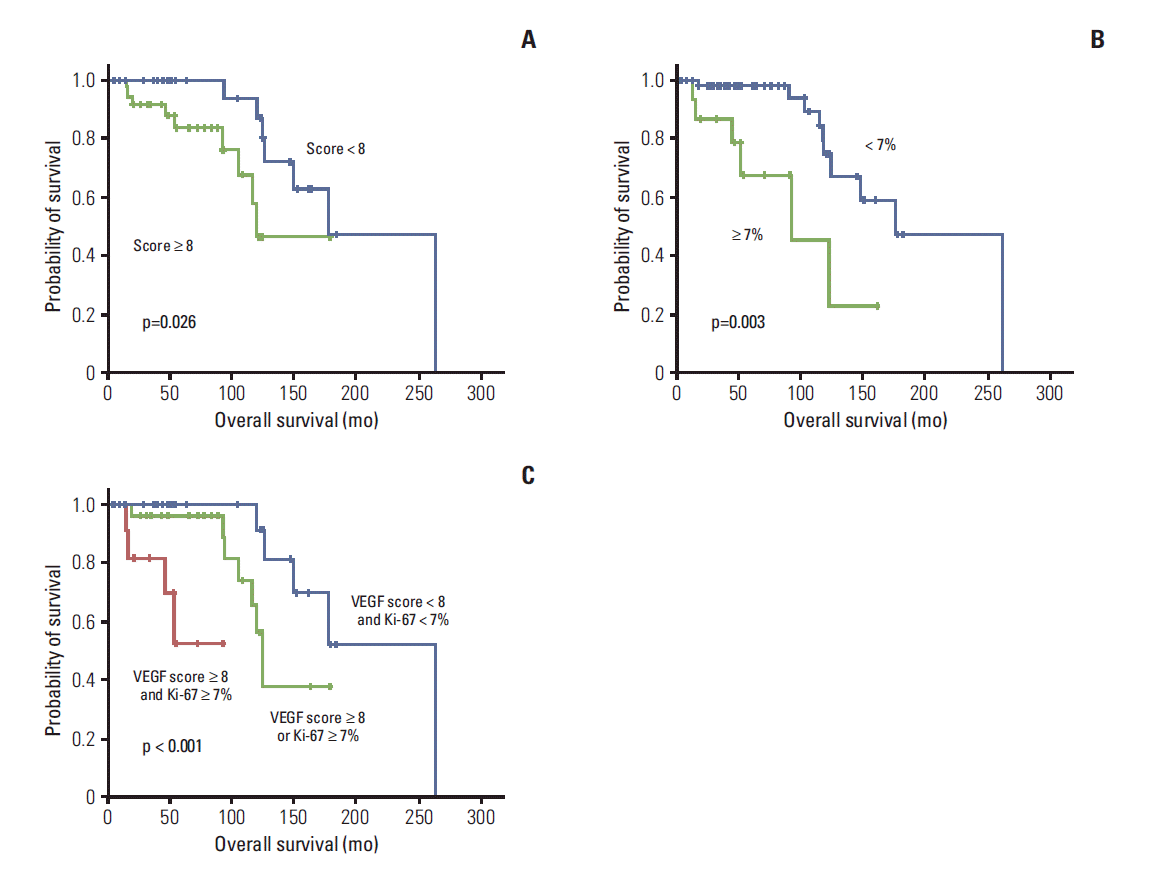
 | Fig. 3.Kaplan-Meier curve for overall survival by vascular endothelial growth factor (VEGF) expression (A), Ki-67 expression (B), and VEGF and/or Ki-67 expression (C). Comparisons were made using the log-rank test. |
Table 3.
DFS, disease-free survival; OS, overall survival; HR, hazard ratio; CI, confidence interval; bFGF, basic fibroblast growth factor; FGFR2, fibroblast growth factor receptor 2; FGFR3, fibroblast growth factor receptor 3; MYB, Myb proto-oncogene protein; PDGFR-beta, platelet-derived growth factor receptor beta; VEGF, vascular endothelial growth factor.
Table 4.
| Variable | Category | HR | 95% CI | p-value |
|---|---|---|---|---|
| DFS | ||||
| Nasal areaa) | No | 1 | ||
| Yes | 2.21 | 1.09 to 4.50 | 0.028 | |
| Perineural invasion | No | 1 | ||
| Yes | 1.29 | 0.65 to 2.55 | 0.460 | |
| Resection margin | No | 1 | ||
| Yes | 0.84 | 0.39 to 1.78 | 0.641 | |
| PORT | No | 1 | ||
| Yes | 1.09 | 0.47 to 2.52 | 0.837 | |
| VEGF | < 8 | 1 | ||
| ≥ 8 | 1.31 | 0.67 to 2.56 | 0.435 | |
| Ki-67 | < 7% | 1 | ||
| ≥ 7% | 3.05 | 1.43 to 6.54 | 0.004 | |
| OS | ||||
| Perineural invasion | No | 1 | ||
| Yes | 2.90 | 1.00 to 8.41 | 0.051 | |
| VEGF | < 8 | 1 | ||
| ≥ 8 | 5.44 | 1.48 to 19.98 | 0.011 | |
| Ki-67 | < 7% | 1 | ||
| ≥ 7% | 4.83 | 1.44 to 16.21 | 0.011 |


 PDF
PDF Citation
 Print
Print


 XML Download