Journal List > Cancer Res Treat > v.48(2) > 1153319

Im, Seong, Lee, Park, Yoon, Kim, Lee, and Park: Surgery Alone Versus Surgery Followed by Chemotherapy and Radiotherapy in Resected Extrahepatic Bile Duct Cancer: Treatment Outcome Analysis of 336 Patients

Abstract

Purpose

This study analyzed the outcomes of patients with resected extrahepatic bile duct cancer (EHBDC) in order to clarify the role of adjuvant treatments in these patients.

Materials and Methods

A total of 336 patients with EHBDC who underwent curative resection between 2001 and 2010 were analyzed retrospectively. The treatment types were as follows: surgery alone (n=168), surgery with chemotherapy (CTx, n=90), surgery with radiotherapy (RT) alone (n=29), and surgery with chemoradiotherapy (CRT, n=49).

Results

The median follow-up period was 63 months. The 5-year rates of locoregional failure-free survival (LRFFS), distant metastasis-free survival (DMFS), progression-free survival (PFS), and overall survival (OS) for all patients were 56.5%, 59.7%, 36.6%, and 42.0%, respectively. In multivariate analysis, surgery with RT and CRT was a significant prognostic factor for LRFFS, and surgery with CTx was a significant prognostic factor for DMFS, and surgery with CTx, RT, and CRT was a significant prognostic factor for PFS (p < 0.05). Surgery with CTx and CRT showed association with superior OS (p < 0.05), and surgery with RT had marginal significance (p=0.078). In multivariate analysis of the R1 resection patients, surgery with CRT showed significant association with OS (p < 0.05).

Conclusion

Adjuvant RT and CTx may be helpful in improving clinical outcomes of patients with resected EHBDC who have a high risk of disease recurrence, particularly R1 resection patients. Conduct of additional prospective, larger-scale studies will be required in order to confirm the benefit of adjuvant RT and CTx in these patients.

Introduction

Complete surgical resection is considered the only curative modality for extrahepatic bile duct cancer (EHBDC) [1]. The prognosis after curative resection without adjuvant treatment is poor, with a reported 5-year survival rate of 12%-54%, despite aggressive surgical procedures such as major hepatectomy, pancreatoduodenectomy (Whipple’s procedure), and extensive lymphadenectomy [1-3]. Treatment failures included locoregional failures or distant relapses or both, and adjuvant radiotherapy (RT) and chemotherapy (CTx) are considered to increase the rate of survival by improving locoregional disease and systemic control.
Due to its rarity, conduct of randomized controlled trials for EHBDC is difficult [1,4]. Few randomized controlled trials evaluating adjuvant treatment have been reported, and most reports are retrospective analyses. Therefore, the role of adjuvant therapy in resected EHBDC remains controversial. Several reports suggested that adjuvant RT improved survival [3,5-9]; however, others suggested that adjuvant RT had no effect on survival [10,11]. Currently, there is no consensus regarding patient selection for adjuvant RT and/or CTx.
The aim of the current study was to clarify the role of adjuvant treatment for patients with resected EHBDC by analyzing treatment outcomes, including overall survival (OS) and identifying patterns of treatment failure, and prognostic factors.

Materials and Methods

1. Study design and patients

We conducted a retrospective review of the medical records of 382 patients with EHBDC adenocarcinoma who underwent curative surgical resection between January 2001 and December 2010 at Severance Hospital or Gangnam Severance Hospital in Seoul, Korea. The inclusion criteria were pathologically proven adenocarcinoma of EHBDC, no distant metastasis, and an Eastern Cooperative Oncology Group performance status of ≤ 2. Patients with carcinoma of the intrahepatic bile duct, gallbladder, or ampulla of Vater were excluded from the study. Patients who experienced in-hospital death (n=24), were lost to follow up after discharge (n=13), and those with other concurrent malignancy (n=9) were also excluded. Data from the remaining 336 patients were analyzed retrospectively.
Disease stage was defined according to the sixth edition of the American Joint Committee on Cancer (AJCC) system. Among the perihilar bile duct cancer patients, N2 patients were not included in this study, according to the AJCC seventh edition. Tumor location was recorded as the perihilar or distal bile duct. A perihilar duct tumor was defined anatomically as being located in the extrahepatic biliary tree proximal to the origin of the cystic duct. A distal bile duct tumor was a tumor involving the common bile duct.
The routine procedure for patient evaluation included a detailed history, physical examination, complete blood count, liver function testing, carbohydrate antigen 19-9 (CA19-9) and carcinoembryonic antigen (CEA) levels, standard chest radiographs, endoscopic retrograde cholangiography or magnetic resonance cholangiopancreatography, abdominal and pelvic computed tomography (CT), and magnetic resonance imaging (MRI) and/or positron emission tomography–computed tomography (PET-CT). Biliary drainage was performed in patients with hyperbilirubinemia (total bilirubin > 2 mg/dL) or cholangitis symptoms caused by impending obstructive jaundice (i.e., fever, leukocytosis, and abdominal pain).
Surgical resection procedures depended on primary tumor location. Combined hepatic and hilar resection was performed for perihilar bile duct tumors and pylorus-preserving pancreatoduodenectomy for distal bile duct tumors. Bile duct resection alone was performed in patients with limited tumor extent, old age, comorbidity, or poor liver function. All patients underwent lymph node (LN) dissection, and 18 median LNs were removed.
All patients were followed-up at 1-month post-surgery and then every 3-6 months. Patients were screened for CA19-9, CEA, and underwent a biliary CT scan. When recurrent disease was suspected, a MRI or PET-CT was performed for confirmation. Recurrence was also confirmed pathologically by biopsy, cytology, and/or radiological findings.

2. Adjuvant treatment

Adjuvant treatment was determined according to the physician’s discretion. Adjuvant CTx alone, adjuvant RT alone, or adjuvant concurrent chemoradiotherapy (CRT) was administered according to the physician’s preference.
The chemotherapeutic regimen was determined based on the experience with various regimens at our institution. A median of six cycles of 5-fluorouracil (5-FU) with cisplatin (FP)–based or gemcitabine-based CTx was administered to patients with adjuvant CTx alone. FP consisted of 5-FU administered at a dose of 1,000 mg/m2/day on days 1-3 and cisplatin 70 mg/m2/day administered on day 1 every 4 weeks. Gemcitabine was administered at 1,000 mg/m2 weekly.
Details of the patient profile for adjuvant RT have been described previously [12]. All patients underwent three-dimensional conformal RT, which was initiated 4-6 weeks (median, 42 days) after resection. The clinical target volume included the primary tumor bed with a 1- to 2-cm margin and the regional lymphatics. The planning target volume included the clinical target volume and a uniform 0.5-cm margin. RT treated multiple fields using megavoltage photon beams (6 or 10 MV) at 1.8 Gy daily for 5 days/wk. All treatment plans were determined individually, considering the planning target volume and organs-at-risk (e.g., duodenum, liver, and kidney). The median radiation dose was 50.4 Gy (range, 41.4 to 54 Gy).
During RT, concomitant CTx was administered to patients with CRT. Concomitant 5-FU–based or gemcitabine-based CTx was administered according to the physician’s preference. Two cycles of 5-FU (1,000 mg/m2/day) and leucovorin (20 mg/m2/day) were administered for 3 days in the first and last week of RT. Gemcitabine was administered at 1,000 mg/m2/wk during RT.

3. Statistical analyses

Survival was calculated from the date of surgical resection. All events were measured from the date of surgery to the date of recurrence. Locoregional recurrence was defined as recurrence in the primary tumor bed and regional lymphatic areas. Distant metastasis was defined as recurrence in a systemic organ, the peritoneum, or distant LNs. Progression-free survival (PFS) was the time from the date of surgical resection until the first reported recurrence, or death. OS was calculated from the date of surgical resection to the date of death or the date of the last follow-up visit.
A chi-square test or Fisher exact test was used for comparison of categorical variables between groups. Survival rates were calculated using Kaplan-Meier methods and compared using the log-rank test. Multivariate analysis was performed using a Cox proportional hazards model and hazard ratio with a 95% confidence interval for determination of prognostic factors. Criteria for inclusion of variables in a multivariate analysis included statistical significance in univariate analysis and clinical relevance. A p-value of < 0.05 indicated statistical significance.

Results

1. Patient characteristics

The characteristics of the 336 patients are summarized in Table 1. Enrollment included 243 patients (72.3%) from Severance Hospital and 93 patients (27.7%) from Gangnam Severance Hospital. The median age was 64 years old (range, 32 to 90 years). The primary tumor location was the distal bile duct in 227 patients and perihilar in 109 patients. Seventy-eight patients underwent bile duct resection alone, 165 underwent pylorus-preserving pancreatoduodenectomy, and 93 underwent bile duct resection with liver resection. R0 resection was achieved in 251 patients (74.7%); R1 resection, in 67 patients (19.9%); and R2 resection, in 18 patients (5.4%). Regional LN metastasis was found after LN dissection in 127 patients (37.8%). The patients were divided into four groups according to the treatment types as follows: patients who underwent surgery alone without adjuvant treatment (surgery alone, n=168), surgery followed by adjuvant CTx alone (surgery with CTx, n=90), surgery followed by adjuvant RT alone (surgery with RT, n=29), and surgery followed by adjuvant CRT (surgery with CRT, n=49).
A comparison of the clinicopathological parameters according to treatment type is provided in Table 1. In surgery with CRT bile duct resection was performed more frequently, and R1 and R2 resection were more frequent in the surgery with RT and CRT. Lymphovascular invasion and advanced stage LN positive cancers were more frequent in the surgery with CTx group compared with the other groups. Positive perineural invasion (PNI) was more frequent in the surgery with CTx, RT, and surgery with CRT groups compared with the surgery alone group II. The highest number of stage IIA patients underwent surgery alone, while the highest number of stage IIB patients underwent surgery with CTx. Other clinicopathological characteristics were not significantly different between the treatment groups.

2. Survival

The median follow-up period was 63 months (range, 3 to 155 months). Of the 336 patients, 137 (40.8%) survived at least until the end of the follow-up period. The median OS was 46 months. The 5-year locoregional failure-free survival (LRFFS), distant metastasis-free survival (DMFS), PFS, and OS rates were 56.5%, 59.7%, 36.6%, and 42.0%, respectively.

3. Prognostic factors

Results of univariate analysis are summarized in Table 2, which showed that preoperative and postoperative CA19-9 level, resection margin, histological grade, PNI, nodal status, and overall stage were prognostic factors for LRFFS, DMFS, PFS, and OS (p < 0.05). Tumor location, lymphovascular invasion, and T stage showed significant association with DMFS, PFS, and OS (p < 0.05).
Results of multivariate analysis are summarized in Table 3. In multivariate analysis, postoperative CA19-9 level of at least 37 U/mL, histological grade, and nodal status showed significant association with LRFFS, DMFS, PFS, and OS (p < 0.05). Preoperative CA19-9 level of at least 37 U/mL showed significant association with DMFS, PFS, and OS (p < 0.05). R2 resection was a significant prognostic factor for LRFFS, PFS, and OS (p < 0.05), and R1 resection showed significant association with OS (p < 0.05). Lymphovascular invasion showed significant association with DMFS and PFS. Surgery with CTx was a significant prognostic factor for DMFS, PFS, and OS, and surgery with RT was a significant prognostic factor for LRFFS and PFS (p < 0.05). Surgery with CRT showed significant association with LRFFS, PFS, and OS (p < 0.05). Surgery with RT showed a marginal association with OS (p=0.078), and surgery with CRT showed correlation with superior systemic control with marginal significance (p = 0.078).

4. Patterns of failure

The site of recurrence was evaluated in all patients over the entire follow-up period (Table 4). Locoregional failure occurred in 149 patients (44.3%) and distant metastasis occurred in 162 patients (48.2%), of whom 103 had both locoregional recurrence and distant metastasis. Locoregional recurrence was the first event in 131 patients (39.0%) and distant relapse occurred first in 121 patients (36.0%). The liver was the most common site of primary metastatic recurrence (61 patients). Distant failures occurred first at the peritoneal cavity in 46 patients.
Patterns of failure were also analyzed in terms of the treatment type. In the first and cumulative recurrence, surgery with RT and CRT reduced the locoregional recurrence rate with greater marginal significance than surgery alone and surgery with CTx. In the first recurrence, the distant failure rate of surgery with CTx and CRT was similar to that of surgery alone, but showed reduced systemic progression with marginal significance compared to surgery with RT (p=0.058). The cumulative incidence of distant failure was similar between all groups regardless of treatment type. In patients with perihilar bile duct cancers, surgery with RT and CRT reduced locoregional failure (p < 0.05).

5. Subgroup analysis of the R1 resection patients

The first site of relapse was evaluated in R1 resection patients (Table 4). Locoregional failure occurred in 25 patients (37.3%) and distant metastasis in 30 patients (44.8%). Surgery with RT and CRT reduced the locoregional failure rate compared with surgery alone and surgery with CTx (p < 0.05), and surgery with CTx and CRT reduced the distant recurrence rate compared with surgery alone and surgery with RT (p < 0.05).
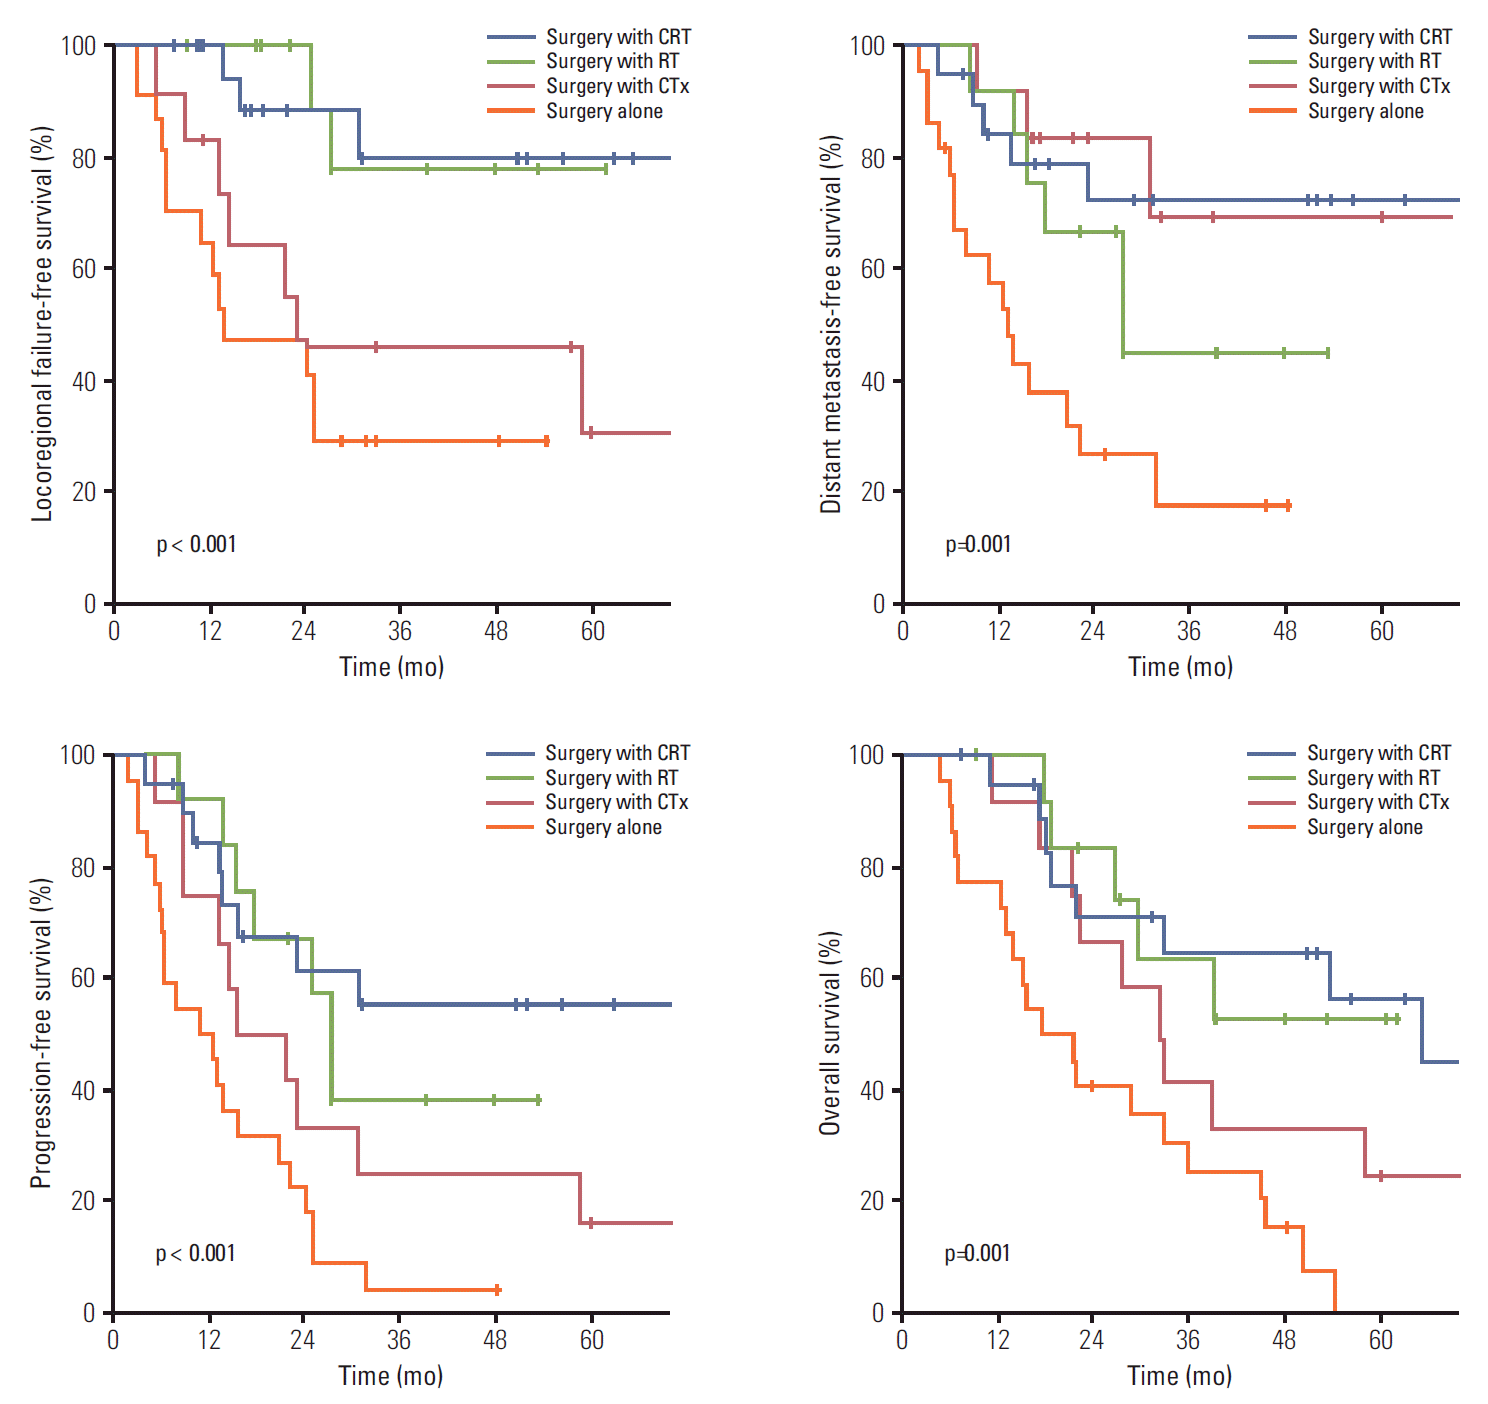
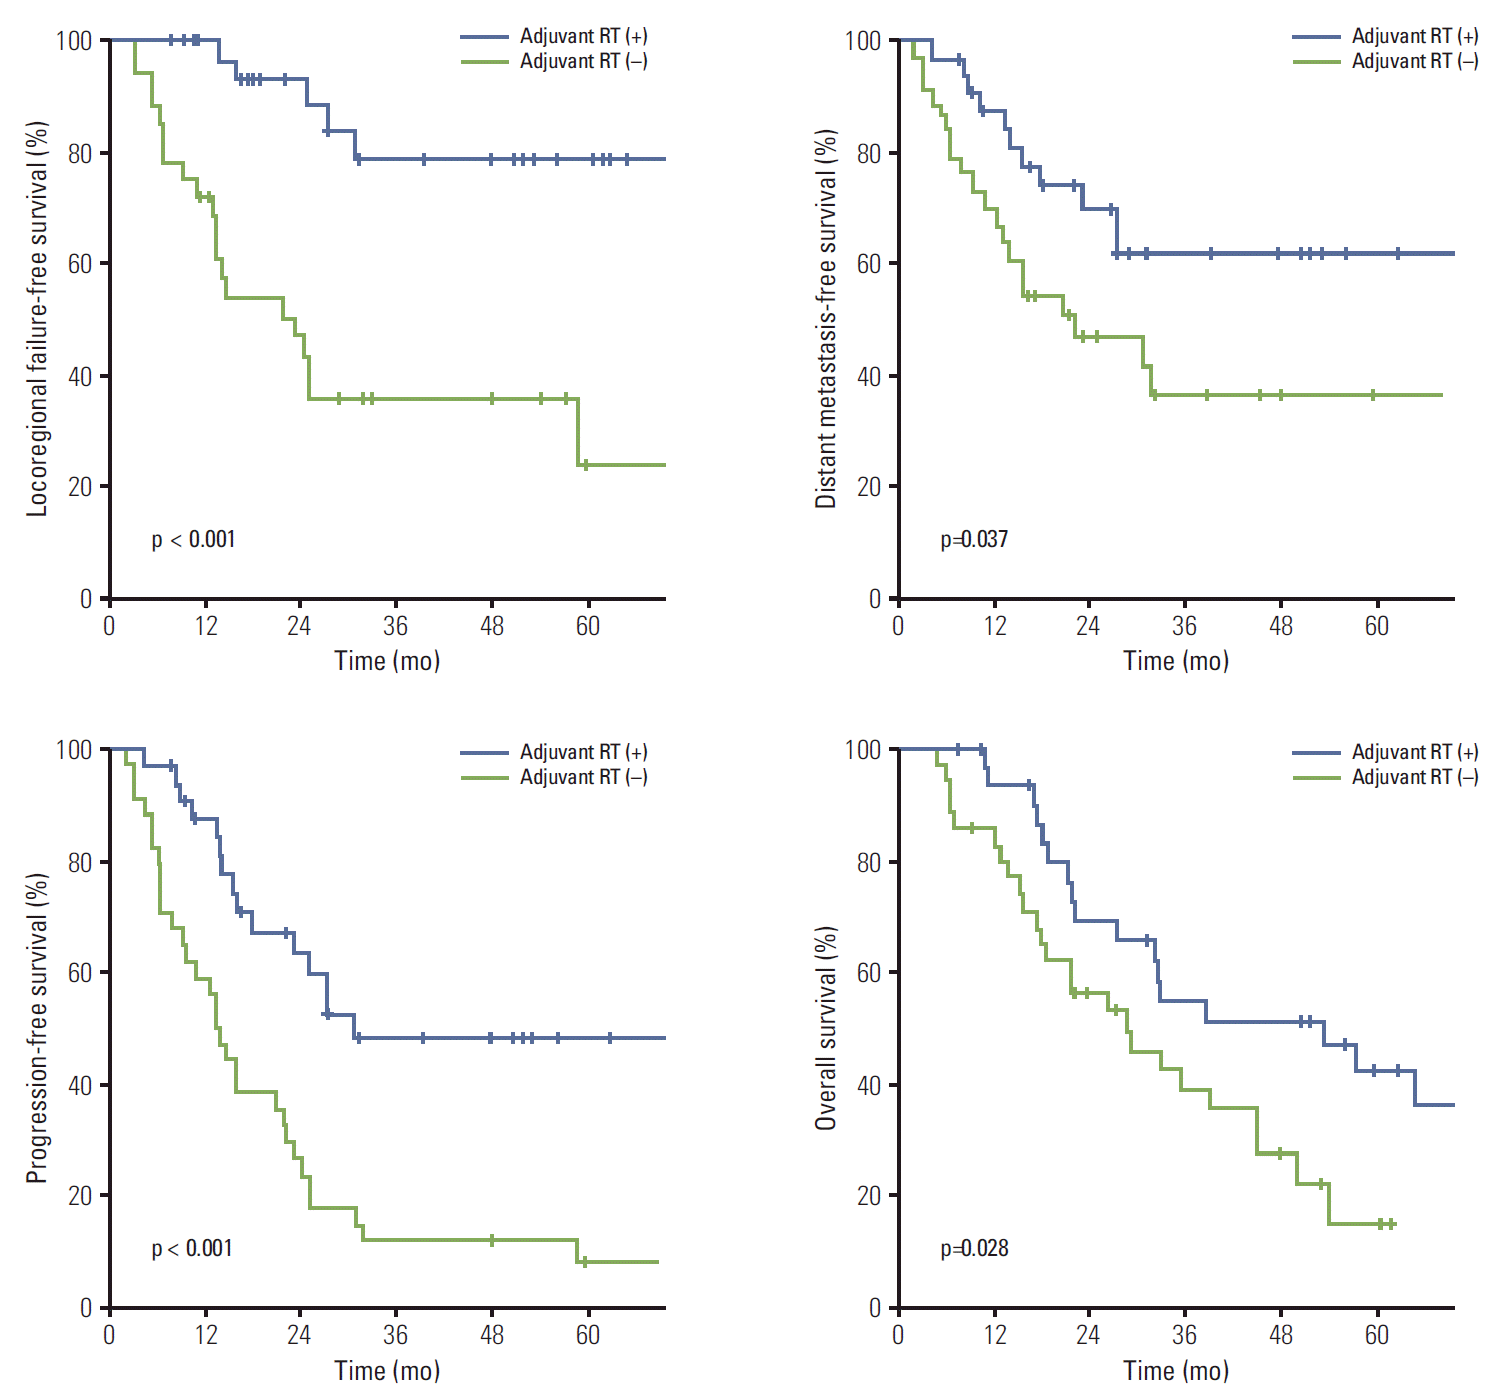
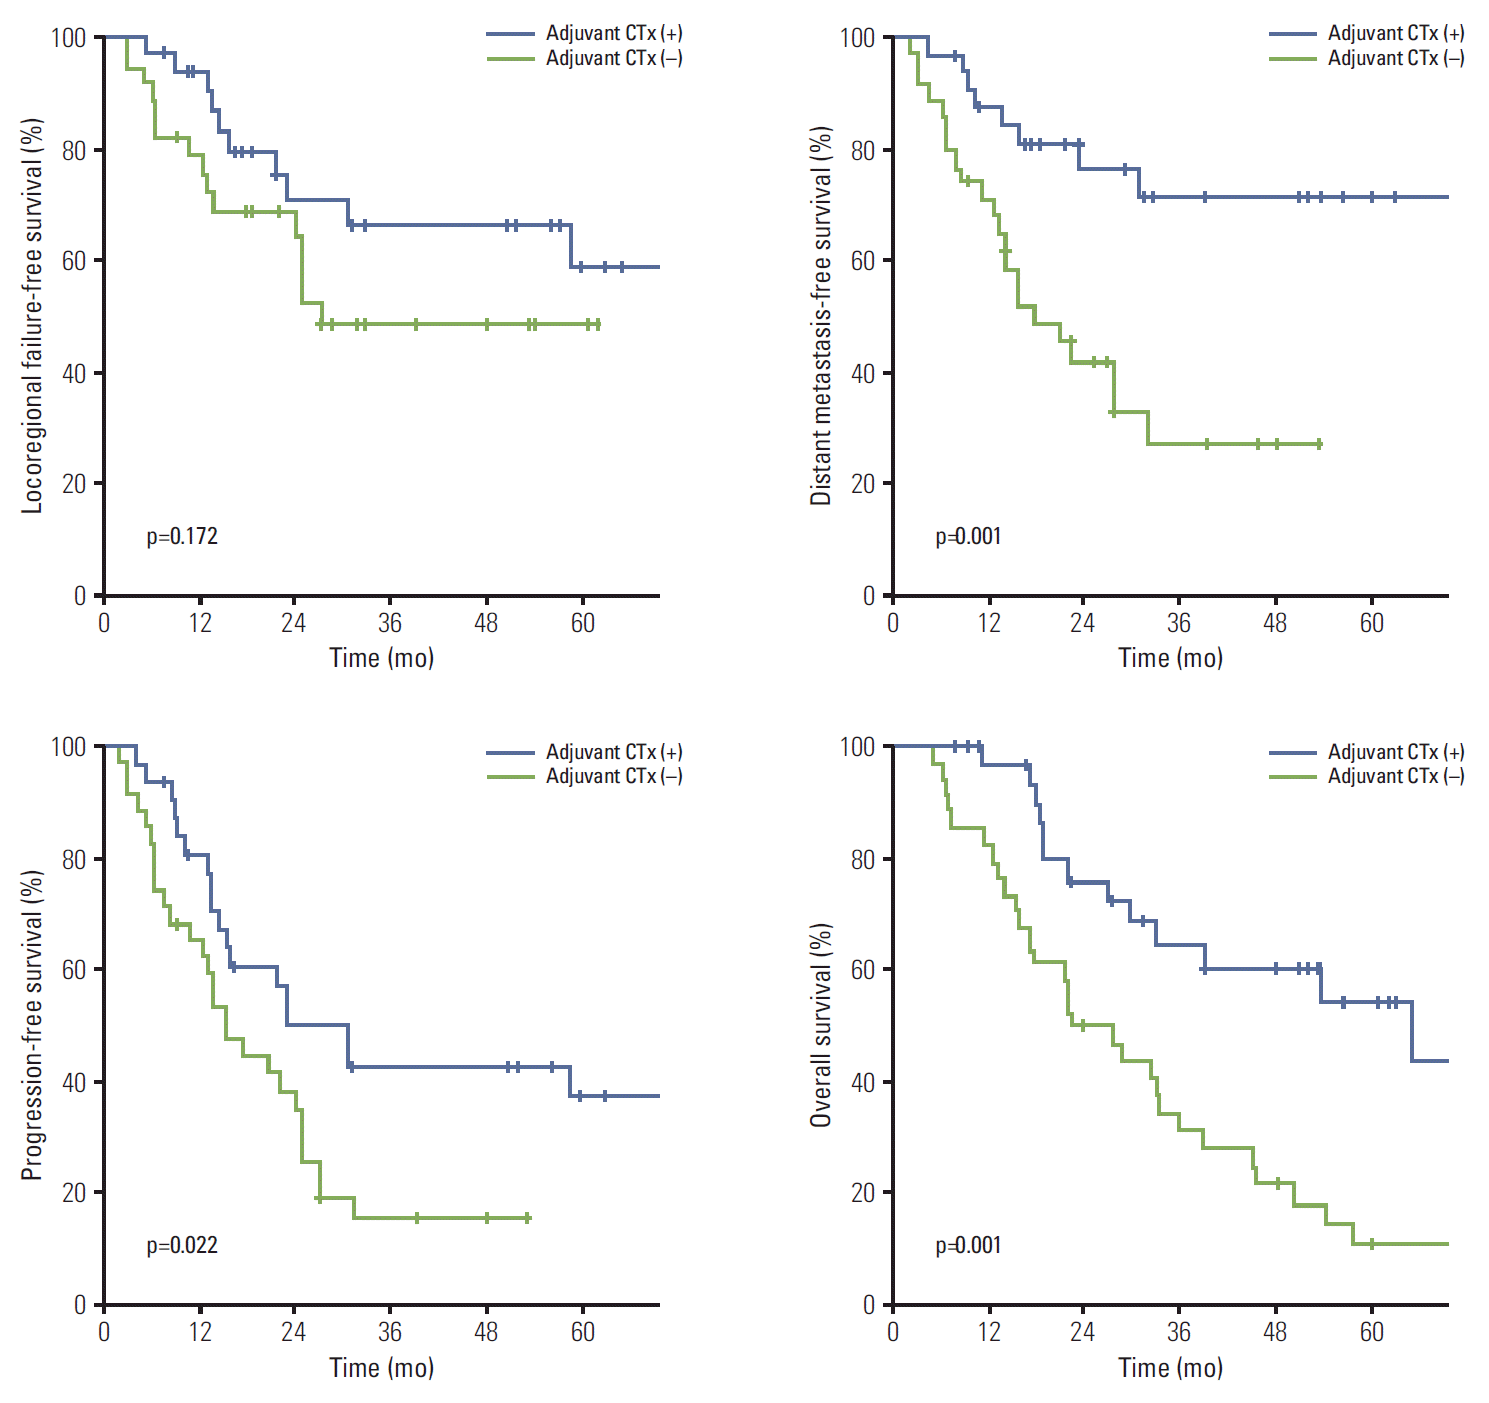
In the univariate analysis, LRFFS, DMFS, PFS, and OS differed according to treatment types (Figs. 1-3). In multivariate analysis, surgery with RT and CRT showed significant association with improved LRFFS and surgery with CTx and CRT showed significant association with lengthened DMFS (p < 0.05) (Table 5). Surgery with CRT was the significant factor for OS (p < 0.05).

Discussion

A total of 336 patients with EHBDC who underwent curative resection were analyzed retrospectively. Although treatment type was not a significant factor for PFS and OS in univariate analysis, in multivariate analysis, surgery with CTx had a significant positive impact on DMFS, PFS, and OS, and surgery with CRT prolonged LRFFS, PFS, and OS. Although the benefit of OS had borderline significance, surgery with RT had LRFFS and PFS benefits. In the subgroup analyses of the R1 resection patients, the OS rates improved significantly in the surgery with CRT group compared with that in the other groups, suggesting that CRT has a greater clinical benefit for these patients than for the other groups.
Patients with EHBDC who undergo curative resection alone with 5-year OS rates < 55% have poor prognosis [1-3]. The locoregional recurrence and distant metastasis rates for resected EHBDC have been reported as 38%-55% and 23%-45% [3,13-15], similar to those reported here. With such high rates after curative resection, adjuvant local and systemic treatment should be considered in patients with EHBDC. Our findings showed that adjuvants RT and/or CTx could reduce the high incidence of recurrence and improve survival rates, especially for patients with R1 resection. Therefore, patients with resected EHBDC with a high risk of locoregional recurrence or distant metastasis, including R1 resection, would benefit from adjuvant treatment.
Locoregional recurrence can cause bile duct obstruction, hepatic failure, recurrent sepsis, and subsequent mortality. Despite conflicting results on the utility of adjuvant RT in patients with EHBDC, several retrospective studies have suggested an improvement in locoregional control and survival [3,5-9]. In the current study, in patients undergoing adjuvant RT or CRT, the first recurrence event was locoregional in eight patients (27.6%) and 14 patients (28.6%), respectively, similar to that reported in other studies (17%-24%) [3,5,7,8,16,17]. The current study found that LRFFS and OS rates in the surgery with CRT group were significantly better than those in the surgery alone group, suggesting that adjuvant RT may increase OS by improving locoregional disease control.
To date a substantial survival benefit of CTx in patients with resected cholangiocarcinoma has not been demonstrated [1]. However, in a randomized trial conducted by Takada et al. [18], patients who received CTx following curative resection tended to have better OS rates than patients who did not receive CTx (41% vs. 28%), although the difference was not significant. In addition, Murakami et al. [2] found that adjuvant CTx might improve the OS of patients with extrahepatic cholangiocarcinoma with PNI. Lim et al. [19] found that adjuvant CRT followed by adjuvant CTx prolonged OS compared with CRT alone in patients with curatively resected EHBDC. These results suggested that adjuvant CTx might have partial benefit in treatment of EHBDC by controlling microscopic residual tumor growth.
One limitation of this research is that when adjuvant treatment was administered, it could not be confirmed which treatment, among adjuvant CTx, adjuvant RT, and adjuvant CRT, had a greater benefit. In the case of adjuvant RT, there were only 29 patients, thus the interpretation of the results was limited; however, although adjuvant RT reduced the locoregional recurrence, the distant relapse rate showed a relatively increase, thus it is considered to have shown marginal significance in OS benefit. In the case of adjuvant CTx, the locoregional relapse was higher than in adjuvant RT or CRT. It is interpreted that this eventually caused distant failure, so that the cumulative distant recurrence rate became similar to that of the other treatment groups. Although the evidence presented herein was insufficient, simultaneous performance of adjuvant RT and CT is considered capable of also simultaneously reducing locoregional relapse and systemic failure. Particularly in the case of the patient who underwent R1 resection, adjuvant CRT actually caused simultaneous reduction of the locoregional relapse and the systemic recurrence. Accordingly, simultaneous adjuvant RT and CTx could have a benefit in slowing disease progression.
The completeness of surgical resection and whether or not regional LN metastasis is present are the most important prognostic factors for determining survival in patients undergoing curative resection [2,3,6-8,13,14,16]. Likewise, we also found that resection margin and N stage were significant prognostic factors for OS. In the current and other studies higher T stage, poorly differentiated tumor, lymphovascular invasion positive, PNI positivity, and pre and postoperative CA19-9 level of at least 37 U/mL have been identified as prognostic factors [2,3,8,12-15,17]. Adjuvant RT and/or CTx seems to improve the outcome of patients with one or many of these risk factors.
There are some limitations to our study. The study was nonrandomized and retrospective in nature, and unrecognized biases could not be considered. Prognostic factors, such as stage and resection margin, did not show equal distribution between the treatment groups. The selection of treatment methods was based on physician decision. The RT volume and radiation dose, and the CTx regimen were also determined according to the physician’s preference. Therefore, heterogeneous treatments might be a confounding factor.

Conclusion

Adjuvant treatments were important prognostic factors after curative resection of EHBDC. Adjuvant RT and CTx may reduce locoregional recurrence and distant metastasis, consequently improving survival. Therefore, we recommend adjuvant RT and CTx for patients with EHBDC at high risk for recurrence. However, further randomized prospective studies are needed to clarify the role of adjuvant treatment in patients with EHBDC treated with curative resection.

Notes

Conflict of interest relevant to this article was not reported.

ACKNOWLEDGMENTS

This work was supported by a faculty research grant of Yonsei University College of Medicine for 2015 (6-2015-0039).

References

1. Khan SA, Thomas HC, Davidson BR, Taylor-Robinson SD. Cholangiocarcinoma. Lancet. 2005; 366:1303–14.
crossref
2. Murakami Y, Uemura K, Sudo T, Hashimoto Y, Kondo N, Nakagawa N, et al. Perineural invasion in extrahepatic cholangiocarcinoma: prognostic impact and treatment strategies. J Gastrointest Surg. 2013; 17:1429–39.
crossref
3. Gwak HK, Kim WC, Kim HJ, Park JH. Extrahepatic bile duct cancers: surgery alone versus surgery plus postoperative radiation therapy. Int J Radiat Oncol Biol Phys. 2010; 78:194–8.
crossref
4. Jung KW, Won YJ, Kong HJ, Oh CM, Seo HG, Lee JS. Cancer statistics in Korea: incidence, mortality, survival and prevalence in 2010. Cancer Res Treat. 2013; 45:1–14.
crossref
5. Todoroki T, Ohara K, Kawamoto T, Koike N, Yoshida S, Kashiwagi H, et al. Benefits of adjuvant radiotherapy after radical resection of locally advanced main hepatic duct carcinoma. Int J Radiat Oncol Biol Phys. 2000; 46:581–7.
crossref
6. Todoroki T, Kawamoto T, Koike N, Fukao K, Shoda J, Takahashi H. Treatment strategy for patients with middle and lower third bile duct cancer. Br J Surg. 2001; 88:364–70.
crossref
7. Borghero Y, Crane CH, Szklaruk J, Oyarzo M, Curley S, Pisters PW, et al. Extrahepatic bile duct adenocarcinoma: patients at high-risk for local recurrence treated with surgery and adjuvant chemoradiation have an equivalent overall survival to patients with standard-risk treated with surgery alone. Ann Surg Oncol. 2008; 15:3147–56.
crossref
8. Kim TH, Han SS, Park SJ, Lee WJ, Woo SM, Moon SH, et al. Role of adjuvant chemoradiotherapy for resected extrahepatic biliary tract cancer. Int J Radiat Oncol Biol Phys. 2011; 81:e853–9.
crossref
9. Fuller CD, Wang SJ, Choi M, Czito BG, Cornell J, Welzel TM, et al. Multimodality therapy for locoregional extrahepatic cholangiocarcinoma: a population-based analysis. Cancer. 2009; 115:5175–83.
10. Sagawa N, Kondo S, Morikawa T, Okushiba S, Katoh H. Effectiveness of radiation therapy after surgery for hilar cholangiocarcinoma. Surg Today. 2005; 35:548–52.
crossref
11. Vern-Gross TZ, Shivnani AT, Chen K, Lee CM, Tward JD, MacDonald OK, et al. Survival outcomes in resected extrahepatic cholangiocarcinoma: effect of adjuvant radiotherapy in a surveillance, epidemiology, and end results analysis. Int J Radiat Oncol Biol Phys. 2011; 81:189–98.
crossref
12. Im JH, Seong J, Lee J, Kim YB, Lee IJ, Park JS, et al. Postoperative radiotherapy dose correlates with locoregional control in patients with extra-hepatic bile duct cancer. Radiat Oncol J. 2014; 32:7–13.
crossref
13. Jarnagin WR, Ruo L, Little SA, Klimstra D, D'Angelica M, DeMatteo RP, et al. Patterns of initial disease recurrence after resection of gallbladder carcinoma and hilar cholangiocarcinoma: implications for adjuvant therapeutic strategies. Cancer. 2003; 98:1689–700.
14. Choi SB, Park SW, Kim KS, Choi JS, Lee WJ. The survival outcome and prognostic factors for middle and distal bile duct cancer following surgical resection. J Surg Oncol. 2009; 99:335–42.
crossref
15. Koo TR, Eom KY, Kim IA, Cho JY, Yoon YS, Hwang DW, et al. Patterns of failure and prognostic factors in resected extrahepatic bile duct cancer: implication for adjuvant radiotherapy. Radiat Oncol J. 2014; 32:63–9.
crossref
16. Park JH, Choi EK, Ahn SD, Lee SW, Song SY, Yoon SM, et al. Postoperative chemoradiotherapy for extrahepatic bile duct cancer. Int J Radiat Oncol Biol Phys. 2011; 79:696–704.
crossref
17. Kim K, Chie EK, Jang JY, Kim SW, Han SW, Oh DY, et al. Adjuvant chemoradiotherapy after curative resection for extrahepatic bile duct cancer: a long-term single center experience. Am J Clin Oncol. 2012; 35:136–40.
18. Takada T, Amano H, Yasuda H, Nimura Y, Matsushiro T, Kato H, et al. Is postoperative adjuvant chemotherapy useful for gallbladder carcinoma? A phase III multicenter prospective randomized controlled trial in patients with resected pancreaticobiliary carcinoma. Cancer. 2002; 95:1685–95.
19. Lim KH, Oh DY, Chie EK, Jang JY, Im SA, Kim TY, et al. Adjuvant concurrent chemoradiation therapy (CCRT) alone versus CCRT followed by adjuvant chemotherapy: which is better in patients with radically resected extrahepatic biliary tract cancer?: a non-randomized, single center study. BMC Cancer. 2009; 9:345.
crossref

Fig. 1.
Comparison of survival curves according to treatment type in patients with R1 resection. CRT, chemoradiotherapy; RT, radiotherapy; CTx, chemotherapy.
crt-2015-091f1.tif
Fig. 2.
Combined comparison of survival curves according to treatment type (surgery alone and surgery with chemotherapy vs. surgery with radiotherapy [RT] and surgery with chemoradiotherapy) in patients with R1 resection.
crt-2015-091f2.tif
Fig. 3.
Combined comparison of survival curves according to treatment type (surgery alone and surgery with radiotherapy vs. surgery with chemotherapy [CTx] and surgery with chemoradiotherapy) in patients with R1 resection.
crt-2015-091f3.tif
Table 1.
Patient characteristics of all patients and comparison of subgroups (treatment type) using the chi-square test or Fisher exact test
Characteristic Total (n=336) Surgery alone (n=168) Surgery with CTx (n=90) Surgery with RT (n=29) Surgery with CRT (n=49) p-value
Age (yr)
 ≤ 60 124 (36.9) 56 (33.3) 41 (45.6) 9 (31.0) 18 (36.7) 0.236
 > 60 212 (63.1) 112 (66.7) 49 (54.4) 20 (69.0) 31 (63.3)
Sex
 Male 216 (64.3) 118 (70.2) 51 (56.7) 16 (55.2) 31 (63.3) 0.115
 Female 120 (35.7) 50 (29.8) 39 (43.3) 13 (44.8) 18 (36.7)
ECOG performance status
 0-1 323 (96.1) 163 (97.0) 87 (96.7) 28 (96.6) 45 (91.8) 0.406
 2 13 (3.9) 5 (3.0) 3 (3.3) 1 (3.4) 4 (8.2)
Tumor location
 Perihilar bile duct 109 (32.4) 55 (32.7) 24 (26.7) 13 (44.8) 17 (34.7) 0.318
 Distal bile duct 227 (67.6) 113 (67.3) 66 (73.3) 16 (55.2) 32 (65.3)
Preoperative CA19-9 (U/mL)
 < 37 105 (31.3) 61 (36.3) 22 (24.4) 9 (31.0) 13 (26.5) 0.217
 ≥ 37 231 (68.8) 107 (63.7) 68 (75.6) 20 (69.0) 36 (73.5)
Postoperative CA19-9 (U/mL)
 < 37 281 (83.6) 143 (85.1) 75 (83.3) 21 (72.4) 42 (85.7) 0.377
 ≥ 37 55 (16.4) 25 (14.9) 15 (16.7) 8 (27.6) 7 (14.3)
Preoperative CEA (ng/mL)
 < 5 297 (88.4) 153 (91.1) 74 (82.2) 27 (93.1) 43 (87.8) 0.160
 ≥ 5 39 (11.6) 15 (8.9) 16 (17.8) 2 (6.9) 6 (12.2)
Surgical procedure
 Bile duct resection 78 (23.2) 32 (19.0) 11 (12.2) 10 (34.5) 25 (51.0) < 0.001
 PPPD 165 (49.1) 85 (50.6) 54 (60.0) 10 (34.5) 16 (32.7)
 Liver lobectomy with bile duct resection 93 (27.7) 51 (30.4) 25 (27.8) 9 (31.0) 8 (16.3)
Resection margin
 R0 251 (74.7) 145 (86.3) 77 (85.6) 10 (34.5) 19 (38.8) < 0.001
 R1 67 (19.9) 22 (13.1) 12 (13.3) 13 (44.8) 20 (40.8)
 R2 18 (5.4) 1 (0.6) 1 (1.1) 6 (20.7) 10 (20.4)
Histologic grade
 WD/MD 284 (84.5) 142 (84.5) 75 (83.3) 24 (82.8) 43 (87.8) 0.906
 PD 52 (15.5) 26 (15.5) 15 (16.7) 5 (17.2) 6 (12.2)
Lymphovascular invasion
 No 256 (76.2) 135 (80.4) 57 (63.3) 23 (79.3) 41 (83.7) 0.009
 Yes 80 (23.8) 33 (19.6) 33 (36.7) 6 (20.7) 8 (16.3)
Perineural invasion
 No 120 (35.7) 75 (44.6) 21 (23.3) 10 (34.5) 14 (28.6) 0.005
 Yes 216 (64.3) 93 (55.4) 69 (76.7) 19 (65.5) 35 (71.4)
T stage
 T1-2 150 (44.6) 76 (45.2) 34 (37.8) 14 (48.3) 26 (53.1) 0.348
 T3-4 186 (55.4) 92 (54.8) 56 (62.2) 15 (51.7) 23 (46.9)
N stage
 N0 209 (62.2) 128 (76.2) 36 (40.0) 17 (58.6) 28 (57.1) < 0.001
 N1 127 (37.8) 40 (23.8) 54 (60.0) 12 (41.4) 21 (42.9)
Stage
 I 105 (31.3) 64 (38.1) 13 (14.4) 10 (34.5) 18 (36.7) < 0.001
 IIA 90 (26.8) 60 (35.7) 17 (18.9) 5 (17.2) 8 (16.3)
 IIB 108 (32.1) 30 (17.9) 50 (55.6) 9 (31.0) 19 (38.8)
 III 33 (9.8) 14 (8.3) 10 (11.1) 5 (17.2) 4 (8.2)

Values are presented as number (%). The p-value was calculated between the four groups by chi-square test or Fisher exact test. CTx, chemotherapy; RT, radiotherapy; CRT, concurrent chemoradiotherapy; ECOG, Eastern Cooperative Oncology Group; CA, carbohydrate antigen; CEA, carcinoembryonic antigen; PPPD, pylorus preserving pancreaticoduodenectomy; WD, well differentiated; MD, moderately differentiated; PD, poorly differentiated.

Table 2.
Univariate analysis of prognostic factors of LRFFS, DMFS, PFS, and OS
Prognostic factor No. of patients 5-Yr survival rate (%)
LRFFS p-value DMFS p-value PFS p-value OS p-value
Age (yr)
 ≤ 60 124 56.9 0.947 62.5 0.564 39.0 0.587 44.8 0.341
 > 60 212 56.3 57.9 35.1 40.4
Sex
 Male 216 58.0 0.701 60.0 0.750 38.3 0.512 42.5 0.897
 Female 120 54.3 59.1 33.7 41.5
Tumor location
 Perihilar bile duct 109 50.3 0.057 45.7 0.002 25.3 0.001 28.9 < 0.001
 Distal bile duct 227 59.3 65.8 41.7 47.9
Preoperative CA19-9 (U/mL)
 < 37 105 64.1 0.02 76.9 < 0.001 53.5 < 0.001 55.4 < 0.001
 ≥ 37 231 53.1 51.3 28.9 35.9
Postoperative CA19-9 (U/mL)
 < 37 281 61.7 < 0.001 65.1 < 0.001 43.2 < 0.001 48.1 < 0.001
 ≥ 37 55 24.7 28.8 3.8 11.4
Preoperative CEA (ng/mL)
 < 5 297 57.4 0.392 59.7 0.689 37.6 0.151 42.9 0.364
 ≥ 5 39 49.1 60.4 27.8 35.4
Resection margin
 R0 251 61.0 < 0.001 64.6 0.018 41.6 0.004 47.1 0.001
 R1 67 51.7 48.6 24.8 29.5
 R2 18 8.9 29.0 5.6 11.9
Histologic grade
 WD/MD 284 58.9 0.002 63.0 < 0.001 38.8 < 0.001 44.6 < 0.001
 PD 52 43.4 40.3 24.8 27.9
Lymphovascular invasion
 No 256 59.1 0.05 64.8 < 0.001 42.2 < 0.001 48.2 < 0.001
 Yes 80 47.2 43.3 19.3 23.3
Perineural invasion
 No 120 65.6 0.016 67.4 0.006 48.0 < 0.001 55.3 < 0.001
 Yes 216 50.6 55.8 30.3 34.6
T stage
 T1-2 150 60.0 0.120 66.8 0.003 41.8 0.009 49.2 0.004
 T3-4 186 53.8 53.9 32.5 36.3
N stage
 N0 209 61.8 0.001 67.5 < 0.001 45.6 < 0.001 51.8 < 0.001
 N1 127 47.6 46.1 22.0 26.5
Stage
 I 105 63.2 0.008 74.0 0.001 49.8 < 0.001 57.1 < 0.001
 IIA 90 62.3 61.2 43.4 49.1
 IIB 108 48.6 46.8 21.4 26.3
 III 33 43.1 50.0 26.9 30.2
Treatment type
 Surgery alone 168 57.5 0.139 60.9 0.056 39.1 0.346 43.2 0.596
 Surgery with CTx 90 48.0 65.8 30.5 37.9
 Surgery with RT 29 66.7 35.2 30.3 42.9
 Surgery with CRT 49 64.2 59.6 44.0 47.6

LRFFS, locoregional failure-free survival; DMFS, distant metastasis-free survival; PFS, progression-free survival; OS, overall survival; CA, carbohydrate antigen; CEA, carcinoembryonic antigen; WD, well differentiated; MD, moderately differentiated; PD, poorly differentiated; CTx, chemotherapy; RT, radiotherapy; CRT, concurrent chemoradiotherapy.

Table 3.
Multivariate analysis of prognostic factors regarding LRFFS, DMFS, PFS, and OS
Variable LRFFS
DMFS
PFS
OS
HR (95% CI) p-value HR (95% CI) p-value HR (95% CI) p-value HR (95% CI) p-value
Tumor location (perihilar bile duct) 1.120 (0.755-1.659) 0.574 1.103 (0.735-1.655) 0.637 1.089 (0.799-1.484) 0.591 1.261 (0.916-1.735) 0.155
Preoperative CA19-9 (≥ 37 U/mL) 1.340 (0.881-2.038) 0.171 2.374 (1.459-3.863) 0.001 1.915 (1.351-2.713) < 0.001 1.620 (1.134-2.313) 0.008
Postoperative CA19-9 (≥ 37 U/mL) 2.140 (1.374-3.334) < 0.001 2.158 (1.385-3.361) 0.001 2.451 (1.730-3.472) < 0.001 2.097 (1.453-3.027) < 0.001
Resection margin
 R1 1.450 (0.895-2.348) 0.131 1.229 (0.774-1.952) 0.383 1.288 (0.891-1.863) 0.178 1.492 (1.022-2.178) 0.038
 R2 8.748 (4.046-18.917) < 0.001 1.400 (0.643-3.050) 0.397 2.616 (1.389-4.927) 0.003 2.570 (1.382-4.778) 0.003
Histologic grade (PD) 2.238 (1.420-3.527) 0.001 3.390 (2.153-5.340) < 0.001 2.609 (1.799-3.783) < 0.001 2.818 (1.950-4.072) < 0.001
Lymphovascular invasion (positive) 0.939 (0.609-1.447) 0.774 1.893 (1.223-2.930) 0.004 1.457 (1.042-2.038) 0.028 1.385 (0.985-1.948) 0.061
Perineural invasion (positive) 1.239 (0.817-1.880) 0.313 1.251 (0.796-1.966) 0.332 1.185 (0.845-1.660) 0.325 1.245 (0.879-1.620) 0.214
T stage (T3-4) 1.051 (0.727-1.520) 0.792 1.334 (0.898-1.982) 0.154 1.057 (0.786-1.422) 0.712 1.193 (0.879-1.620) 0.257
N stage (N1) 1.618 (1.081-2.423) 0.019 1.827 (1.220-2.737) 0.003 1.886 (1.377-2.583) < 0.001 1.806 (1.305-2.500) < 0.001
Treatment type
 Surgery alone 1 1 1 1
 Surgery with CTx 0.841 (0.550-1.284) 0.423 0.361 (0.220-0.592) < 0.001 0.616 (0.434-0.875) 0.007 0.622 (0.437-0.886) 0.008
 Surgery with RT 0.252 (0.108-0.588) 0.001 1.119 (0.619-2.022) 0.710 0.574 (0.334-0.988) 0.045 0.587 (0.324-1.062) 0.078
 Surgery with CRT 0.245 (0.116-0.517) < 0.001 0.581 (0.317-1.064) 0.078 0.409 (0.244-0.686) 0.001 0.462 (0.277-0.772) 0.003

LRFFS, locoregional failure-free survival; DMFS, distant metastasis-free survival; PFS, progression-free survival; OS, overall survival; HR, hazard ratio; CI, confidence interval; CA, carbohydrate antigen; PD, poorly differentiated; CTx, chemotherapy; RT, radiotherapy; CRT, concurrent chemoradiotherapy.

Table 4.
Patterns of first and cumulative recurrence over the entire follow-up period and the distribution of pattern of failures according to treatment type
Variable Patterns of failure Surgery alone Surgery with CTx Surgery with RT Surgery with CRT p-value
First recurrence
 Total
  All (n=336) LRF (n=131) 65/168 (38.7) 44/90 (48.9) 8/29 (27.6) 14/49 (28.6) 0.057
DF (n=121) 59/168 (35.1) 28/90 (31.1) 17/29 (58.6) 17/49 (34.7) 0.058
LRF+DF (n=44) 24/168 (14.3) 8/90 (8.9) 6/29 (20.7) 6/49 (12.2) -
 N stage
  LN (+) (n=127) LRF (n=60) 22/40 (55.0) 29/54 (53.7) 3/12 (25.0) 6/21 (28.6) 0.066
DF (n=59) 21/40 (52.5) 18/54 (33.3) 10/12 (83.3) 10/21 (47.6) 0.012
 Resection margin
  R1 (n=67) LRF (n=25) 13/22 (59.1) 7/12 (58.3) 2/13 (15.4) 3/20 (15.0) 0.003
DF (n=30) 16/22 (72.7) 3/12 (25.0) 6/13 (46.2) 5/20 (25.0) 0.007
  R2 (n=18) LRF (n=15) 1/1 (100) 1/1 (100) 4/6 (66.7) 9/10 (90.0) -
DF (n=10) 0/1 (0.0) 0/1 (0.0) 4/6 (66.7) 6/10 (60.0) -
Tumor location
 Perihilar (n=109) LRF (n=47) 23/55 (41.8) 16/24 (66.7) 4/13 (30.8) 4/17 (23.5) 0.030
DF (n=50) 25/55 (45.5) 9/24 (37.5) 8/13 (61.5) 8/17 (47.1) 0.577
 Distal (n=227) LRF (n=84) 42/113 (37.2) 28/66 (42.4) 4/16 (25.0) 10/32 (31.2) 0.517
DF (n=71) 34/113 (30.1) 19/66 (28.8) 9/16 (56.2) 9/32 (28.1) 0.168
Cumulative recurrence
 Total
  All (n=336) LRF (n=149) 75/168 (44.6) 48/90 (53.3) 9/29 (31.0) 17/49 (34.7) 0.076
DF (n=162) 78/168 (46.4) 47/90 (52.2) 17/29 (58.6) 20/49 (40.8) 0.373
LRF+DF (n=103) 53/168 (31.5) 31/90 (34.4) 7/29 (24.1) 12/49 (24.5) -

Values are presented as number (%). The p-value was calculated by chi-square test. CTx, chemotherapy; RT, radiotherapy; CRT, concurrent chemoradiotherapy; LN, lymph node; LRF, locoregional failure; DF, distant failure.

Table 5.
Multivariate analysis of LFFRS, DMFS, PFS, and OS for R1 patients
Variable LRFFS
DMFS
PFS
OS
HR (95% CI) p-value HR (95% CI) p-value HR (95% CI) p-value HR (95% CI) p-value
Preoperative CA19-9 (≥ 37 U/mL) 1.238 (0.403-3.800) 0.710 1.618 (0.555-4.715) 0.378 2.029 (0.867-4.745) 0.103 1.310 (0.549-3.124) 0.542
Postoperative CA19-9 (≥ 37 U/mL) 1.396 (0.477-4.084) 0.543 1.326 (0.580-3.013) 0.504 1.523 (0.760-3.052) 0.236 1.893 (0.918-3.902) 0.084
Histologic grade (PD) 0.945 (0.175-5.102) 0.947 3.384 (1.059-10.812) 0.040 2.515 (0.872-7.258) 0.088 4.961 (1.464-16.810) 0.010
Lymphovascular invasion (positive) 0.850 (0.331-2.184) 0.736 2.600 (1.097-6.161) 0.030 2.136 (1.070-4.265) 0.031 1.316 (0.646-2.683) 0.449
Perineural invasion (positive) 1.656 (0.443-6.190) 0.454 2.237 (0.630-7.940) 0.213 1.434 (0.523-3.932) 0.483 3.987 (1.180-13.472) 0.026
T stage (T3-4) 0.659 (0.254-1.711) 0.392 0.802 (0.323-1.989) 0.634 0.666 (0.329-1.349) 0.259 0.932 (0.434-2.002) 0.858
N stage (N1) 0.507 (0.184-1.399) 0.189 1.304 (0.553-3.074) 0.544 0.928 (0.450-1.914) 0.840 1.109 (0.543-2.265) 0.777
Treatment type
 Surgery alone 1 1 1 1
 Surgery with CTx 0.691 (0.222-2.149) 0.524 0.123 (0.032-0.471) 0.002 0.378 (0.153-0.933) 0.035 0.460 (0.181-1.167) 0.102
 Surgery with RT 0.113 (0.023-0.567) 0.008 0.517 (0.166-1.616) 0.257 0.301 (0.112-0.808) 0.017 0.354 (0.116-1.082) 0.068
 Surgery with CRT 0.112 (0.029-0.433) 0.001 0.241 (0.079-0.737) 0.013 0.214 (0.087-0.526) 0.001 0.301 (0.119-0.762) 0.011

LRFFS, locoregional failure-free survival; DMFS, distant metastasis-free survival; PFS, progression-free survival; OS, overall survival; HR, hazard ratio; CI, confidence interval; CA, carbohydrate antigen; PD, poorly differentiated; CTx, chemotherapy; RT, radiotherapy; CRT, concurrent chemoradiotherapy.

TOOLS
Similar articles