Journal List > Cancer Res Treat > v.48(1) > 1153254

Suh, Choi, Park, Lee, Jun, Lee, and Kim: Trends in Cancer Screening Rates among Korean Men and Women: Results of the Korean National Cancer Screening Survey, 2004-2013

Abstract

Purpose

The Korean National Cancer Screening Survey (KNCSS), a nationwide cross-sectional survey, has been conducted annually since 2004. The current study was conducted to report on the trends in screening rates among Korean men and women, and to evaluate policies regarding cancer screening programs implemented to reduce the burden of cancer.

Materials and Methods

The current study used KNCSS data. The eligible study population included men aged 40-74 years and women aged 30-74 years with no cancer history. The lifetime screening rate, screening rate with recommendation, and changes in annual rates were calculated for five major cancers (i.e., stomach, liver, colorectal, breast, and cervix uteri).

Results

The screening rates with recommendation increased by 4.2% (95% confidence interval [CI], 3.7% to 4.8%) annually for stomach cancer, 1.2% (95% CI, 0.1% to 2.4%) for liver cancer, 3.0% (95% CI, 1.8% to 4.1%) for colorectal cancer, 3.7% (95% CI, 2.7% to 4.8%) for breast cancer, and 1.3% (95% CI, 0.8% to 1.8%) for cervical cancer. In 2013, the screening rates with recommendation for stomach, liver, colorectal, breast, and cervical cancers were 73.6%, 33.6%, 55.6%, 59.7%, and 67.0%, respectively.

Conclusion

Both the lifetime screening rates and screening rates with recommendation for the five above-mentioned cancers increased annually from 2004 to 2013.

Introduction

Cancer is the leading cause of death in Korea, where more than 73,757 people died of cancer in 2012 [1]. The cancer incidence rate for all cancer sites combined increased by 3.4% per year (1.6% in males, 5.4% in females) from 1999 to 2011 [2]. Cancer screening allows for early cancer detection, before appearance of symptoms, which usually results in better outcomes. Therefore, screening reduces cancer mortality, and in some cases, cancer incidence. In Korea, both organized and opportunistic cancer screening are available. The organized cancer screening program is provided by the government. Opportunistic cancer screening programs include a variety of options in terms of the items screened, intervals between screenings, and target cancer type depending on individual decisions or recommendations from health care providers.
In 1999, the Korean government established the National Cancer Screening Program (NCSP) to provide organized cancer screening to reduce the burden of cancer. Since then, the target population and types of cancer covered by NCSP have been expanded. The NCSP provided Medical Aid recipients with free-of-charge screening for stomach, breast, and cervical cancer until 2001. Since 2002, National Health Insurance (NHI) beneficiaries in the lower 20% income stratum have been included in the NCSP. In 2003, NHI beneficiaries in the lower 30% income stratum and patients with one additional type of cancer (liver) were included, and patients with colorectal cancer were included in the NCSP in 2004. Since 2005, the NCSP has provided Medical Aid recipients and NHI beneficiaries in the lower half of the income stratum with screenings for five types of cancer (i.e., stomach, liver, colorectal, breast, and cervix uteri). NHI beneficiaries in the upper 50% income stratum receive screening services for the same five types of cancer from the NHI Corporation; however, they pay 10% of the screening cost [3-7]. The NCSP utilizes nationally implemented protocols that define a target population, screening interval, and follow-up strategies (Table 1). Here, we report the trends in overall screening rates associated with both the organized and opportunistic cancer screening programs among Korean men and women, and we evaluate policies on cancer screening programs implemented to reduce the burden of cancer.

Materials and Methods

The Korean National Cancer Screening Survey (KNCSS) data from 2004 to 2013 were used in the current study. The National Cancer Center has conducted the KNCSS annually since 2004 [8]. The KNCSS is a nationwide, population-based, cross-sectional survey. Stratified multistage, random sampling based on resident registration population data are collected according to geographical area, age, and sex. In the current study, the number of enumeration districts was designated in proportion to population size by sex, age, and geographical area, and the final study clusters were randomly selected. A total of 5 to 7 households in an urban area, and 10 to 12 households in a rural area were randomly chosen. The methods used for sampling were described in a previous study [9].
According to the protocols of the NCSP (Table 1), people older than 40 years of age are eligible to undergo gastric cancer screening; those older than 50 years of age are eligible to undergo colorectal cancer screening; women older than 40 years of age are eligible to undergo breast cancer screening; and women older than 30 years of age are eligible to undergo cervical cancer screening. Screening for liver cancer is restricted to individuals older than 40 years of age, in high-risk groups, such as patients who were carriers of hepatitis B virus or hepatitis C virus, or who have liver cirrhosis. Therefore, the target population in the current study comprised cancer-free men and women older than 40 and 30 years of age, respectively, in each year from 2004 to 2013.
In 2004, the data were collected using computer-assisted telephone interviews. From 2005 to 2013, the data were collected through face-to-face interviews conducted by a professional research agency. Subjects were recruited through door-to-door contact, and at least three attempts to contact each household were made. One person was selected from each household; if there was more than one eligible person in the household, the person whose date of birth was closest to the study date was selected. Informed consent was obtained from all study participants. The response rates ranged from 34.5% to 69.3% from 2005 to 2013.
Using a structured questionnaire, participants were asked about their experience with screening for five types of cancer (i.e., stomach, liver, colorectal, breast, and cervix uteri) and sociodemographic characteristics, including income level. The distributions of the sociodemographic characteristics of the study respondents for each year are shown in Table 2. The questions included “Have you ever undergone [cancer type] screening?” and “Which screening method have you experienced?” For the interval between screenings, the question was as follows: “When did you last undergo [cancer type] screening with this method?” To determine the reasons for undergoing or not undergoing screening, we asked “What are your primary reasons for undergoing screening or not undergoing screening?” Two types of cancer screening rates were measured in this study. “Lifetime screening” was defined as having ever undergone each type of screening test during his or her lifetime. The “screening rate with recommendation” category was assigned to participants who had undergone screening tests according to the procedure and interval of the NCSP (Table 1). However, for colorectal screening, respondents who underwent colonoscopy, double-contrast barium enema (DCBE), or fecal occult blood test (FOBT) within 5, 5, or 1 year, respectively, before 2009, and within 10, 5, and 1 year, respectively, after 2009 were considered to have undergone screening with recommendation.
Changes in the annual screening rates for lifetime screening and screening rates with recommendation were calculated as the annual percentage change (APC) within a 95% confidence interval (CI). The screening rates of each of the four cancers (stomach, colorectal, breast, and cervix uteri) were also calculated according to sex, age, and income. Because of an inadequate number of individuals within the high-risk group and unstable results that showed a wide 95% CI, the liver cancer screening rate was excluded from subgroup analysis. Monthly household income was subgrouped into three tertiles for each year. This study was approved by the National Cancer Center Institutional Review Board in Korea (approval number: NCCNCS-08-129).

Results

The lifetime screening rates and screening rates with recommendation increased from 2004 onward. From 2004 to 2013, the lifetime screening rates increased annually by 3.9% for gastric cancer, 1.8% for liver cancer, 5.0% for colorectal cancer, 3.4% for breast cancer, and 0.3% for cervical cancer (Table 3). Significant increasing trends were observed in the lifetime screening rates for gastric, colorectal, and breast cancer, but not for liver or cervical cancer. The screening rates with recommendation increased annually by 4.2% for gastric cancer, 1.2% for liver cancer, 3.0% for colorectal cancer, 3.7% for breast cancer, and 1.3% for cervical cancer from 2004 to 2013. Significant increasing trends were observed in the screening rates with recommendation for all types of cancer. The trends and the APC of the screening rate differed according to the screening method used. The screening rate using upper endoscopy increased by more than 2-fold compared to that using an upper gastrointestinal series (4.2% and 1.7% per year, respectively). The colorectal cancer screening rate using FOBT or colonoscopy showed a more rapid increase than that using DCBE (2.7%, 2.2%, and 0.2% per year, respectively). Only the screening rate with recommendation using DCBE increased without statistical significance.
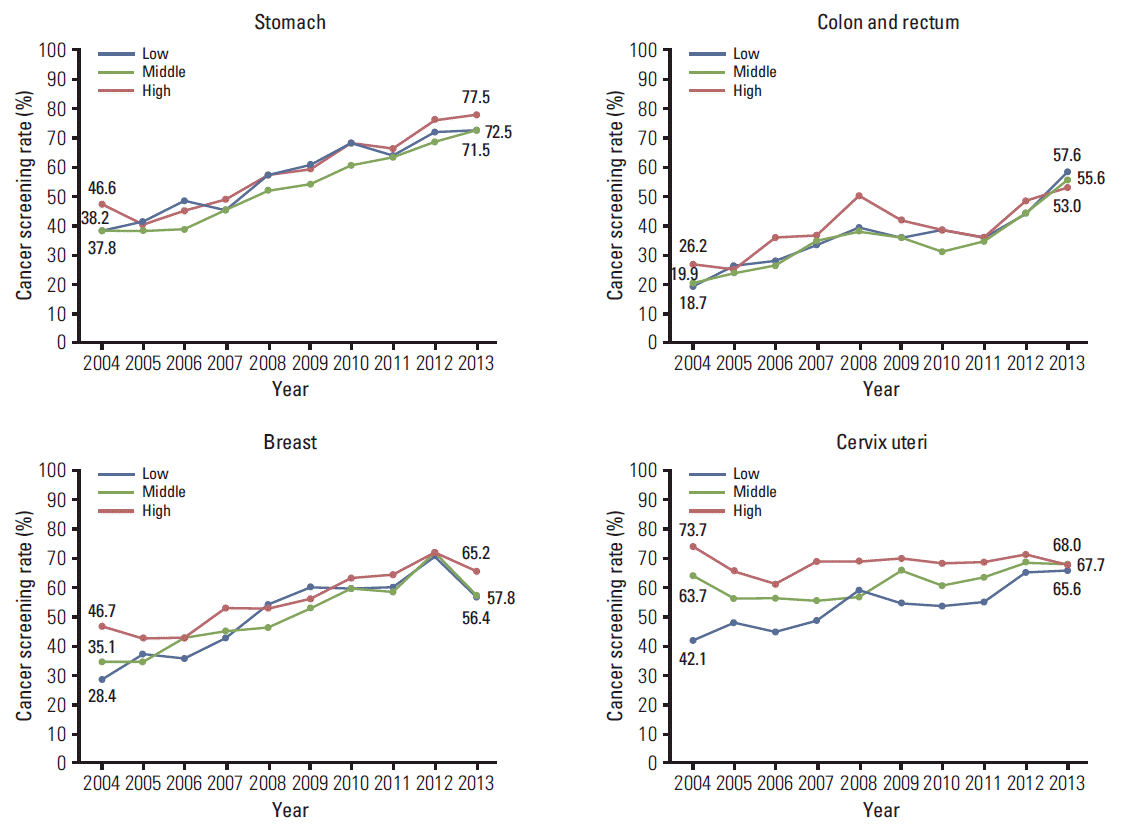
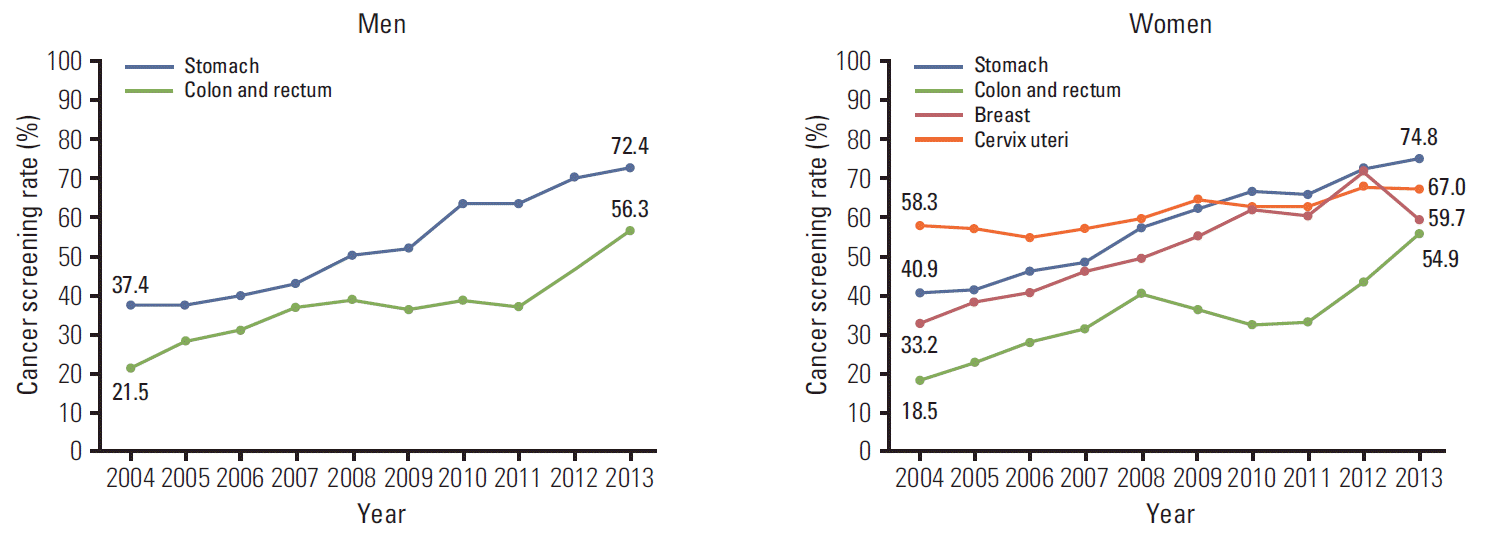
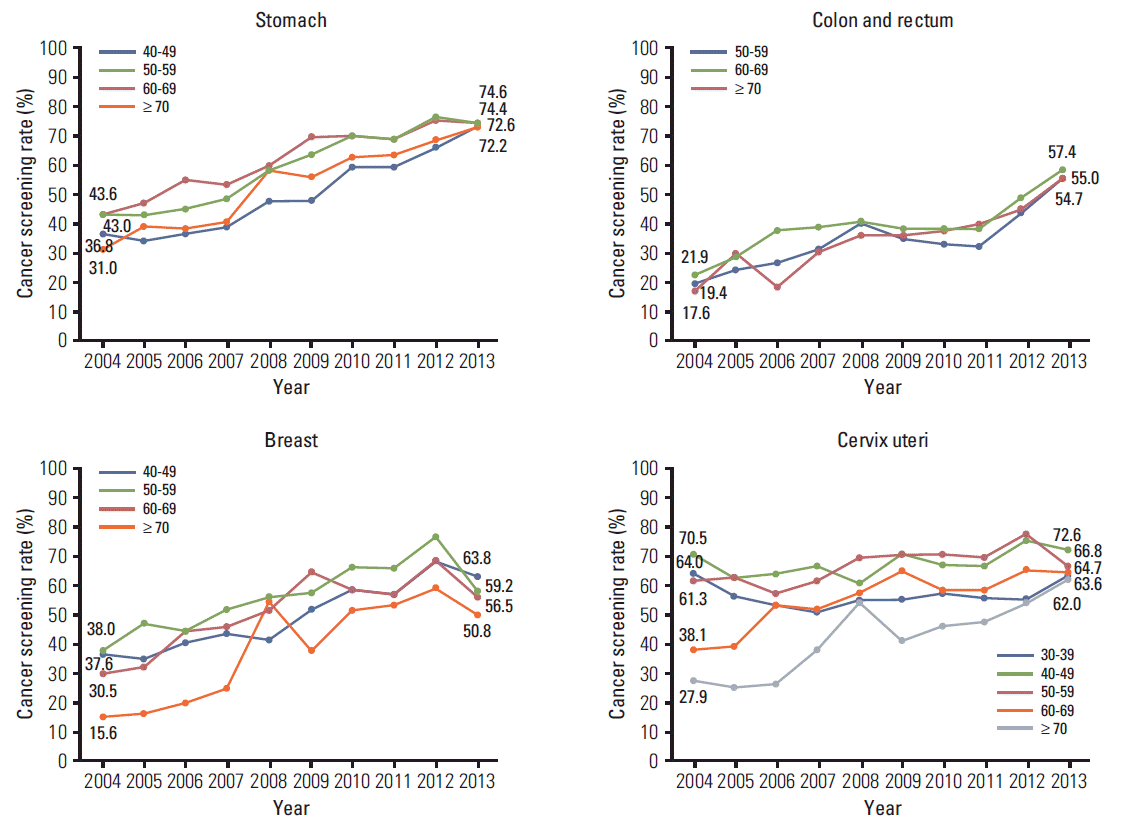
The screening rates according to sex, age, and income were calculated (Table 4, Figs. 1-3). In men, the screening rate with recommendation for stomach and colorectal cancer showed a steady increase (Fig. 1). In women, increasing trends were observed for stomach, colorectal, and cervical cancer from 2004 onward. For breast cancer, despite an increase in the screening rate with recommendation until 2012, the screening rate decreased rapidly by 11.2% from 2012 to 2013. For stomach and colorectal cancer, the screening rates with recommendation increased in all age groups (Fig. 2). In cases of breast cancer, an increasing tendency was observed before 2012, and the screening rate decreased from 2012 to 2013 in all age groups. The most rapid decrease in the screening rate with recommendation occurred for patients in their fifties with breast cancer in 2013 (18.3%). Although the screening rate with recommendation for cervical cancer in 2004 showed a significant difference according to age (highest rate, 70.5% vs. lowest rate, 27.9%), the screening rates by age group were similar in 2013. The screening rates for stomach and colorectal cancer increased steadily at all income levels, and differences in screening rates were smaller among all income groups than those in 2004 (Fig. 3). Screening rates for breast cancer showed an increasing pattern from 2004 to 2012, followed by a decreasing pattern in all income groups. The screening rate for cervical cancer was lower in the low-income group than in the middle- and high-income groups, whereas differences between groups showed a decrease.

Discussion

Both the lifetime screening rates and screening rates with recommendation for the five above-mentioned cancers have increased since 2004. The lifetime screening rates for all cancer types with the exception of liver cancer exceeded 70% in 2013. The screening rates with recommendation are smaller than lifetime screening rates for each cancer. Repeated screening with the optimal time interval is required for early detection of cancer. Therefore, there is a need to undergo screening according to the recommended protocol. The screening rates with recommendation for gastric and breast cancer exceeded 70% in 2012, but those for breast cancer decreased to 59.7% in 2013. For breast cancer, the screening rate with recommendation increased by approximately 10% from 2011 to 2012, and declined by more than 10% from 2012 to 2013. In 2013, the screening rate with recommendation for breast cancer showed a trend similar to that in 2010 and 2011. The decreasing screening rates for breast cancer in all age groups appear to be the effect of broadcasted negative messages about breast cancer screening since 2012 in Korea. Also, in case of cervical cancer, the screening rate with recommendation for patients in their fifties decreased by 10.8% from 2012 to 2013. Therefore, continuous surveys and observations are needed to determine whether the decrease since 2012 will continue to be steady or is only a temporary decrease.
The trends of changes in cancer screening rates were analyzed by socio-demographic factors associated with cancer screening rate. The gaps of screening rates have recently decreased among age groups, and household income status in most of five cancers in NCSP. These trends suggested the positive effects in reducing the inequity regarding cancer screening by NCSP in Korea.
In the United States, the Guide to Community Preventive Services conducted and updated systematic reviews on the effectiveness of interventions to increase the screening rates for breast, cervical, and colorectal cancers [10,11]. This group recommends interventions involving one-on-one client education, providing client reminders, making screening more accessible and easier, reducing out-of-pocket costs, and performing provider assessment and feedback. Client reminders, increasing community access to screening, reducing out-of-pocket costs, and performing provider assessment and feedback have already been implemented in the Korean NCSP. However, the introduction of group or one-on-one education to clients should also be considered in Korea. Previous studies conducted in Japan reported a very high correlation between cancer screening rates and sending personal invitation letters regarding the strategies used in Japan [12]. Sending personal invitation letters has already been implemented in the NCSP system.
In the United Kingdom, where nationwide organized cancer screening has been implemented, the National Health System (NHS) breast screening program provides mammographic breast screening every 3 years. The 3-year coverage for breast cancer screening was 73.4% for women aged 45 to 74 years who underwent mammography in 2010-2011 [13]. In the United States, based on the National Health Interview Survey, the breast cancer screening rate using mammography among women aged ≥ 40 years was 51.2%, 53.0%, and 51.0% in 2005, 2008, and 2010, respectively [14]. Before 2005, the screening rate showed a slight decline of 3.4% from 2000 to 2005 [15]. The screening rates for breast cancer in Korean women in the same year were lower than those reported. In Japan, the screening rate for breast cancer was 14.2% in 2007, trending toward a gradual increase since the early 1990s [16].
In the United Kingdom, the 5-year cervical cancer screening coverage using the Pap smear test was 79.0% for women aged 25 to 49 in 2011-2012. However, there was a small drop in the 5-year coverage for women aged 50 to 64 years from 78.0% between 2010 and 2011, to 77.8% between 2011 and 2012 [17]. Based on the National Health Interview Survey conducted in the United States, the screening rate for cervical cancer in American women aged ≥ 18 years, who reported having undergone a Pap test within the past 3 years, was 79.6%, 78.3%, and 76.4% in 2005, 2008, and 2010, respectively [14]. The screening rate increased until 2000 and then fell. No changes in the absolute differences in the rates of cervical cancer screening according to education were observed [18]. The rates in the United Kingdom and United States were higher than those reported in the same year in Korea. In Japan, the screening rate for cervical cancer was 18.8% in 2007 [16], lower than that reported in Korea.
In Korea, both the lifetime screening rate and the screening rate with recommendation for colorectal cancer have shown a steady increase since 2004. In addition, the screening rate for colorectal cancer using FOBT or colonoscopy showed a more rapid increase than that using DCBE. Based on the National Health Interview Survey conducted in the United States, the prevalence of recent screening with either FOBT or endoscopy was 43.1% in 2005, 50.2% in 2008, and 56.4% in 2010 [14,19]. These rates are higher than those reported in the same year in Korea. In Korea, similar total colorectal cancer screening rates were reported for FOBT and colonoscopy, while in the United States a much higher screening rate was reported for colonoscopy than FOBT. In Japan, the screening rate for colorectal cancer was 18.8% in 2007, trending toward a gradual increase (APC, 0.5%) since the early 1990s [16]. These rates are lower than those reported in Korea.
The KNCSS conducted a 10-year nationwide survey in Korea and reported the screening rates for five types of cancer. However, this survey has some limitations. This study used self-reported data, which might have been affected by recall bias. However, many studies have reported high correlations between the rates derived from chart audits and patient surveys [20-22]. In addition, the response rate in this study ranged from 34.5% to 69.3%. Nonetheless, the results might have been affected by nonresponse bias. However, our response rate can be considered acceptable compared to other nationwide studies conducted in Korea, in which the response rates were greater than 50% [23,24]. In the current study, we used stratified multistage, random sampling according to geographical area, age, and sex, but not considering the economic level distribution. Despite some limitations, this nationwide, annual, population-based survey has been conducted for 10 years since 2004. Therefore, the data were sufficiently representative for investigation of the changes of cancer screening rates. The Korean government implemented the 10-Year Plan for Cancer Control; the first term was conducted from 1996 to 2005, and the second term from 2006 to 2015 [25]. One of the goals of the second term of the 10-Year Plan for Cancer Control was achievement of a 70% cancer screening rate with recommendation. In the current study, the screening rate with recommendation for stomach cancer exceeded 70% after 2012, and the screening rate for cervical cancer was close to reaching that goal. However, the screening rates for liver, colorectal, and breast cancer were lower than that goal in 2013. Therefore, a greater effort is needed to increase Korean cancer screening rates.

Conclusion

The KNCSS is conducted for systematic collection, analysis, and interpretation of data regarding the planning, implementation, and evaluation of nationwide cancer screening policies in Korea. As a result of these efforts, the screening rates for five types of cancer have shown a steady increase since 2004, the gaps of cancer screening rates according to socio-demographic factors have decreased, and those for some types of cancer have reached the goal of the 10-Year Plan for Cancer Control.

Notes

Conflict of interest relevant to this article was not reported.

ACKNOWLEDGMENTS

This study was supported by a Grant-in-Aid for Cancer Research and Control from the National Cancer Center of Korea (#1310231).

References

1. Korea Statistical Information Service [Internet]. Daejeon: Statistics Korea;2014. [cited 2014 Jul 30]. Available from: http://kosis.kr.
2. Jung KW, Won YJ, Kong HJ, Oh CM, Lee DH, Lee JS. Cancer statistics in Korea: incidence, mortality, survival, and prevalence in 2011. Cancer Res Treat. 2014; 46:109–23.
crossref
3. Lee YY, Oh DK, Choi KS, Jung KW, Lee HY, Jun JK. The current status of gastric cancer screening in Korea: report on the National Cancer Screening Programme, 2009. Asian Pac J Cancer Prev. 2011; 12:3495–500.
4. Noh DK, Choi KS, Jun JK, Lee HY, Park EC. Factors associated with attending the National Cancer Screening Program for liver cancer in Korea. Asian Pac J Cancer Prev. 2012; 13:731–6.
crossref
5. Shim JI, Kim Y, Han MA, Lee HY, Choi KS, Jun JK, et al. Results of colorectal cancer screening of the national cancer screening program in Korea, 2008. Cancer Res Treat. 2010; 42:191–8.
crossref
6. Oh DK, Shim JI, Han M, Kim Y, Lee HY, Jun JK, et al. Breast cancer screening in Korean women: report of the National Cancer Screening Program in 2008. J Breast Cancer. 2010; 13:299–304.
crossref
7. Lee YH, Choi KS, Lee HY, Jun JK. Current status of the National Cancer Screening Program for cervical cancer in Korea, 2009. J Gynecol Oncol. 2012; 23:16–21.
crossref
8. Suh M, Choi KS, Lee YY, Park B, Jun JK. Cancer screening in Korea, 2012: results from the Korean National Cancer Screening Survey. Asian Pac J Cancer Prev. 2013; 14:6459–63.
crossref
9. Lee HY, Park EC, Jun JK, Hahm MI, Jung KW, Kim Y, et al. Trends in socioeconomic disparities in organized and opportunistic gastric cancer screening in Korea (2005-2009). Cancer Epidemiol Biomarkers Prev. 2010; 19:1919–26.
crossref
10. Sabatino SA, Lawrence B, Elder R, Mercer SL, Wilson KM, DeVinney B, et al. Effectiveness of interventions to increase screening for breast, cervical, and colorectal cancers: nine updated systematic reviews for the guide to community preventive services. Am J Prev Med. 2012; 43:97–118.
11. Baron RC, Rimer BK, Coates RJ, Kerner J, Mullen PD, Chattopadhyay S, et al. Methods for conducting systematic reviews of evidence on effectiveness and economic efficiency of interventions to increase screening for breast, cervical, and colorectal cancers. Am J Prev Med. 2008; 35(1 Suppl):S26–33.
crossref
12. Sano H, Goto R, Hamashima C. What is the most effective strategy for improving the cancer screening rate in Japan? Asian Pac J Cancer Prev. 2014; 15:2607–12.
crossref
13. NHS Breast Screening Programme: annual review 2012 [Internet]. Sheffield: NHS Breast Screening Programme;2012. [cited 2014 Jul 30]. Available from: http://www.cancerscreening.nhs.uk/breastscreen/publications/nhsbspannualreview2012.pdf.
14. Smith RA, Manassaram-Baptiste D, Brooks D, Cokkinides V, Doroshenk M, Saslow D, et al. Cancer screening in the United States, 2014: a review of current American Cancer Society guidelines and current issues in cancer screening. CA Cancer J Clin. 2014; 64:30–51.
crossref
15. National Cancer Institute. Cancer trends progress report: 2011/2012 update [Internet]. Bethesda, MD: National Cancer Institute;2012. [cited 2014 Jul 30]. Available from: http://progressreport.cancer.gov/sites/default/files/archive/report2011.pdf.
16. Yoshida M, Kondo K, Tada T. The relation between the cancer screening rate and the cancer mortality rate in Japan. J Med Invest. 2010; 57:251–9.
crossref
17. NHS Cervical Screening Programme: annual review 2012 [Internet]. Sheffield: NHS Cancer Screening Programme;2012. [cited 2014 Jul 30]. Available from: http://www.cancerscreening.nhs.uk/cervical/publications/cervical-annual-review-2012.pdf.
18. National Cancer Institute. Cancer trends progress report: 2011/2012 update. Cervical cancer screening 2012 [Internet]. Bethesda, MD: National Cancer Institute;2012. [cited 2014 Jul 30]. Available from: http://progressreport.cancer.gov/sites/default/files/archive/report2011.pdf.
19. National Cancer Institute. Cancer trends progress report: 2011/2012 update. Colorectal cancer screening 2012 [Internet]. Bethesda, MD: National Cancer Institute;2012. [cited 2014 Jul 30]. Available from: http://progressreport.cancer.gov/sites/default/files/archive/report2011.pdf.
20. Caplan LS, McQueen DV, Qualters JR, Leff M, Garrett C, Calonge N. Validity of women's self-reports of cancer screening test utilization in a managed care population. Cancer Epidemiol Biomarkers Prev. 2003; 12(11 Pt 1):1182–7.
21. Hoffmeister M, Chang-Claude J, Brenner H. Validity of self-reported endoscopies of the large bowel and implications for estimates of colorectal cancer risk. Am J Epidemiol. 2007; 166:130–6.
crossref
22. Montano DE, Phillips WR. Cancer screening by primary care physicians: a comparison of rates obtained from physician self-report, patient survey, and chart audit. Am J Public Health. 1995; 85:795–800.
crossref
23. Ock SM, Choi JY, Cha YS, Lee J, Chun MS, Huh CH, et al. The use of complementary and alternative medicine in a general population in South Korea: results from a national survey in 2006. J Korean Med Sci. 2009; 24:1–6.
crossref
24. Park B, Lee YK, Cho LY, Go UY, Yang JJ, Ma SH, et al. Estimation of nationwide vaccination coverage and comparison of interview and telephone survey methodology for estimating vaccination status. J Korean Med Sci. 2011; 26:711–9.
crossref
25. Han MA, Choi KS, Park JH, Moore MA, Park EC. Midcourse evaluation of the second-term 10-year plan for cancer control in Korea. Asian Pac J Cancer Prev. 2011; 12:327–33.

Fig. 1.
Cancer screening rates with recommendation by sex, 2004-2013.
crt-2014-204f1.tif
Fig. 2.
Cancer screening rates with recommendation by age (yr), 2004-2013.
crt-2014-204f2.tif
Fig. 3.
Cancer screening rates with recommendation by household income level, 2004-2013. Monthly household income status classified by tertile.
crt-2014-204f3.tif
Table 1.
Cancer screening protocols issued by the National Cancer Screening Program (NCSP) in Korea
Cancer Target population Interval (yr) Test
Stomach Aged ≥ 40 years 2 Upper endoscopy or UGIa)
Liver High-risk groupb) aged ≥ 40 years 1 Ultrasonography and AFP
Colorectal Aged ≥ 50 years 1 FOBTc)
Breast Women aged ≥ 40 years 2 Mammography
Cervix uteri Women aged ≥ 30 years 2 Pap smear

UGI, upper gastrointestinal series; AFP, alpha-fetoprotein; FOBT, fecal occult blood test.

a) In the case of an abnormality on the UGI, endoscopy is recommended, and a biopsy is performed when an abnormality is found during endoscopy,

b) Patients at high risk for liver cancer include those with chronic hepatitis determined by serological evidence of infection with hepatitis B or C virus or liver cirrhosis,

c) In the case of an abnormality on FOBT, colonoscopy or a double-contrast barium enema is recommended, and a biopsy is performed when an abnormality is found during colonoscopy.

Table 2.
Distribution (%) of sociodemographic characteristics of the study respondents in the Korean National Cancer Screening Survey (KNCSS), 2004-2013
Survey year
2004 2005 2006 2007 2008 2009 2010 2011 2012 2013
Total 3,592 2,028 2,030 2,021 2,038 2,000 4,056 4,100 4,140 4,100
Sex
 Male 42.4 41.0 40.2 39.4 40.6 41.0 41.4 41.9 42.0 42.3
 Female 57.6 59.0 59.8 60.6 59.4 59.1 58.6 58.1 58.0 57.7
Age (yr)
 30-39a) 14.1 12.0 17.6 17.8 17.7 17.0 15.9 15.5 15.3 14.4
 40-49 35.9 41.1 34.6 34.8 35.5 35.6 34.9 33.7 33.5 33.0
 50-59 22.7 28.6 21.8 21.6 24.7 25.2 27.3 28.5 28.7 29.8
 60-69 17.3 15.6 19.1 21.9 16.4 16.4 16.8 16.1 16.2 16.8
 ≥ 70 10.2 2.7 6.9 3.9 5.8 5.9 5.2 6.2 6.4 6.0
Education (yr)
 ≤ 8 25.8 16.4 20.9 18.2 13.6 15.1 8.1 8.2 9.7 5.2
 9-11 15.6 16.1 15.1 14.3 16.6 11.3 10.9 10.6 8.7 7.2
 12-15 34.3 47.6 44.7 46.3 46.6 46.8 52.1 52.5 50.6 54.1
 ≥ 16 22.6 18.5 17.6 19.1 20.7 24.9 28.8 28.7 30.9 33.5
Monthly household incomeb) ($)c)
 ≤ 999 25.3 11.4 14.1 10.0 9.3 9.4 4.6 4.5 4.6 2.4
 1,000-2,999 39.0 57.1 53.1 50.5 48.8 45.0 37.6 37.8 33.3 22.5
 ≥ 3,000 18.8 29.7 29.9 38.7 40.3 44.5 57.7 57.7 62.0 75.1
Marital status
 Married 88.2 92.8 89.6 89.8 90.3 90.2 91.5 91.5 94.2 91.8
 Not married 1.6 2.1 2.2 2.8 2.5 3.6 3.0 3.1 2.3 2.5
 Otherd) 9.5 5.1 8.3 7.4 7.2 6.3 5.5 5.5 3.6 5.7
Residential area
 Metropolitan 46.8 47.4 47.4 47.5 46.5 46.6 44.3 45.2 44.4 44.3
 Urban 53.2e) 39.8 40.5 40.3 44.2 44.0 42.2 41.6 36.3 42.0
 Rural 12.7 12.1 12.2 9.3 9.4 13.5 13.1 19.4 13.6
Health insurance typeb)
 National Health Insurance 90.8 95.8 94.5 96.7 95.9 95.3 96.5 96.7 98.3 96.9
 Medical Aid Program 6.0 4.2 4.2 3.2 3.8 4.3 3.5 3.3 1.7 3.1

a) Restricted to women aged 30-39 years,

b) Some row sums are not 100% each year because of missing data,

c) 1 USD=1,000 KRW,

d) Others: divorced or separated,

e) The question related to residential area did not distinguish between urban and rural areas in 2004.

Table 3.
Cancer screening rates for five major cancers in Korea, 2004-2013
Survey year
APC (95% CI)
2004 2005 2006 2007 2008 2009 2010 2011 2012 2013
Lifetime screening rate (%)a)
 Stomach 52.0 48.5 53.5 55.3 65.0 65.1 76.7 76.2 77.9 80.0 3.9 (3.0 to 4.7)
 Liver 31.8 47.7 58.3 57.6 64.8 81.3 54.2 54.3 69.9 49.3 1.8 (-1.5 to 5.1)
 Colon and rectum 25.3 27.9 34.0 40.7 50.4 48.1 57.1 56.1 65.8 70.3 5.0 (4.3 to 5.7)
 Breast 55.9 57.4 60.2 66.4 72.7 78.1 79.5 79.0 82.9 83.1 3.4 (2.7 to 4.1)
 Cervix uteri 76.8 74.0 68.0 73.6 74.4 76.1 75.0 74.8 77.1 76.2 0.3 (-0.3 to 1.0)
Screening rate with recommendation (%)b)
 Stomachc) 39.2 39.4 43.3 45.6 53.5 56.9 65.1 64.6 70.9 73.6 4.2 (3.7 to 4.8)
  Upper endoscopy 32.4 32.9 33.5 37.8 44.8 49.3 58.9 58.1 63.3 64.4 4.2 (3.4 to 4.9)
  UGI series 13.0 13.1 15.2 20.4 21.1 19.5 24.9 25.3 26.4 24.9 1.7 (1.3 to 2.1)
 Liverd) 20.0 16.3 16.5 22.7 19.7 31.3 22.9 22.9 21.5 33.6 1.2 (0.1 to 2.4)
 Colon and rectume) 19.9 25.4 29.4 34.1 37.9 36.7 35.5 35.3 44.7 55.6 3.0 (1.8 to 4.1)
  Colonoscopy 14.4 12.4 16.8 19.5 19.1 23.4 23.3 23.6 30.1 35.2 2.2 (1.6 to 2.8)
  DCBE 2.8 4.1 5.3 8.7 7.0 6.1 6.1 6.0 3.8 7.0 0.2 (-0.3 to 0.6)
  FOBT 3.8 7.2 13.6 20.2 20.9 19.0 25.9 25.0 29.6 27.6 2.7 (1.9 to 3.5)
 Breastf) 33.2 38.4 40.6 45.8 49.3 55.2 61.6 60.4 70.9 59.7 3.7 (2.7 to 4.8)
 Cervix uterig) 58.3 57.0 54.9 57.0 59.9 63.9 62.9 62.4 67.9 67.0 1.3 (0.8 to 1.8)

APC, annual percent change; CI, confidence interval; UGI, upper gastrointestinal; DCBE, double-contrast barium enema; FOBT, fecal occult blood test.

a) Lifetime screening rate was defined as the proportion of respondents who ever underwent the screening test(s),

b) Screening rate with recommendation was defined as the proportion of respondents who fulfilled the screening recommendation criteria among the respondents in the targeted age group for the relevant cancer,

c) Respondents were restricted to men and women ≥ 40 years of age who had last undergone upper endoscopy or UGI series screening within a period of 2 years,

d) Respondents were restricted to men and women ≥ 40 years of age who were at high risk for liver cancer [hepatitis B virus surface antigen (+), hepatitis C virus antibody (+), or liver cirrhosis] who had last undergone screening with abdominal ultrasonography and serum alpha-fetoprotein within a period of 6 months,

e) Respondents were restricted to men and women ≥ 50 years of age who had last undergone screening with colonoscopy, DCBE, or FOBT within a period of 10, 5, or 1 year, respectively. However, before 2009, patients who underwent colonoscopy within a period of 5 years were considered to have undergone screening with recommendation,

f) Respondents were restricted to women ≥ 40 years of age who had last undergone screening with mammography within a period of 2 years,

g) Respondents were restricted to women ≥ 30 years of age who had last undergone screening with conventional cytology within a period of 2 years.

Table 4.
Cancer screening rates with recommendation by sex and age, 2004-2013
Survey year
2004 2005 2006 2007 2008 2009 2010 2011 2012 2013
Stomach Male 37.4 37.4 40.3 42.7 50.1 52.3 63.5 63.5 69.8 72.4
Female 40.9 41.2 46.2 48.3 56.8 61.5 66.6 65.6 72.0 74.8
40-49 36.8 34.2 37.0 39.3 47.3 47.3 59.6 59.1 65.1 72.6
50-59 43.0 42.8 45.4 48.5 57.5 62.7 69.6 68.8 76.2 74.6
60-69 43.6 47.0 54.5 53.6 59.6 69.5 69.9 69.0 75.0 74.4
≥ 70 31.0 38.9 37.9 40.5 57.6 55.6 62.2 63.6 67.7 72.2
Colon and rectum Male 21.5 28.0 31.2 36.9 39.3 36.5 38.5 37.4 46.7 56.3
Female 18.5 23.0 27.8 31.8 40.1 36.8 32.7 33.3 42.8 54.9
50-59 19.4 23.5 26.0 30.7 40.0 35.5 33.3 32.7 42.9 54.7
60-69 21.9 28.1 37.1 38.5 40.7 38.7 38.4 38.3 48.0 57.4
≥ 70 17.6 29.7 18.6 29.1 35.6 35.9 37.3 39.6 44.4 55.0
Breast 40-49 37.6 35.8 40.7 44.2 42.1 51.0 59.4 57.4 69.0 63.8
50-59 38.0 47.5 45.0 52.0 56.9 58.2 66.7 66.7 77.6 59.2
60-69 30.5 33.0 44.5 46.5 51.1 65.5 59.1 58.1 68.5 56.5
≥ 70 15.6 16.7 20.9 25.5 54.4 38.8 51.9 54.0 59.6 50.8
Cervix uteri 30-39 64.0 56.6 53.2 51.7 55.0 55.6 57.1 56.0 55.4 63.6
40-49 70.5 62.4 64.0 66.7 60.1 70.8 67.2 66.6 75.1 72.6
50-59 61.3 62.3 57.3 61.5 69.8 70.9 70.8 70.2 77.6 66.8
60-69 38.1 39.7 53.1 51.2 57.9 64.9 58.8 58.3 65.2 64.7
≥ 70 27.9 25.0 26.4 38.3 54.4 41.8 45.7 47.9 54.1 62.0
TOOLS
Similar articles