Abstract
Purpose
Chromogranin A (CgA) has been considered to be valuable not only in the diagnosis but also in monitoring the disease response to treatment. However, only a few studies have been published on this issue. We purposed to evaluate whether biochemical response using plasma CgA level is reliable in concordance with the clinical response of grade 1-3 nonfunctiong gastroenteropancreatic neuroendocrine tumors (GEP-NETs).
Materials and Methods
Between March 2011 and September 2013, a total of 27 cases in 18 patients were analysed, clinically and radiologically while serial CgA tests were also conducted during treatment. Tumor responses were defined by both Response Evaluation Criteria in Solid Tumors (RECIST) criteria ver. 1.1 and biochemical criteria based on the CgA level.
Results
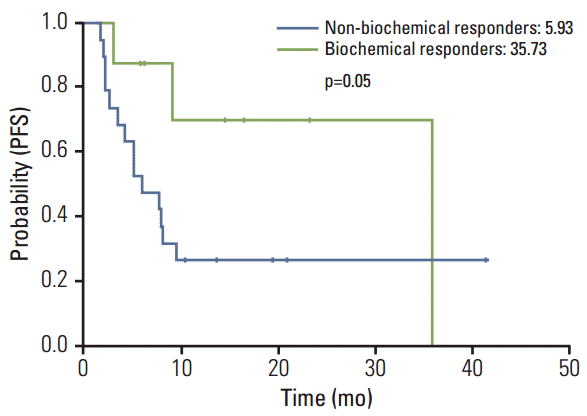
Among the 27 cases analysed, no difference in the basal CgA level was observed with regard to gender, primary tumor site, tumor grade (World Health Organization classification), liver metastasis, number of metastatic site, and line of chemotherapy. The overall response rate (RR) by RECIST criteria ver. 1.1 was six out of the 27 cases (22.2%) and eight out of the 27 cases (29.6%) for biochemical RR. The overall concordance rates of the response based on RECIST and biochemical criteria were 74%. In grades 1 and 2 GEP-NETs (n=17), the concordance rate of the disease control was 94.1%. There was a significant difference for progression-free survival (PFS) between responders and non-responder in accordance to biochemical criteria (35.73 months vs. 5.93 months, p=0.05).
Gastroenteropancreatic neuroendocrine tumors (GEPNETs) are rare malignant neoplasm with an incidence ranging from two to five cases/100,000/yr. Because it originates from the enterochromaffin serotonin-producing cell, it has a unique feature of hormone secretion and expression of distinctive differentiation markers [1-6].
Clinical features of GEP-NET are very heterogeneous and nonspecific. Some patients remain asymptomatic for several years, or complain of episodic flushing, abdominal pain, nausea, vomiting, and diarrhea. In most cases, due to the vagueness of symptoms, a diagnosis is delayed (3-10 years on average), with an increased risk of developing metastases. The ability of the imaging method to localize primary or metastatic site of GEP-NET also has some limitations. Most GEP-NETs are highly vascular, thus could easily be detected by a contrast enhanced computed tomography (CT); however, approximately 6% to 20% are hypovascular and often difficult to be evaluated by a CT scan or other imaging methods. GEP-NETs originating from jejunum and ileum are also often difficult to identify on an image due to their small size [7]. Therefore, non-invasive parameters, indicating GEP-PET, are needed for diagnosis, following-ups and prognosis.
Chromogranin A (CgA), a glycoprotein contained in secretion granules of neuroendocrine cells, is the most abundant granin in GEP-NETs and widely used as a circulating tumor marker, but only few studies have been published on the role of CgA in patients with GEP-PET, and the range of sensitivity were variously reported [8-10].
We investigated to evaluate whether biochemical response using serial plasma CgA is reliable in concordance with the tumor response based on Response Evaluation Criteria in Solid Tumors (RECIST) criteria in GEP-NETs irrespective of chemotherapeutic agents. Simultaneously, we analyzed the relationships between the CgA level and clinicopathological characteristics.
A total of 27 cases in 18 patients, who were pathologically diagnosed in GEP-NETs, were analysed between March 2011 and September 2013. For all cases, serial CgA was checked during the course of treatment. Non-functioning was defined to the absence of clinical syndromes of hormonal hypersecretion, such as hypoglycemia, peptic ulcer, diarrhea, steatorrhea, acromegaly, cushing’s syndrome, and gallstone. The following clinicopathological characteristics of all 18 patients were collected: age, sex, primary site, tumor grade in accordance to the 2010 World Health Organization (WHO) classification, liver metastasis, number of metastatic site, site of metastasis, and information of chemotherapy. Systemic chemotherapies for GEP-NET included octreotide, VIP (vincristine, ifosfamide, cisplatin), XELOX (capecitabine, oxaliplatin), EP (etoposide, cisplatin), pazopanib, sunitinib, everolimus, and XELIRI (capecitabine, irinotecan).
Biochemical efficacy was estimated according to the criteria proposed by the Italian Trials in Medical Oncology (ITMO) Group [1] for evaluating markers (biochemical response). Partial response (PR) was defined as ≥ 50% decrease in plasma CgA compared to the baseline CgA; stable disease (SD) was defined as a decrease < 50% or as an increase < 25%; and progressive disease (PD) was defined as an increase ≥ 25%. The level of CgA was determined from venous blood samples drawn into EDTA-containing tube after overnight fasting and collected before systemic treatment. The plasma CgA level was measured by CgA-RIA (Chromoa assay, CIS Bio International, Saclay, France) with a normal range of 27-94 ng/mL. Chromoa is based on sandwich enzyme-linked immunosorbent assay, using two monoclonal antibodies (the same antibodies as CGA-RIACT) directed against the central domain of the molecule (145-245), which is less sensitive to proteolysis.
The tumor size was measured by using a CT or magnetic resonance imaging by RECIST criteria ver. 1.1.
The CgA level is reported as the median value and the range. Group comparisons were performed using a nonparametric test of Mann-Whitney or Kruskal-Wallis, followed by a Dunn multiple comparison test, as appropriate. Comparisons of paired values were performed using a nonparametric test of Wilcoxon. The chi-square test and the Fisher exact test (for value less than 5) were employed to compare the sensitivity and rate of concordance in different groups. In all statistical tests, a 5% level of significance was used.
Progression-free survival (PFS) was measured as the time from the date of chemotherapy to the date of first documented disease progression or death. The PFS were estimated using the Kaplan-Meier method with log-rank analysis. A two-sided p-value of less than 0.05 was considered significant. All analyses were performed using SPSS ver. 19.0 (SPSS Inc., Chicago, IL).
The baseline characteristics of 27 cases of 18 patients are listed in Table 1. The median age was 56 years (range, 38 to 76 years). Pancreatic NETs account for 40.5% of GEP-NETs. The rectum was the second most common site of GEP-NET (22.2%) in this study. According to WHO classification, ten of the 27 cases (37%) were grade 3 neuroendocrine carcinoma. Grades 1 and 2 NETs were nine (33.3%) and eight (29.6%), respectively. Eighteen of the 27 patients had liver metastasis. Measurable lesions were found on CT images in 18 out of the 27 cases.
Among the 27 cases included in this study, no difference in the basal CgA level was observed in terms of gender, primary tumor site, tumor grade (WHO classification), liver metastasis, number of metastatic site, and line of chemotherapy with serial CgA monitoring. The plasma CgA level ranged from 33.18 to 895 ng/mL (Table 1).
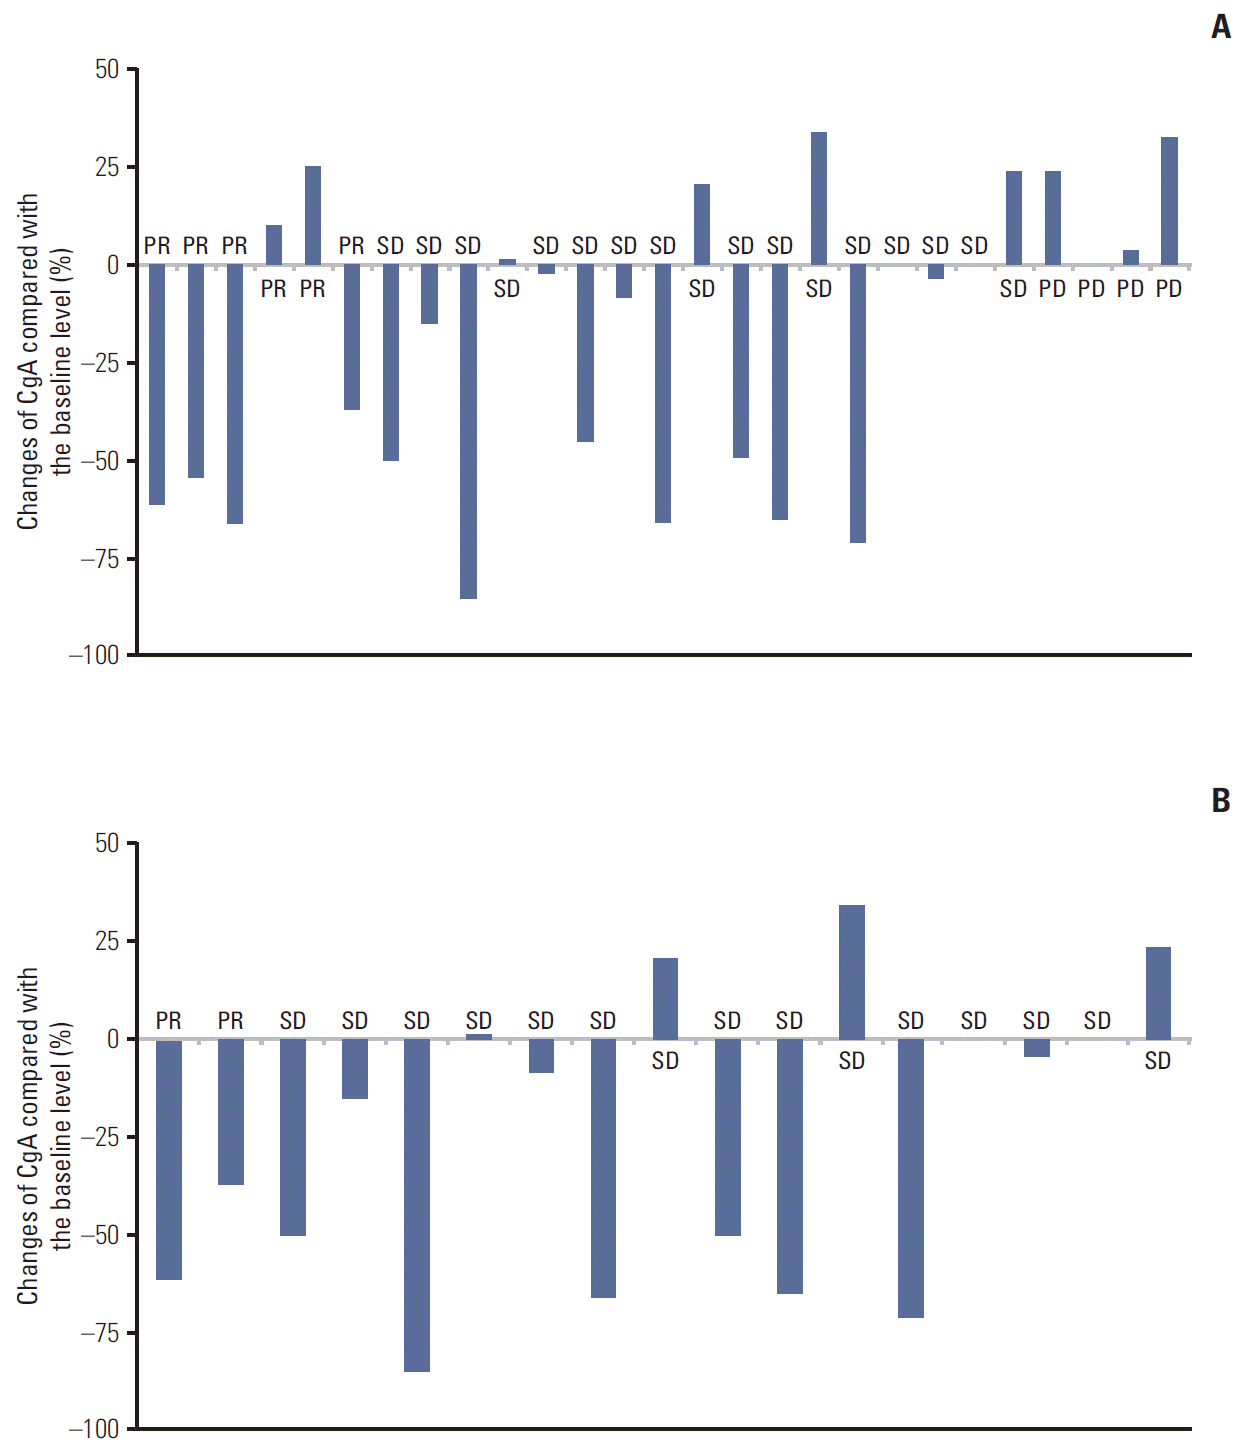
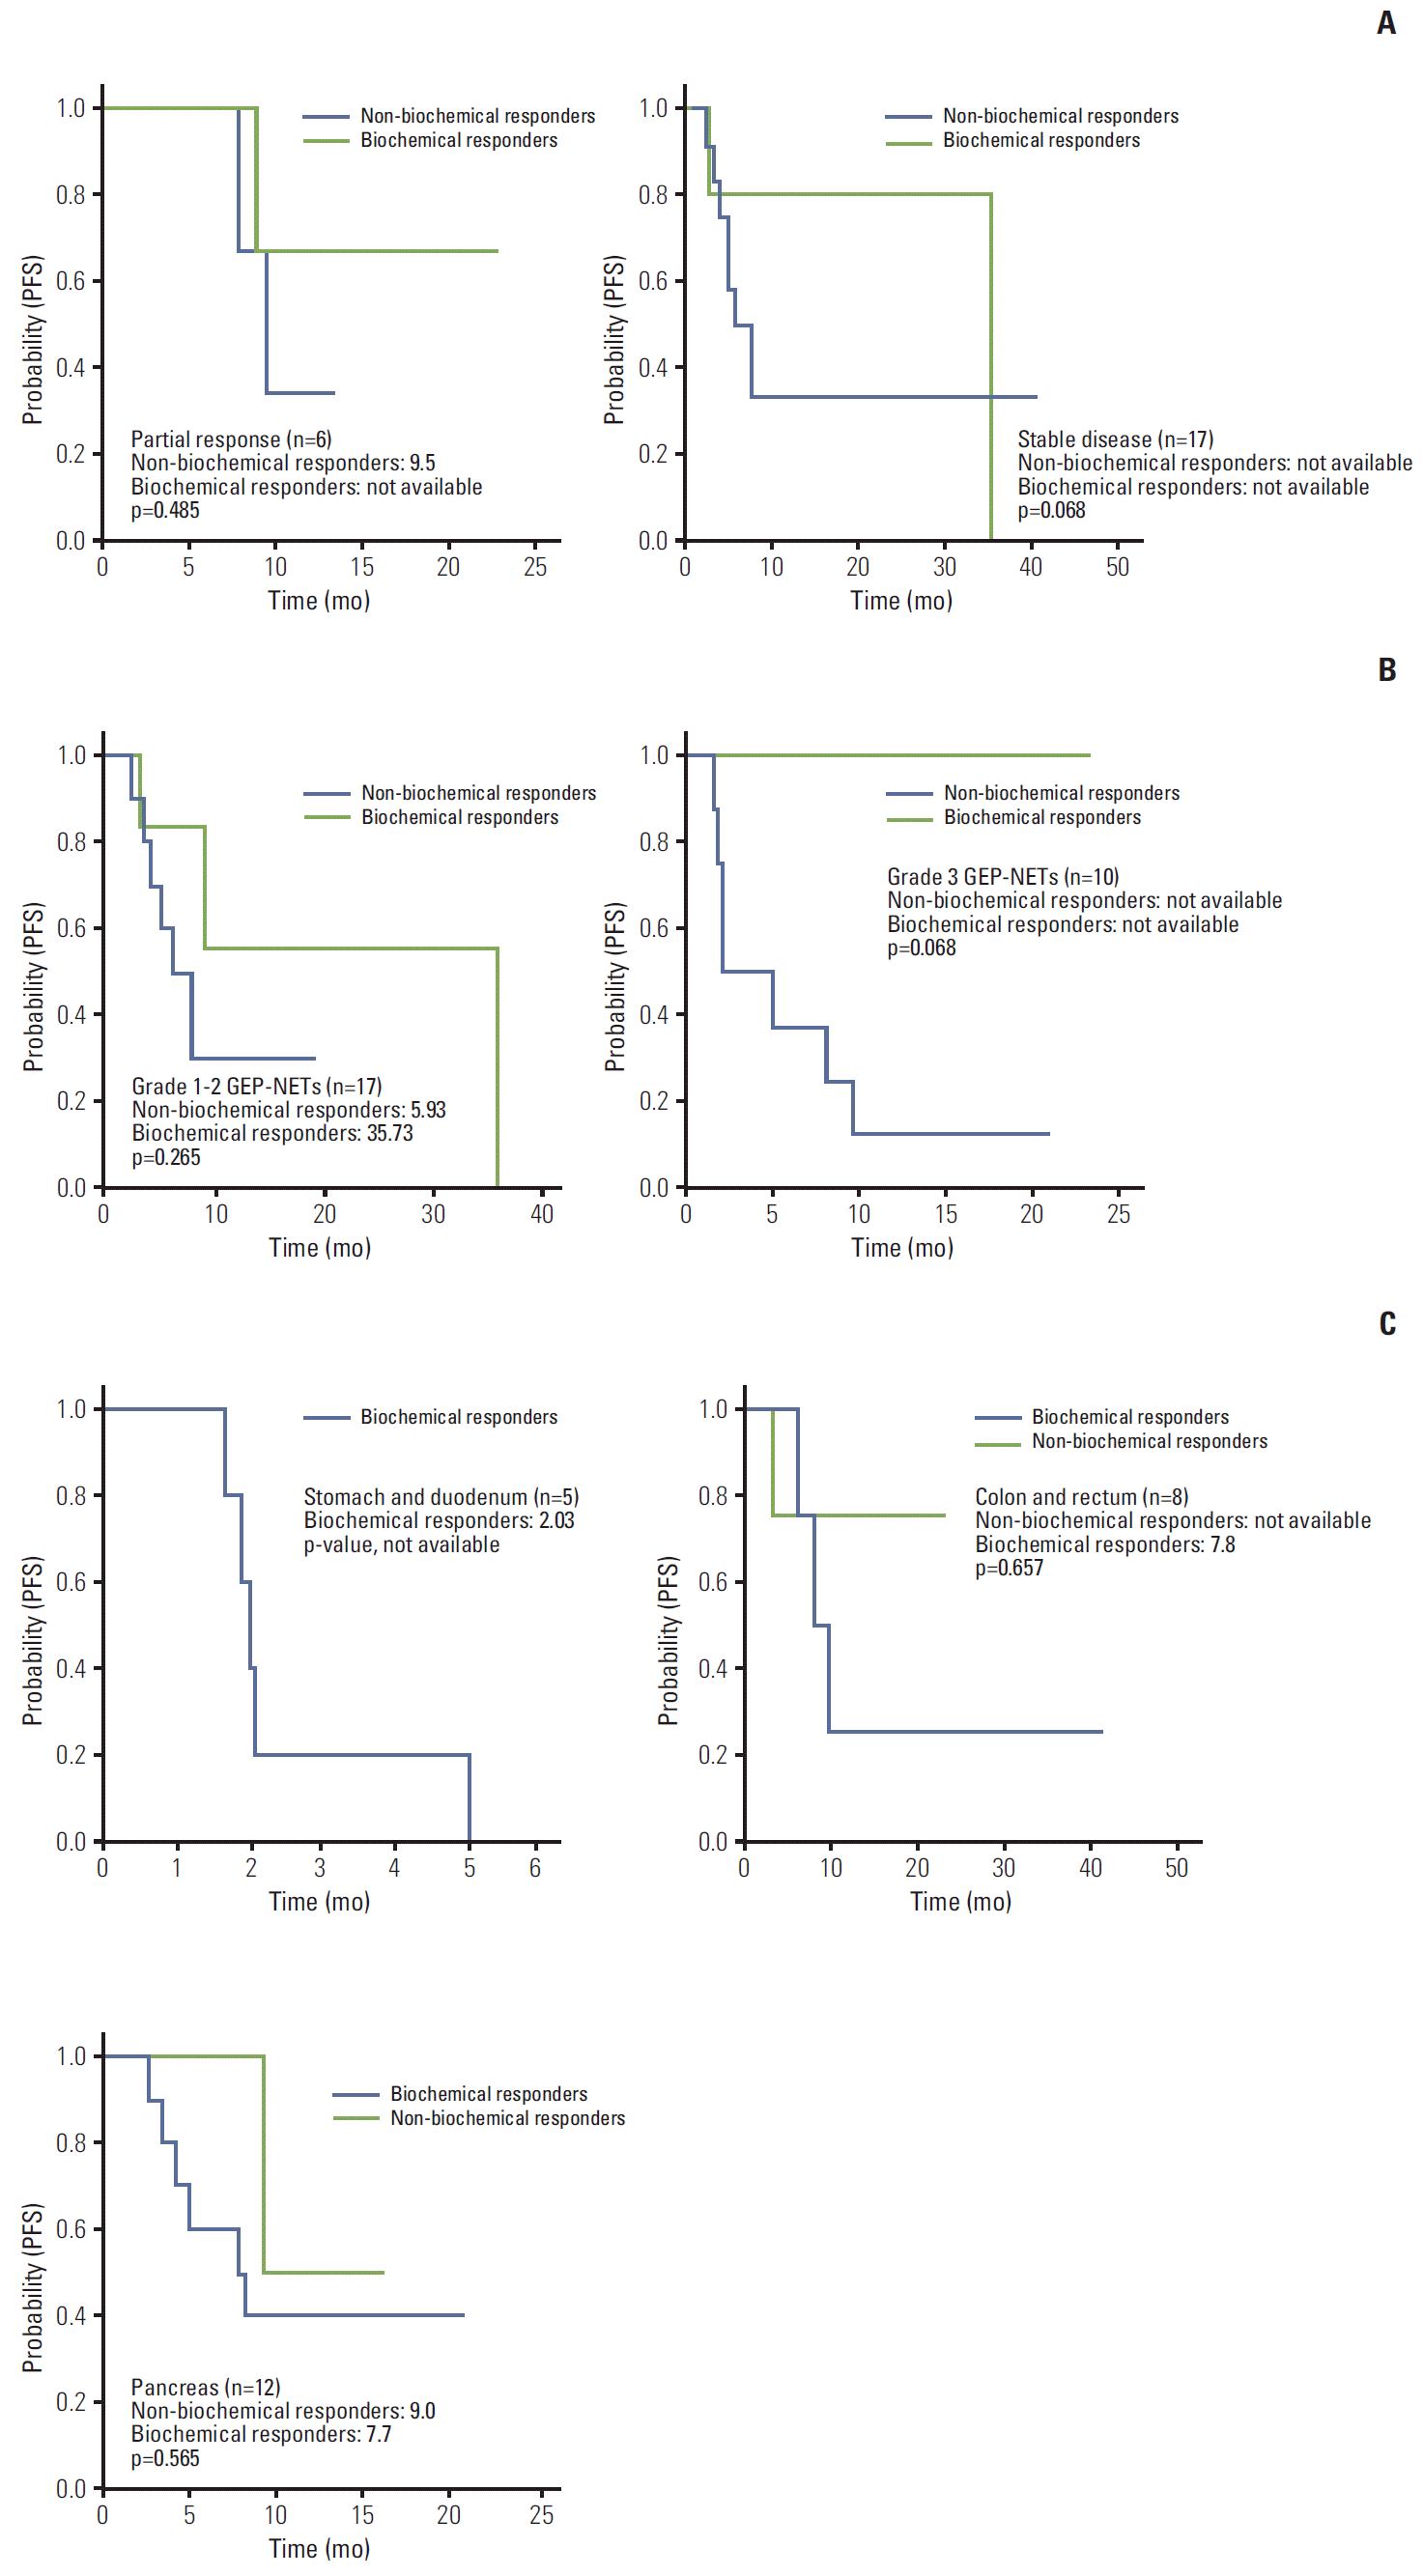
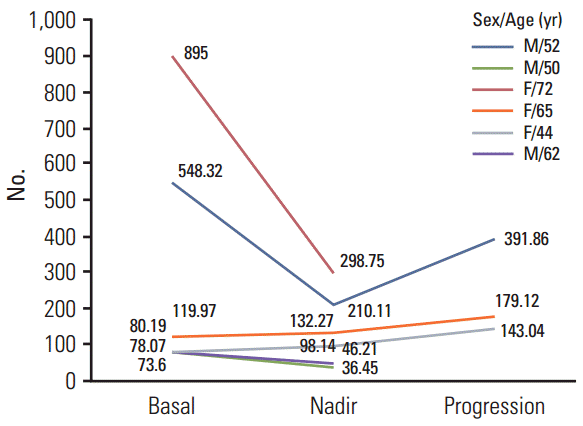
Biochemical and tumor responses to systemic therapy are shown in Tables 2 and 3. The overall response rate (RR) by RECIST criteria was six out of the 27 cases (22.2%) and eight out of the 27 cases (29.6%) for biochemical RR. The concordance of response between RECIST criteria and biochemical criteria were 74% (Table 3). Compared with the baseline values, a decrease of ≥ 50% in the CgA level were observed in three out of six cases (50%) with PR by RECIST criteria (Figs. 1A, 2). In only grades 1 and 2 GEP-NETs cases (n=17), the concordance of disease control between RECIST criteria and biochemical criteria were 94.1% (Fig. 1B). There was a significant difference for PFS between responders and non-responders (35.73 months vs. 5.93 months, p=0.05) based on the biochemical criteria (Fig. 3). A subgroup analysis of PFS between responders and non-responders, in accordance to RECIST response, tumor grade, and primary site, were not statistically significant, but showed longer PFS in the biochemical responder group (Fig. 4).
CgA is the most abundant granin in GEP-NETs and represents the best general marker in the tissue and blood. CgA expression generally correlates with the number of dense core granules in the neuroendocrine cells. The neuroendocrine cells secrete CgA and hormones during the secretory granule exocytosis process. The CgA level has been used to indicate neuroendocrine cell activity. Thus, CgA monitoring may be helpful in assessing the response to the different therapeutic options. In some studies, CgA was considered as a biomarker of response. However, it is still controversial whether serial CgA changes reflect tumor response for treatment. This study showed that the change of the CgA level was correlated with tumor response in nonfunctioning GEPNETs. Additionally, biochemical response based on serial CgA may be a predictive marker for PFS in GEP-NETs.
Changes in circulating CgA have been reported to represent tumor burden and treatment response. To our knowledge, there were no definite measuring criteria of plasma CgA for tumor response and conflicting result of sensitivity and specificity in accordance to treatment response were reported in the literature. Previous studies [2-10,18] showed acceptable sensitivity (54%-78%) and specificity (60%-86%) for regression and SD; Jensen et al. [14] also reported that plasma CgA concentration is important to disclose tumor progression with specificity and sensitivity, 86% and 86%, respectively [16,19,20]. In our study, the concordance of response between RECIST criteria and biochemical criteria was 74%. Compared with the baseline values, a decrease of ≥ 25% in the CgA level was observed in four out of six patients (66.7%) with PR based on RECIST criteria and an increased CgA levels was shown in all 4 patients with PD (100%). Our result is similar to the report of Chou et al. [17]. Among 11 patients available for serial CgA levels, all five patients with SD or partial remission had a more than 20% decrease in the CgA levels compared to the baseline value. All six patients with PD showed a less than 20% decrease or increase in the CgA levels. Several other studies also showed the possibility of CgA as a biochemical marker of treatment response (Table 4).
High-baseline CgA value has been considered to be an independent poor prognostic marker for GEP-NETs in previous studies [21-25]. However, whether changes of the CgA levels compared to the baseline values could predict the prognosis has not been established. In this study, there was a significant difference for PFS between the responders and non-responders for biochemical criteria (p=0.05). It suggested that a decrease in the CgA levels from the baseline levels may be an important predictive marker for survival in GEP-NETs.
This study was a retrospective analysis with small sample size, and heterogeneous patient population. The CgA levels have been affected from a diverse array of diseases. Moreover, a recognized international standard for CgA assay is not available and variations in assay types may influence results. Nevertheless, this analysis identified the usefulness of serial CgA monitoring as a biomarker that predicts treatment response and survival.
ACKNOWLEDGMENTS
This work was supported by grants from 20 by 20 project of Samsung Medical Center (GF01140111).
References
1. Yao JC, Hassan M, Phan A, Dagohoy C, Leary C, Mares JE, et al. One hundred years after "carcinoid": epidemiology of and prognostic factors for neuroendocrine tumors in 35,825 cases in the United States. J Clin Oncol. 2008; 26:3063–72.

2. Modlin IM, Oberg K, Chung DC, Jensen RT, de Herder WW, Thakk er RV, et al. G astroenteropan creatic ne uroendocrine tumours. Lancet Oncol. 2008; 9:61–72.
3. Delaunoit T, Neczyporenko F, Rubin J, Erlichman C, Hobday TJ. Medical management of pancreatic ne uroendocrine tumors. Am J Gastroenterol. 2008; 103:475–83.
4. Ramage JK, Davies AH, Ardill J, Bax N, Caplin M, Grossman A, et al. Guidelines for the management of gastroenteropancreati c neuroendocrine (inc luding carcino id) t umours. Gut. 2005; 54 Suppl 4:iv1–16.
5. Modlin IM, Moss SF, Chung DC, Jensen RT, Snyderwine E. Priorities for improving the management of gastroenteropancreatic neu roendocrin e tumors. J Natl Cancer Inst. 2008; 100:1282–9.
6. Warner RR. Enteroendocrine tumors other than carcinoid: a revie w of clinic ally signif icant advances . Gast ro ente ro logy. 2005; 128:1668–84.
7. Ganeshan D, Bhosale P, Yang T, Kundra V. Imaging features of carcino id tumors of t h e gastroi n testinal tra ct. AJR Am J Roentgenol. 2013; 201:773–86.
8. Campana D, Nori F, Piscitelli L, Morselli-Labate AM, Pezzilli R, Corinaldesi R, et al. Chromogranin A: is it a useful marker of neuroendocrine tumors? J Clin Oncol. 2007; 25:1967–73.

9. Nobels FR, Kwekkeboom DJ, Bouillon R, Lamberts SW. Chromogranin A: its clinical value as marker of neuroe n docr ine tumours. Eur J Clin Invest. 1998; 28:431–40.
10. O'Connor DT, Deftos LJ. Secretion of chromogranin A by peptide-producing endocrine neoplasms. N Engl J Med. 1986; 314:1145–51.
11. Welin S, Stridsberg M, Cunningham J, Granberg D, Skogseid B, Oberg K, et al. Elevated plasma chromogranin A is the first indica tion of recurrence in radically operated midgut carcinoid tumors. Neuroendocrinology. 2009; 89:302–7.
12. Sondenaa K, Sen J, Heinle F, Fjetland L, Gudlaugsson E, Syversen U. Chromogranin A, a marker of the therapeutic success of resection of neuroendocrine liver metastases: preliminary report. World J Surg. 2004; 28:890–5.
13. Baudin E , Gigliotti A, Ducreux M, Ropers J, Comoy E, Sabourin JC, et al. Neuron-specific enolase and chromogranin A as markers of n euroendocrine tumours. Br J Cancer. 1998; 78:1102–7.
14. Jensen KH, Hilsted L, Jensen C, Mynster T, Rehfeld JF, Knigge U. Chromogranin A is a sensitive mark er of progressio n or regressio n in ileo -cecal neuroendocri n e tumo rs . Scand J Gastroenterol. 2013; 48:70–7.
15. Walter T, Chardon L, Chopin-laly X, Raverot V, Caffin A G, Chayvialle JA, et al. Is the combination of chromogranin A and pancreatic polypeptide serum determinations of interest in the diagnosis and follow-up of gastro-entero-pancreatic neuroendocrine tumours? Eur J Cancer. 2012; 48:1766–73.
16. Nehar D, Lombard-Bohas C, Olivieri S, Claustrat B, Chayvialle JA, Penes MC, et al. Interest of chromogranin A for diagnosis and follow-up of endocrine tumours. Clin Endocrinol (Oxf). 2004; 60:644–52.

17. Chou WC, Hung YS, Hsu JT, Chen JS, Lu CH, Hwang TL, et al. Chromogranin A is a reliable biomarker for gastroenteropancreatic neuroendocrine tumors in an Asian population of patients. Neuroendocrinology. 2012; 95:344–50.

18. Bajetta E, Zilembo N, Di Bartolomeo M, Di Leo A, Pilotti S, Bochicchio AM, et al. Treatment of metastatic carcinoids and other neuroendocrine tumors with recombinant interferon-alpha-2a. A study by the Italian Trials in Medical Oncology Group. Cancer. 1993; 72:3099–105.

19. Bajetta E, Ferrari L, Martinetti A, Celio L, Procopio G, Artale S, et al. Chromogranin A, neuron specific enolase, carcinoembryonic antigen, and hydroxyindole acetic acid evaluation in patients with neuroendocrine tumors. Cancer. 1999; 86:858–65.

20. Abou-Saif A, Gibril F, Ojeaburu JV, Bashir S, Entsuah LK, Asgharian B, et al. Prospective study of the ability of serial measurements of serum chromogranin A and gastrin to detect changes in tumor burden in patients with gastrinomas. Cancer. 2003; 98:249–61.

21. Arnold R, Wilke A, Rinke A, Mayer C, Kann PH, Klose KJ, et al. Plasma chromogranin A as marker for survival in patients with metastatic endocrine gastroenteropancreatic tumors. Clin Gastroenterol Hepatol. 2008; 6:820–7.

22. Nobels FR, Kwekkeboom DJ, Coopmans W, Schoenmakers CH, Lindemans J, De Herder WW, et al. Chromogranin A as serum marker for neuroendocrine neoplasia: comparison with neuron-specific enolase and the alpha-subunit of glycoprotein hormones. J Clin Endocrinol Metab. 1997; 82:2622–8.
23. Cimitan M, Buonadonna A, Cannizzaro R, Canzonieri V, Borsatti E, Ruffo R, et al. Somatostatin receptor scintigraphy versus chromogranin A assay in the management of patients with neuroendocrine tumors of different types: clinical role. Ann Oncol. 2003; 14:1135–41.

Fig. 1.
Association of treatment responses with percentage changes in the chromogranin A (CgA) levels compared to the baseline levels in grades 1-3 (A) and grades 1-2 (B) cases.

Fig. 4.
Subgroup analysis of progression-free survival (PFS) between responders and non-responders of chromogranin A according to Response Evaluation Criteria in Solid Tumors criteria (A), tumor grade (B), and primary sites (C). GEP-NETs, gastroenteropancreatic neuroendocrine tumors.

Table 1.
Baseline CgA level according to clinical characteristics in 27 neuroendocrine tumor-cases (18 patients)
Table 2.
The treatment-evaluation by RECIST criteria and by biochemical (CgA level) response criteria
| Response | RECIST criteria | Biochemical criteria | ||
|---|---|---|---|---|
| Complete | - | - | ||
| Partial | 6 (22.2) | 8 (29.6) | ||
| Stable disease | 17 (63.0) | 16 (59.3) | ||
| Progressive diseas | 4 (14.8) | 3 (11.1) |
Table 3.
Comparison of response by RECIST criteria and biochemical criteria (CgA level) in 27 cases
| Factor |
RECIST criteria |
Total | ||
|---|---|---|---|---|
| Responder | Non-responder | |||
| Biochemical criteria | Responder | 3 | 5 | 8 |
| Non-responder | 3 | 16 | 19 | |
| Total | 6 | 21 | 27 | |
Table 4.
Comparison of CgA change according to treatment response in other studies
| Serum CgA determination | CgA increase | CgA stable | CgA decrease | Concordance between event and CgA-change | ||
|---|---|---|---|---|---|---|
| Welin et al. [11] | Recurred midgut carcinoid tumors | CgA > 4 nmol/L | 28/33 (85) | - | - | - |
| Sondenaa et al. [12] | After surgical resection of midgut carcinoid tumors | CgA > 30 nmol/L | 7/7 (100) | - | - | - |
| Baudin et al. [13] | After disease progression | CgA > 100 U/I | 5/6 (85) | - | - | - |
| Jensen et al. [14] | Median F/U: 12 mo | SD: within ± 25% | 83/97 (85) | 204/279 (73) | 39/50 (78) | 76% |
| PD > +25% | ||||||
| PR < -25% | ||||||
| Walter et al. [15] | Median F/U: 27 mo | SD: within ± 50% | 28/50 (56) | 22/47 (47) | 7/15 (46) | 51% |
| PD > +50% | ||||||
| PR < -50% | ||||||
| Nehar et al. [16] | Median F/U: 33 mo | SD: within ± 25% | 89% | 78% | 79% | 80% |
| PD > +25% | ||||||
| PR < -25% | ||||||
| Chou et al. [17] | Asian patients, median F/U: 12 mo | Responder: decrease ≥ 20% | 6/6 (100) | 5/5 (100) | 100% | |
| Non-responder: decrease < 20% |


 PDF
PDF Citation
 Print
Print


 XML Download