Introduction
Materials and Methods
1. Study design
2. Patients
3. Study treatments
Table 1.
| Toxicity | Definition |
|---|---|
| Missed/delayed doses | Miss > 3 consecutive days of capecitabine and/or > 5 consecutive days of axitinib per cycle due to treatment-related toxicity |
| Delay > 2 weeks in administration of cycle 2 due to inadequate recovery from toxicity in cycle 1 | |
| Hematologic | Grade 4 neutropenia lasting ≥ 7 days |
| Grade ≥ 3a) febrile neutropenia | |
| Grade ≥ 3a) neutropenic infection | |
| Grade 4 thrombocytopenia | |
| Grade 3 thrombocytopenia with active bleeding ≥ 0.5 teaspoon/day hemoptysis without resolution to baseline within 7 days | |
| Non-hematologic | Grade 2 proteinuria |
| Grade 3 or 4 nausea/vomiting and/or diarrhea despite optimal use of antiemetics and antidiarrheals | |
| Grade 3 toxicityb) lasting ≥ 7 days | |
| Grade 4 toxicity |
4. Assessments
5. Statistical analysis
Results
1. Patients and treatment
Table 2.
| Characteristic | Value |
|---|---|
| Gender (male/female) | 16 (72.7)/6 (27.3) |
| Age (yr) | 59.3 (35-72) |
| Weight (kg) | 56.6 (44.5-72.1) |
| ECOG PS | |
| 0 | 6 (27.3) |
| 1 | 16 (72.7) |
| Histology | |
| Intestinal adenocarcinoma | 5 (22.7) |
| Diffuse adenocarcinoma | 4 (18.2) |
| Mixed adenocarcinoma | 3 (13.6) |
| Other | 10 (45.5) |
| Histologic grade | |
| Poorly differentiated | 12 (54.5) |
| Moderately differentiated | 6 (27.3) |
| Well differentiated | 3 (13.6) |
| Not assessed | 1 (4.5) |
| Prior cancer therapy | |
| Surgery | 13 (59.1) |
| Radiation | 0 |
| Adjuvant systemic | 3 (13.6) |
| Metastatic sitesa) | |
| Distant lymph node | 11 (50.0) |
| Regional lymph node | 8 (36.4) |
| Liver | 8 (36.4) |
| Peritoneum | 6 (27.3) |
| Lung | 1 (4.6) |
2. DLTs and MTD
3. Adverse events
Table 3.
| Variable |
Axitinib+cisplatin+capecitabine (n=22) |
|
|---|---|---|
| All grades | Grade 3/4 | |
| Adverse eventsa) | ||
| Decreased appetite | 20 (90.9) | 4 (18.2) |
| Nausea | 17 (77.3) | 2 (9.1) |
| Fatigue | 17 (77.3) | 1 (4.5) |
| Hypertension | 16 (72.7) | 8 (36.4) |
| Stomatitis | 16 (72.7) | 4 (18.2) |
| Diarrhea | 12 (54.5) | 2 (9.1) |
| Dysphonia | 12 (54.5) | 0 |
| Palmar-plantar erythrodysesthesia | 12 (54.5) | 1 (4.5) |
| Hypothyroidism | 10 (45.5) | 0 |
| Constipation | 9 (40.9) | 0 |
| Vomiting | 7(31.8) | 1 (4.5) |
| Abdominal pain, upper | 6 (27.3) | 0 |
| Abdominal pain | 5 (22.7) | 1 (4.5) |
| Headache | 5 (22.7) | 1 (4.5) |
| Hiccups | 5 (22.7) | 0 |
| Laboratory abnormalitiesa) | ||
| Hematology | ||
| Anemia | 21 (95.5) | 2 (9.1) |
| Thrombocytopenia | 17 (77.3) | 4 (18.2) |
| Neutropenia | 17 (77.3) | 8 (36.4) |
| Leukopenia | 15 (68.2) | 3 (13.6) |
| Lymphopenia | 13 (59.1) | 0 |
| Chemistry | ||
| Hyperbilirubinemia | 10 (45.5) | 1 (4.5) |
| Hypoalbuminemia | 10 (45.5) | 1 (4.5) |
| Alkaline phosphatase elevation | 9 (40.9) | 0 |
| ALT elevation | 9 (40.9) | 0 |
| AST elevation | 7 (31.8) | 2 (9.1) |
| Creatinine elevation | 7 (31.8) | 0 1 |
| Hyperglycemia | 20 (90.9) | 2 (9.1) |
| Hypoglycemiab) | 6 (28.6) | 0 |
| Hypocalcemia | 19 (86.4) | 0 |
| Hypophosphatemia | 8 (36.4) | 3 (13.6) |
| Hyponatremia | 15 (68.2) | 2 (9.1) |
| Hypokalemia | 7 (31.8) | 2 (9.1) |
| Hyperkalemia | 4 (18.2) | 1 (4.5) |
| Hypermagnesemia | 11(50.0) | 3 (13.6) |
| Hypomagnesemiac) | 9 (47.4) | 0 |
4. Pharmacokinetics
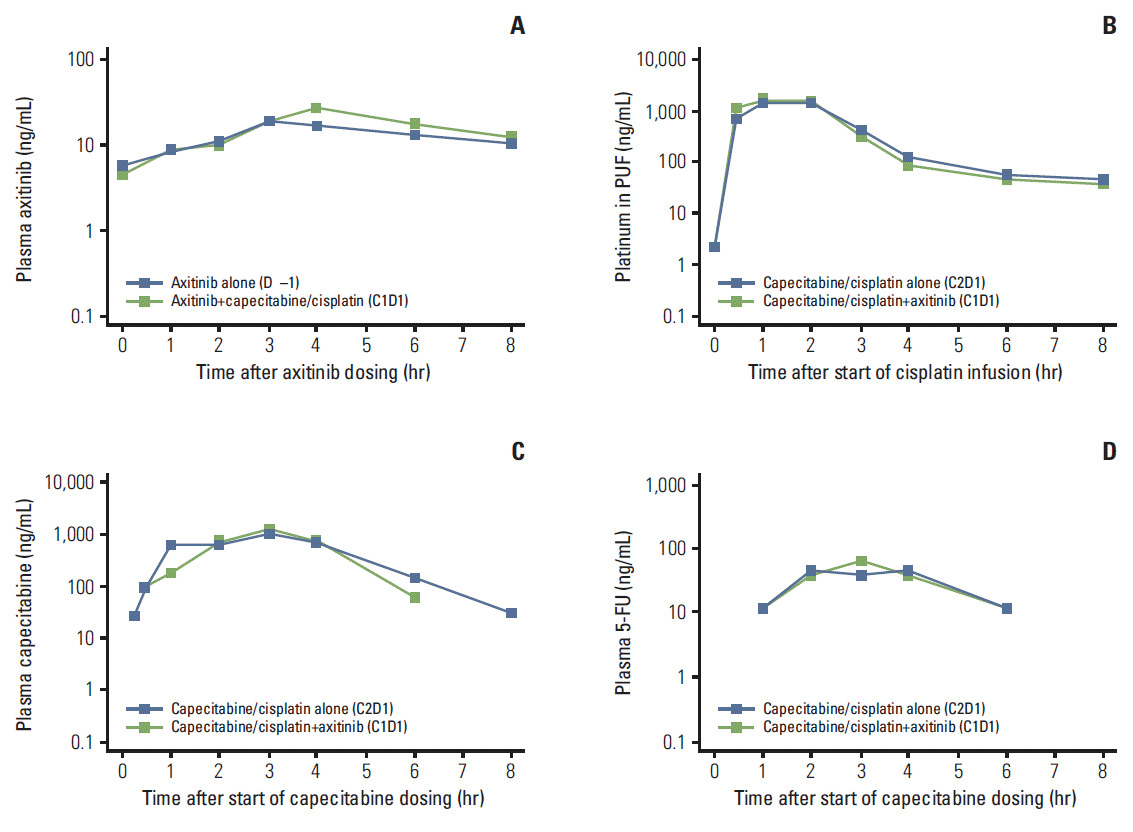
 | Fig. 2.Median plasma concentration-time profiles, semi-log scale, for steady-state axitinib (A), cisplatin (platinum in plasma ultrafiltrate [PUF]) (B), capecitabine (C), and 5-fluorouracil (5-FU) (D). The lower limit of quantification was 0.500 ng/mL for axitinib, 1.00 ng/mL for platinum in PUF, 20.0 ng/mL for capecitabine, and 5.00 ng/mL for 5-FU. Two patients were excluded from median concentration profile plots for platinum in PUF, capecitabine, and 5-FU because cycle 2 (C2), day 1 (D1) pharmacokinetic samples were not collected. |
Table 4.
| Variable |
Geometric mean (95% CI) (except where noted) |
|||||
|---|---|---|---|---|---|---|
| Cmax (ng/mL)a) | AUC24 (ng·hr/mL)a),b) | Tmax (hr)c) | CL/F (L/hr)d) | Vz/F (L)d) | t1/2 (hr)e) | |
| Axitinibf) (n=10) | ||||||
| Alone | 16.1 (9.94-26.1) | 206 (109-389) | 3.98 (0.00-7.97) | 48.6 (25.7-91.7) | 345 (202-588) | 5.76 (64) |
| +Cisplatin/capecitabine | 24.3 (15.0-39.4) | 266 (141-502) | 4.00 (1.00-6.00) | 37.7 (20.0-71.2) | 172 (101-293) | 3.50 (53) |
| Cisplating) (+capecitabine) (n=8) | ||||||
| Alone | 1,665 (1,407-1,970) | 3,979 (3,578-4,426) | 2.00 (1.00-2.20) | 30.9 (26.0-36.8) | 55.4 (41.1-74.5) | 1.25 (8) |
| +Axitinib | 1,865 (1,576-2,207) | 3,990 (3,588-4,438) | 1.02 (0.97-2.33) | 32.5 (27.4-38.6) | 70.3 (52.2-94.7) | 1.61 (48) |
| Capecitabine (+cisplatin) (n=8) | ||||||
| Capecitabineh) | ||||||
| Alone | 5,256 (3,155-8,754) | 14,307 (8,284-24,710) | 2.45 (0.50-4.00) | 218 (118-400) | 191 (89.1-409) | 0.71 (62) |
| +Axitinib | 2,275 (1,366-3,789) | 8,229 (4,764-14,211) | 3.12 (0.50-4.02) | 368 (201-677) | 425 (198-911) | 0.89 (58) |
| 5-FUi) | ||||||
| Alone | 220 (132-367) | 665 (382-1,155) | 2.50 (0.50-4.07) | - | - | 1.11 (41) |
| +Axitinib | 91.0 (54.6-152) | 493 (283-856) | 2.62 (0.50-4.02) | - | - | 1.05 (48) |
PK, pharmacokinetic; 5-FU, 5-fluorouracil; CI, confidence interval; Cmax, maximum observed plasma concentration; AUC24, area under the curve from time 0 to 24 hours; Tmax, time at which Cmax was observed; CL/F, apparent oral clearance; Vz/F, apparent volume of distribution during elimination phase; t1/2, terminal half-life.
b) AUC from time 0 extrapolated to infinite time (AUCinf) for total platinum in plasma ultrafiltrate,
d) Systemic clearance (CL) and volume of distribution during elimination phase (Vz) for platinum in plasma ultrafiltrate,
f) One patient was excluded from summary statistics for AUC24, CL/F, Vz/F, and t1/2 because of a non-estimable half-life,
g) PK parameters are for platinum in plasma ultrafiltrate. Two patients were excluded from summary statistics for all PK parameters because PK samples from matching cycle 1 and cycle 2 were not completed. One patient was excluded from summary statistics for AUCinf, CL, Vz, and t1/2 due to non-estimable half-life,


 PDF
PDF Citation
 Print
Print


 XML Download