Abstract
Purpose
South Korea has the highest incidence rate of thyroid cancer in the world, and the incidence rate continues to increase. The aim of this study was to determine the age-period-cohort effects on the incidence of thyroid cancer in Korea.
Materials and Methods
Using the Korean National Cancer registry database, age-standardized incidence rates and annual percent changes (APCs) in thyroid cancer according to sex and histologic type were analyzed between 1997 and 2011. Age-period-cohort models were applied using an intrinsic estimator method according to sex.
Results
In both men and women, the incidence of thyroid cancer showed a sharp increase from 1997 through 2011. Among the histologic types, papillary carcinoma showed the greatest increase, with APCs of 25.1% (95% confidence interval [CI], 22.7% to 27.5%) in men and 23.7% (95% CI, 21.9% to 25.5%) in women, whereas anaplastic carcinoma did not show a significant increase in either sex. An increase in overall thyroid cancer incidence over time was observed in all birth cohorts. An age-period-cohort model indicated a steeply increasing period effect, which increased prominently from 1997 to 2011 in both men and women. The age effect showed an inverted U-shaped trend. The cohort effect tended to show a slight increase or remain constant from 1952 to 1977, followed by a decrease.
The incidence rate of thyroid cancer in Korea is the highest in the world [1], and showed an abrupt increase to 24.2% per year, from 6.3 cases per 100,000 in 1999 to 52.7 cases per 100,000 in 2010 [2]. Notably, this rapid increase has been observed in many other countries [3].
However, to date it is unclear whether the increased rate is real increase in incidence of thyroid cancer or a result of improved diagnostic scrutiny [4]. In several developed countries, widespread use of ultrasonography is known to be related to the increase of thyroid cancer. On the other hand, increased incidence rates have been reported among young adolescents and adults in the United States [5], England [6], and Canada [7]. In Korea, thyroid cancer is the most common cancer type among adolescents and young adults aged 15-34 years [2], which indicates that other risk factors, such as ionizing radiation [8], and high body mass index (BMI) [9], may have contributed to this increase.
Age-period-cohort models are useful for separating the period and cohort effects from temporal trends in disease incidence rates [10]. The age effect is a surrogate marker for the accumulation of oncogenic events or substances. The period effects comprise factors that simultaneously affect all age groups, owing to changes in screening practices, diagnostic skills, and disease classification, among other factors. Cohort effects describe temporal changes among groups born during the same period, changes in lifestyle, and exposure to risk factors in different generations.
Therefore, the aim of this study was to analyze the temporal changes in age-standardized incidence rates (ASRs) of thyroid cancer by sex and histologic type using an ageperiod-cohort model to determine the effect of each component on the rapid increase in incidence of thyroid cancer in Korea.
Data on thyroid cancer incidence from 1997 to 2011 were collected from the Korea National Cancer Incidence Database (KNCI DB) [2]. KNCI DB data included age, sex, geographical region, histological type, date of diagnosis, primary site, and first treatment modality. The histological subtypes of thyroid cancer were classified according to the International Classification of Diseases for Oncology, 3rd edition (ICD-O-3) [11], as papillary carcinoma (ICD-O-3 codes 8050, 8260, 8340-8344, 8350, and 8450-8460), medullary carcinoma (ICD-O-3 codes 8345 and 8510-8513), follicular carcinoma (ICD-O-3 codes 8290 and 8330-8335), anaplastic carcinoma (ICD-O-3 codes 8020-8035), other specified carcinoma (ICD-O-3 codes 8337, 8346, and 8347), and unspecified carcinoma (ICD-O-3 codes 8000-8005). The cancer cases were converted according to International Classification of Diseases for Oncology, 10th edition (ICD-10) code in our anaysis [12].
A total of 227,240 patients (35,797 men, 15.8% and 191,443 women, 84.2%) were diagnosed with thyroid carcinoma from 1997 to 2011. Papillary carcinoma was the most frequent histologic type (94.2%), followed by follicular carcinoma (2.7%), medullary carcinoma (0.6%), and anaplastic carcinoma (0.3%).
The data source for thyroid cancer mortality from 1997 to 2011 was obtained from Statistics Korea [13]. Mortality data was coded and classified according to ICD-10 [12].
To investigate the association between the dissemination of ultrasonography and age-standardized incidence of thyroid cancer by year, the numbers of ultrasonography from 2000 to 2011 were obtained from the National Medical Care Resources and Utilization survey [14] and Statistics Korea [13]. Ultrasonographs per 100,000 were calculated as the numbers of ultrasonography divided by corresponding mid-year population [13].
ASRs were calculated by multiplying the 5-year interval age-specific incidence rate by the weights of the corresponding age groups of the standard population, defined as the world standard population. The annual percent change (APC) in ASR was calculated for each histologic type of thyroid cancer and by sex using the formula: [exp(β)−1]×100, where the regression coefficient (β) was estimated with linear regression between logarithmic-transformed ASRs.
For the age-period-cohort model analysis, we analyzed only thyroid cancer patients aged 20 to 79 years because of the comparatively fewer cancer cases in subjects under 20 and above 80 years. The age groups were classified according to 5-year intervals (from 20-24 to 75-79 years) and the study period was divided into three 5-year intervals: 1997-2001, 2002-2006, and 2007-2011.
We assumed that the cancer incidence would exhibit a Poisson distribution and consequently used the intrinsic estimator (IE) method [15] to estimate the independent effects of age, period, and cohort. The goodness-of-fit of the model was evaluated by the log-likelihood function and the Akaike information criterion (AIC). To determine the explanatory powers of age, period, and cohort effects, we utilized the adjusted R-squared method suggested by Mittlbock and Waldhor [16] for a Poisson regression model. Statistical analyses were performed using Stata ver. 12.0 (StataCorp LP, College Station, TX) and SAS ver. 9.2 (SAS Institute, Cary, NC) software, with the IE model generated by the “apc_ie” command on Stata.
In addition, we utilized scatter plots and linear regression analysis to examine the association between the number of ultrasonography per 100,000 and the age-standardized incidence of thyroid cancer by year.
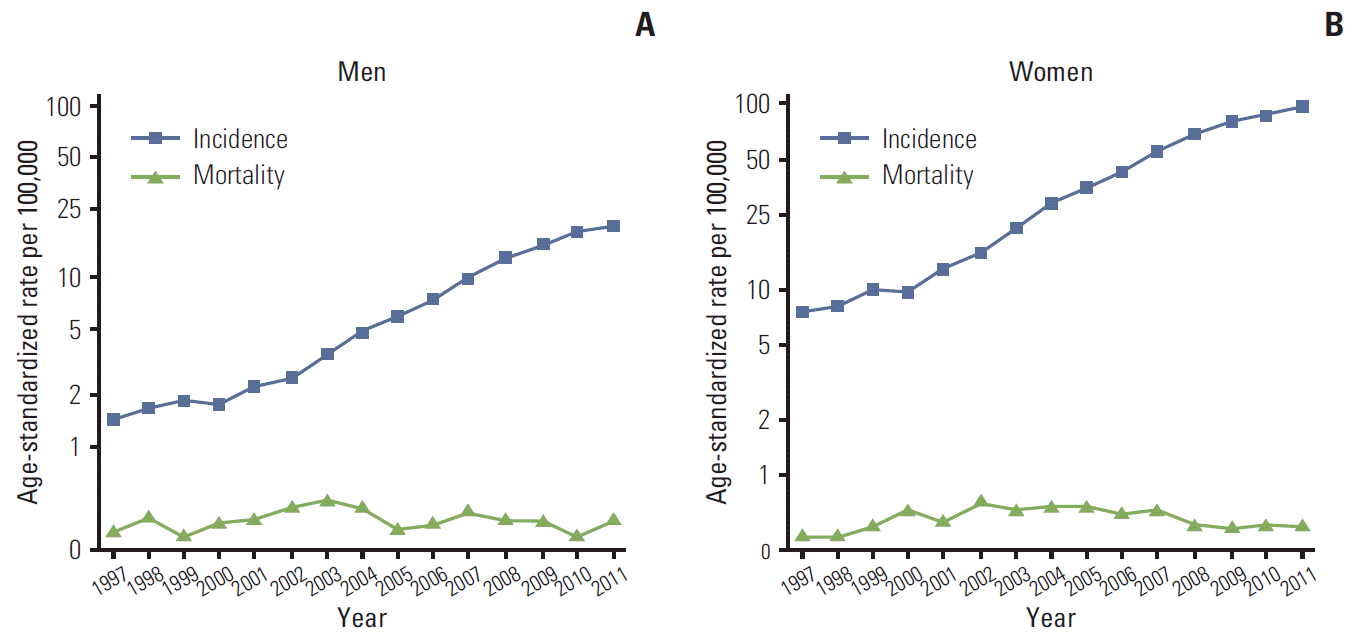
Fig. 1 show the trends for the incidence of thyroid cancer and the mortality rates in men and women, respectively. The incidence rates of thyroid cancer increased sharply from 1997 to 2011 in both men (APC, 22.9%; 95% confidence interval [CI], 20.6% to 25.3%) and women (APC, 22.7%; 95% CI, 20.9% to 24.5%). However, the mortality rate remained stable over the same period, in both men (APC, 0.03%; 95% CI, −1.9% to 2.0%) and women (APC, 0.4%; 95% CI, −1.5% to 2.3%).
ASRs and APCs by histologic type and sex between 1997 and 2011 are shown in Table 1. The ASRs of papillary carcinoma increased from 1.11 per 100,000 in 1997 to 19.22 per 100,000 in 2011 and from 6.53 per 100,000 in 1997 to 91.15 per 100,000 in 2011 in men and women, respectively. Incidence of papillary carcinoma increased more than 10 times over the same period, and the annual increases (APCs) were 25.1% (95% CI, 22.7% to 27.5%) in men and 23.7% (95% CI, 21.9% to 25.5%) in women. Incidences of follicular carcinoma and medullary carcinoma increased steadily, whereas incidences of anaplastic carcinoma and unspecified carcinoma tended to stabilize.
The goodness of fit statistics for the age-period-cohort model is shown in Table 2. The IE model, which had the lowest AIC and the highest log-likelihood values, was the best goodness-of-fit model when compared with the other simple models. The period model alone explained approximately 74.0% and 70.0% of the thyroid cancer incidence rates in men and women, respectively. The age model alone explained 32.0% and 36.0% of the incidence rate in men and women, respectively.
Fig. 2 show age-specific incidence rates of thyroid cancer in men and women, respectively. The age-specific thyroid cancer incidence rate was described as a function of the time period in years, with the dotted lines connecting the same birth cohorts (from 1922-1926 to 1987-1991). In men, the incidence rate showed a gradual increase until the age of 65-69 years in the 1997-2001 period. The age at the peak incidence rate moved gradually to younger age groups, and 55-59 years in 2002-2006, and 50-54 years in 2007-2011. In women, ASRs showed a more pronounced inverted U-shaped trend, with a peak incidence rate of 232.1 per 100,000 for the 50-54-year-old age group during 2007-2011. In all birth cohorts, the incidence of thyroid cancer increased over time.
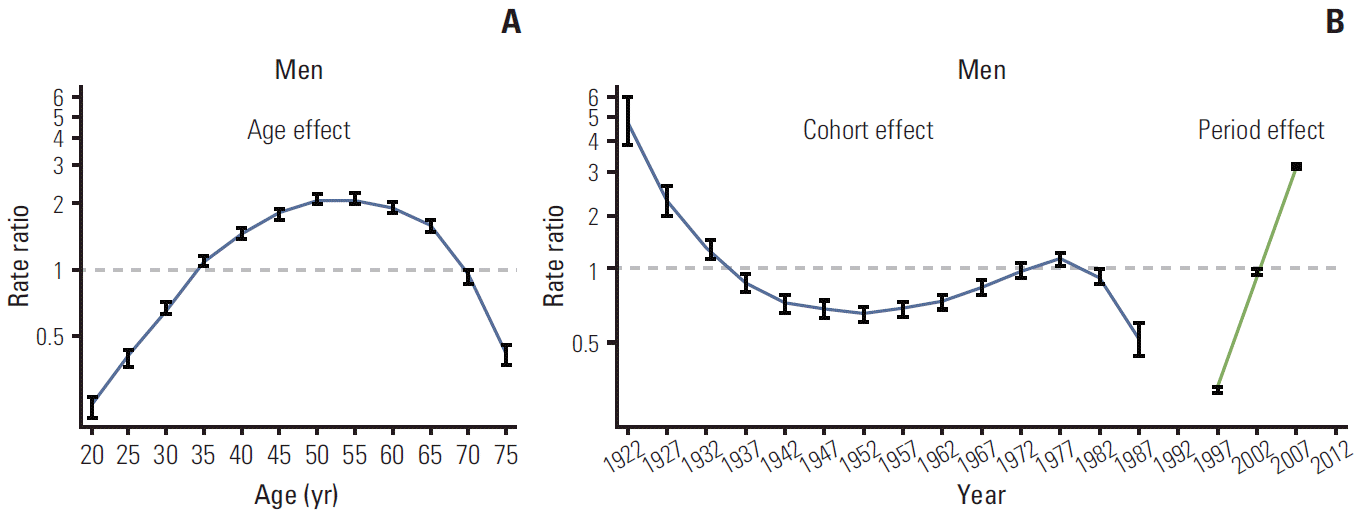
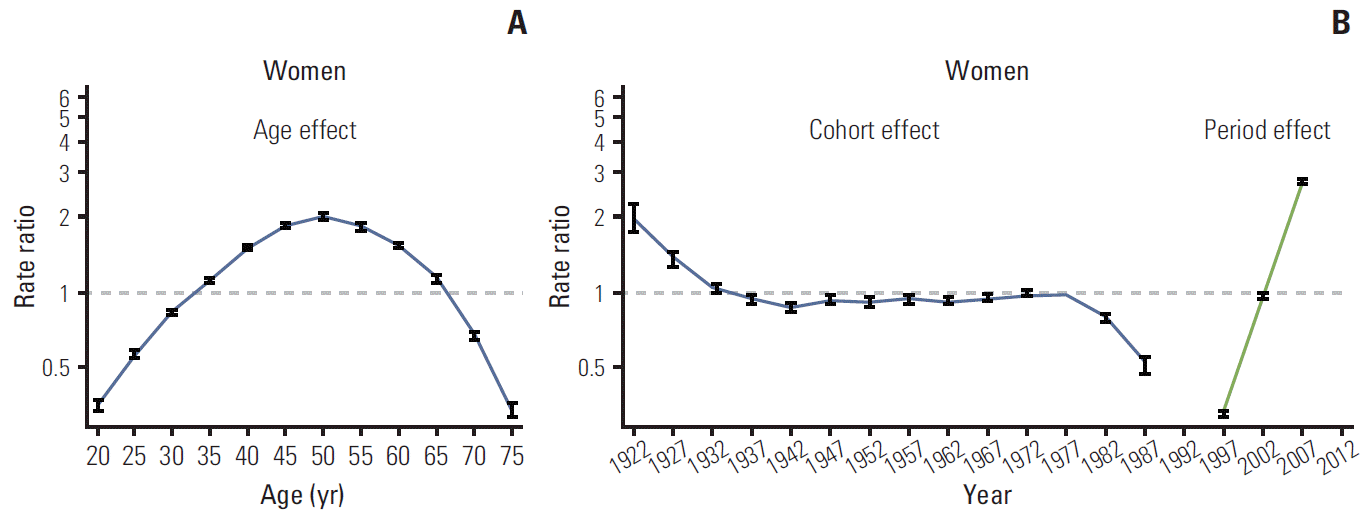
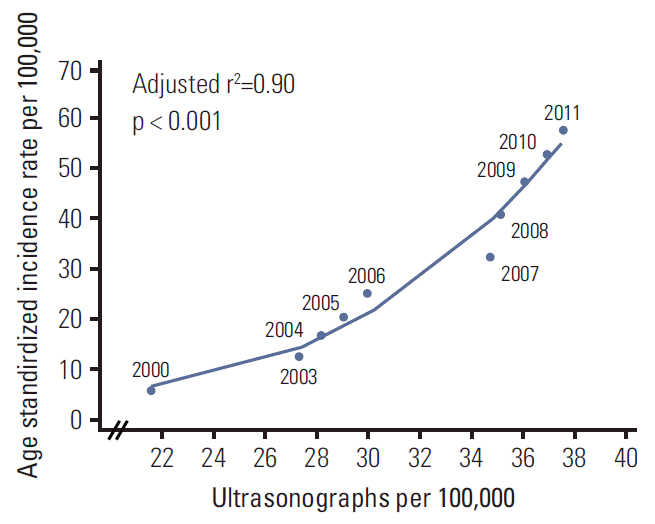
Figs. 3 and 4 show the age, period, and cohort effects using IE models in men and women. The patterns for the effects of age and period were similar in both sexes. After adjusting for the cohort and period effects, the age effect on the incidence rate of thyroid cancer peaked at 50-54 years in both men and women, and then decreased rapidly. The period effect showed an abrupt increase from 1997-2001 to 2007-2011. By contrast, the cohort effect exhibited a slightly different pattern by sex. The increase in cohort effect was observed in men born between 1952 and 1977, followed by a decrease, whereas the cohort effect tended to remain stable in women born from 1937 to 1977. In addition, we observed a correlation between the numbers of ultrasonography per 100,000 and the incidence of thyroid cancer by year. The increase in numbers of ultrasonography per 100,000 showed correlation with the increase in ASR of thyroid cancer (adjusted r2=0.90; p < 0.001) (Appendix 1).
In Korea, the incidence of thyroid cancer has shown a continuous increase, with a predominance of papillary carcinoma. The rapid increase in thyroid cancer incidence rate is attributed primarily to the period effects. This rapid increase, together with stable mortality rates, suggests an increase in the number of cases detected rather than an actual increase in the incidence of thyroid cancer.
The rapid increase in small thyroid cancers has been occurring in many countries [1,3,17]. The proportion of Koreans with micro-size papillary thyroid cancer (< 1 cm) has increased significantly, from 9.0% before 1990 to 54.0% after 2005 [18]. A study of 10 hospitals in Korea showed that the number of thyroid ultrasound examinations has doubled each year and the number of ultrasound-guided fine-needle aspiration biopsies increased four times from 2001 to 2004 [19]. In a nationwide study, the proportion of thyroid cancer patients diagnosed by screening showed a marked increase from 13.0% in 1999 to 42.5% in 2005 and 56.7% in 2008 [20]. A recent nationwide survey on the screening of thyroid cancer found that 13.2% of Korean adults (8.4% men and 16.4% women) underwent thyroid ultrasonography in 2009 [21]. In our study, we observed that the increase in numbers of ultrasonography per 100,000 also showed correlation with the increase in the ASR of thyroid cancer. Screening of thyroid cancer, together with detection of asymptomatic small size of thyroid cancer, has expanded. A similar pattern was observed for the incidence of prostate cancer, owing to the expanded use of prostate-specific antigen for prostate cancer screening [22], resulting in increased detection of asymptomatic rather than life-threatening cases. In the United States, the Surveillance, Epidemiology, and End Results (SEER) program reported no significant differences in mortality rates from thyroid cancer in patients who did not undergo immediate surgery for low-risk papillary thyroid cancer compared with those who underwent surgery [23]. The fact that the incidence of papillary thyroid cancer increased over 10-fold over the past 15 years while the mortality rate remained stable indicates that more patients with low-risk cancers are being diagnosed.
In addition to the prominent period effects, our results suggested minor increases in the cohort effects among middle-aged men. The incidence of thyroid cancer tended to increase in men born between 1952 and 1977, whereas, in women, the cohort effect tended to remain stable from 1937 to 1977. Although the incidence rate tended to decrease in individuals born from late 1977 to 1987, these individuals were still young and the observation period was relatively short compared to those born earlier. Therefore, conduct of further longitudinal studies is warranted for a thorough assessment of the cohort effects. The rates of thyroid cancer incidence in individuals born before 1937 had relatively large standard errors because of the small population and the short observation period. The increasing cohort effect in men born in or after 1950 suggests that their exposure to risk factors may have changed. It is notable that thyroid cancer was the most common cancer among adolescents and young adults aged 15-34 years, although those individuals were unlikely to participate spontaneously in thyroid cancer screening [2]. Among Korean adolescents and young adults, the increase in the rates of obesity, a risk factor for thyroid cancer [9], may explain this phenomenon. Among Korean male adolescents, the prevalence of abdominal obesity and metabolic syndrome showed a sharp increase in 2001 compared to 1998, but did not show a significant increase among Korean female adolescents [24].
According to the results of the Korean National Health and Nutrition Examination Survey, a BMI of ≥ 25 kg/m2 was frequently observed among Korean men, but not among Korean women [25]. In addition, this study found that the BMI of women aged 20-39 tended to decrease whereas the BMI of men aged 20-39 tended to increase during 1998-2007 [25]. Therefore, these factors can contribute to the different cohort effects observed between men and women in recent years.
This study had several limitations. First, the completeness of the KNCI DB over time may have contributed to the increased incidence of thyroid cancer in this population. The population-based nationwide database on cancer incidence was developed in 1999. Before 1999, the Korea Central Cancer Registry and several regional cancer registry databases were used for analysis. Therefore, the incidence rates of thyroid cancer before 1999 may have been underestimated. However, considering that the incidence rates of all types of thyroid cancer were similar, except for papillary carcinoma in 1997-1998 and 1999-2000, we assumed that this underestimation was minimal. Second, the relatively short study period may have resulted in imprecise estimations of the age-period-cohort effect. Despite these limitations, the current study helped to elucidate the period effects on thyroid cancer incidence.
The increased incidence of thyroid cancer is largely a result of the period effect. The period effect showed a marked increase, reflecting the increase in screening rates. Although the period effect had the greatest influence on the increased incidence of thyroid cancer, the cohort effect appeared to show a steady increase in men over time, and further research should be conducted in order to clarify their relative contribution.
ACKNOWLEDGMENTS
This work was supported by a research grant from the National Cancer Center (No. 1310220), Republic of Korea.
References
1. Ferlay J, Soerjomataram I, Ervik M, Dikshit R, Eser S, Mathers C, et al. GLOBOCAN 2012 v1.0: cancer incidence and mortality worldwide. IARC Cancer Base No. 10 [Internet]. Lyon:: International Agency for Research on Cancer;2013. [cited 2013 Jan 11]. Available from:http://globocan.iarc.fr/.
2. Jung KW, Won YJ, Kong HJ, Oh CM, Seo HG, Lee JS. Cancer statistics in Korea: incidence, mortality, survival and prevalence in 2010. Cancer Res Treat. 2013; 45:1–14.

3. Kilfoy BA, Zheng T, Holford TR, Han X, Ward MH, Sjodin A, et al. International patterns and trends in thyroid cancer incidence, 1973-2002. Cancer Causes Control. 2009; 20:525–31.

4. Chen AY, Jemal A, Ward EM. Increasing incidence of differentiated thyroid cancer in the United States, 1988-2005. Cancer. 2009; 115:3801–7.

5. Hogan AR, Zhuge Y, Perez EA, Koniaris LG, Lew JI, Sola JE. Pediatric thyroid carcinoma: incidence and outcomes in 1753 patients. J Surg Res. 2009; 156:167–72.

6. Alston RD, Geraci M, Eden TO, Moran A, Rowan S, Birch JM. Changes in cancer incidence in teenagers and young adults (ages 13 to 24 years) in England 1979-2003. Cancer. 2008; 113:2807–15.

7. Liu S, Semenciw R, Ugnat AM, Mao Y. Increasing thyroid cancer incidence in Canada, 1970-1996: time trends and age-period-cohort effects. Br J Cancer. 2001; 85:1335–9.

8. Richardson DB. Exposure to ionizing radiation in adulthood and thyroid cancer incidence. Epidemiology. 2009; 20:181–7.

9. Peterson E, De P, Nuttall R. BMI, diet and female reproductive factors as risks for thyroid cancer: a systematic review. PLoS One. 2012; 7:e29177.

10. Rosenberg PS, Anderson WF. Age-period-cohort models in cancer surveillance research: ready for prime time? Cancer Epidemiol Biomarkers Prev. 2011; 20:1263–8.

11. Fritz A, Percy C, Jack A, Shanmugaratnam K, Sobin L, Parkin DM, et al. International classification of diseases for oncology. 3rd ed. Geneva: World Health Organization;2000.
12. World Health Organization. International statistical classification of diseases and related health problems. 10th ed. Geneva: World Health Organization;1994.
13. Statistics Korea [Internet]. Daejeon: Statistics Korea;2013. [cited 2013 Sep 4]. Available from:http://kosis.kr.
14. Oh YH, Lee SH, Shin SY, Jung WJ. A study on analysis of 2000 national medical care resourced and utilization survey. Seoul: Ministry of Health and Welfare;2002.
15. Yang Y, Schulhofer‐Wohl S, Fu WJ, Land KC. The intrinsic estimator for age‐period‐cohort analysis: what it is and how to use it. Am J Sociol. 2008; 113:1697–736.

16. Mittlbock M, Waldhor T. Adjustments for R2-measures for Poisson regression models. Comput Stat Data Anal. 2000; 34:461–72.
17. Davies L, Welch HG. Increasing incidence of thyroid cancer in the United States, 1973-2002. JAMA. 2006; 295:2164–7.

18. Cho BY, Choi HS, Park YJ, Lim JA, Ahn HY, Lee EK, et al. Changes in the clinicopathological characteristics and outcomes of thyroid cancer in Korea over the past four decades. Thyroid. 2013; 23:797–804.

19. Kim SH, Jung SL, Moon WJ, Park MS, Kim YS, Lee HJ, et al. The prevalence of thyroid nodules and thyroid cancers in the Koreans: The nationwide data analysis of thyroid ultrasonography in 2004. J Korean Thyroid Assoc. 2009; 2:33–7.
20. Park S. National epidemiological survey of thyroid cancer incidence in Korea. Goyang: National Cancer Center, Ministry of Health and Welfare;2011.
21. Han MA, Choi KS, Lee HY, Kim Y, Jun JK, Park EC. Current status of thyroid cancer screening in Korea: results from a nationwide interview survey. Asian Pac J Cancer Prev. 2011; 12:1657–63.
22. Etzioni R, Penson DF, Legler JM, di Tommaso D, Boer R, Gann PH, et al. Overdiagnosis due to prostate-specific antigen screening: lessons from U.S. prostate cancer incidence trends. J Natl Cancer Inst. 2002; 94:981–90.

23. Davies L, Welch HG. Thyroid cancer survival in the United States: observational data from 1973 to 2005. Arch Otolaryngol Head Neck Surg. 2010; 136:440–4.
Fig. 2.
Thyroid cancer incidence rates in Korean men (A) and women (B) by age at cancer incidence, period, and birth cohort.
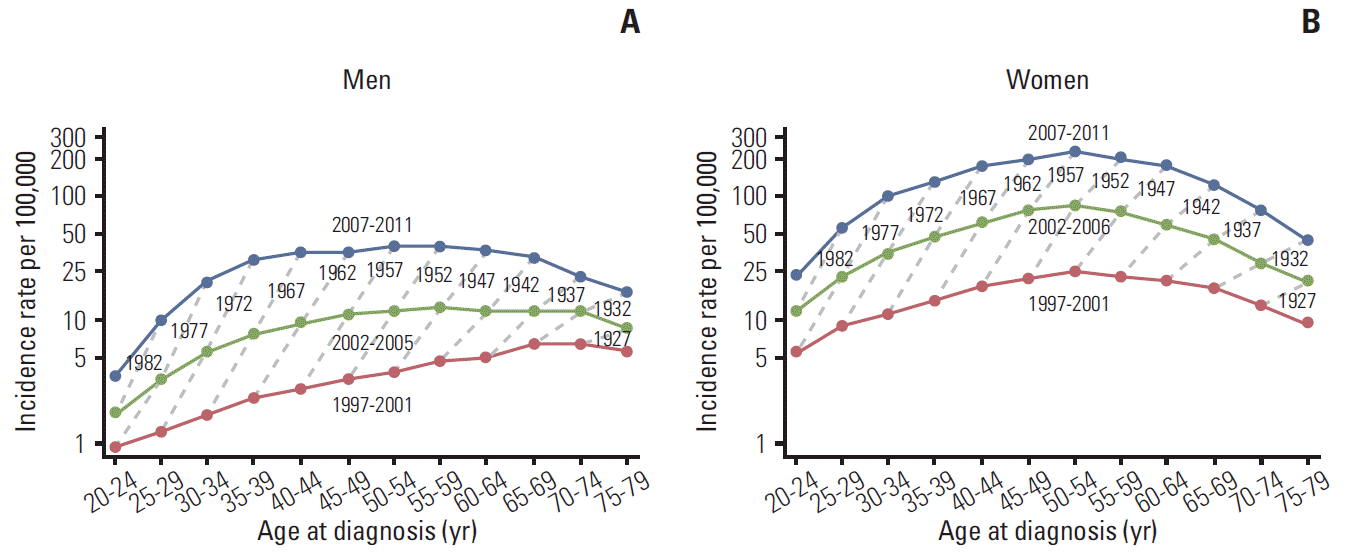
Table 1.
Age-standardized incidence rates per 100,000 population and annual percent change (APC) of thyroid cancer according to histologic type and sex in Korea, 1997-2011
| Gender | Histologic type |
Year |
APCa) | Difference | ||||||||||||||
|---|---|---|---|---|---|---|---|---|---|---|---|---|---|---|---|---|---|---|
| 1997 | 1998 | 1999 | 2000 | 2001 | 2002 | 2003 | 2004 | 2005 | 2006 | 2007 | 2008 | 2009 | 2010 | 2011 | ||||
| Men | Follicular | 0.20 | 0.19 | 0.20 | 0.15 | 0.21 | 0.20 | 0.24 | 0.29 | 0.26 | 0.33 | 0.36 | 0.31 | 0.34 | 0.45 | 0.42 | 6.78 (5.00 to 8.60) | 0.22 |
| Papillary | 1.11 | 1.38 | 1.46 | 1.41 | 1.84 | 2.17 | 3.00 | 4.12 | 5.13 | 6.52 | 8.77 | 12.10 | 14.49 | 17.63 | 19.22 | 25.10 (22.73 to 27.52) | 18.11 | |
| Medullary | 0.04 | 0.05 | 0.05 | 0.06 | 0.08 | 0.10 | 0.07 | 0.09 | 0.11 | 0.10 | 0.13 | 0.07 | 0.16 | 0.15 | 0.18 | 9.51 (6.49 to 12.62) | 0.14 | |
| Anaplastic | 0.05 | 0.07 | 0.07 | 0.09 | 0.05 | 0.06 | 0.06 | 0.04 | 0.04 | 0.07 | 0.06 | 0.04 | 0.06 | 0.07 | 0.07 | –0.33 (–3.60 to 3.05) | 0.02 | |
| Other specified | 0.03 | 0.03 | 0.05 | 0.06 | 0.08 | 0.03 | 0.10 | 0.14 | 0.22 | 0.34 | 0.48 | 0.59 | 0.36 | 0.07 | 0.09 | 17.23 (5.96 to 29.70) | 0.06 | |
| Unspecified | 0.05 | 0.03 | 0.04 | 0.02 | 0.02 | 0.03 | 0.03 | 0.06 | 0.03 | 0.01 | 0.04 | 0.05 | 0.03 | 0.02 | 0.04 | –1.10 (–6.29 to 4.37) | –0.01 | |
| Overall | 1.48 | 1.74 | 1.88 | 1.80 | 2.27 | 2.58 | 3.51 | 4.73 | 5.79 | 7.38 | 9.83 | 13.15 | 15.44 | 18.40 | 20.01 | 22.96 (20.63 to 25.32) | 18.53 | |
| Women | Follicular | 0.66 | 0.63 | 0.68 | 0.75 | 1.00 | 0.98 | 1.12 | 1.01 | 1.08 | 1.12 | 1.08 | 1.16 | 1.20 | 1.36 | 1.26 | 5.17 (3.82 to 6.54) | 0.60 |
| Papillary | 6.53 | 7.09 | 8.85 | 8.58 | 11.42 | 14.37 | 19.65 | 27.03 | 32.54 | 39.86 | 51.11 | 64.77 | 77.00 | 86.09 | 94.15 | 23.72 (21.93 to 25.54) | 87.62 | |
| Medullary | 0.11 | 0.11 | 0.09 | 0.16 | 0.13 | 0.16 | 0.14 | 0.19 | 0.15 | 0.21 | 0.26 | 0.24 | 0.29 | 0.32 | 0.30 | 8.82 (6.79 to 10.88) | 0.19 | |
| Anaplastic | 0.08 | 0.06 | 0.10 | 0.11 | 0.10 | 0.11 | 0.08 | 0.06 | 0.08 | 0.05 | 0.09 | 0.08 | 0.10 | 0.12 | 0.09 | 0.25 (–2.89 to 3.48) | 0.01 | |
| Other specified | 0.11 | 0.13 | 0.07 | 0.09 | 0.07 | 0.08 | 0.37 | 0.66 | 1.01 | 1.55 | 2.54 | 2.67 | 1.50 | 0.15 | 0.19 | 20.07 (3.59 to 39.18) | 0.08 | |
| Unspecified | 0.06 | 0.05 | 0.07 | 0.03 | 0.07 | 0.05 | 0.04 | 0.06 | 0.04 | 0.08 | 0.06 | 0.07 | 0.06 | 0.09 | 0.08 | 2.76 (–0.85 to 6.50) | 0.02 | |
| Overall | 7.55 | 8.09 | 9.87 | 9.72 | 12.79 | 15.76 | 21.41 | 29.03 | 34.90 | 42.87 | 55.14 | 68.98 | 80.14 | 88.13 | 96.08 | 22.72 (–0.85 to 6.50) | 88.53 | |
Table 2.
Goodness-of-fit statistics and adjusted r2 for age-period-cohort models for thyroid cancer incidence in Korea, 1997-2011
| Model |
Men |
Women |
||||||
|---|---|---|---|---|---|---|---|---|
| df | Log-likelihood | AIC | Adjusted r2 | df | Log-likelihood | AIC | Adjusted r2 | |
| Age | 24 | –10,901.5 | 606.30 | 0.32 | 24 | –49,214.9 | 2734.8 | 0.36 |
| Period | 33 | –4,312.8 | 239.8 | 0.74 | 33 | –23,455.5 | 1303.3 | 0.70 |
| Cohort | 22 | –14,117.0 | 785.1 | 0.12 | 22 | –61,437.0 | 3413.9 | 0.20 |
| Age+period | 22 | –347.5 | 20.1 | 0.99 | 22 | –480.3 | 27.5 | 0.99 |
| Age+cohort | 11 | –159.3 | 10.2 | 0.99 | 11 | –284.6 | 17.2 | 0.99 |
| Period+cohort | 20 | –662.4 | 37.7 | 0.97 | 20 | –2,384.0 | 133.3 | 0.97 |
| Age+period+cohorta) (intrinsic estimator) | 10 | –154.2 | 10.0 | - | 10 | –242.3 | 14.9 | - |


 PDF
PDF Citation
 Print
Print


 XML Download