Introduction
Materials and Methods
1. Study design and treatment plan
2. Baseline and treatment assessments
3. Statistical analyses
Results
1. Patients and treatment
Table 1.
| Parameter |
East Asian |
Non-East Asian |
||||
|---|---|---|---|---|---|---|
| Pemetrexed + erlotinib (n=41) | Erlotinib (n=49) | Pemetrexed (n=43) | Pemetrexed + erlotinib (n=37) | Erlotinib (n=33) | Pemetrexed (n=37) | |
| Gender | ||||||
| Male | 8 (19.5) | 14 (28.6) | 15 (34.9) | 12 (32.4) | 14 (42.4) | 20 (54.1) |
| Female | 33 (80.5) | 35 (71.4) | 28 (65.1) | 25 (67.6) | 19 (57.6) | 17 (45.9) |
| Age (yr) | ||||||
| Mean±SD | 57.0±11.30 | 56.2±9.38 | 54.8±12.60 | 55.0±12.23 | 50.5±11.25 | 57.6±13.54 |
| Range | 33.5-72.5 | 31.7-74.4 | 26.2-73.6 | 30.0-76.0 | 32.0-74.7 | 34.0-87.0 |
| Country | ||||||
| China | 14 (34.1) | 17 (34.7) | 15 (34.9) | 0 | 0 | 0 |
| Hong Kong | 0 | 3 (6.1) | 2 (4.7) | 0 | 0 | 0 |
| Republic of Korea | 20 (48.8) | 20 (40.8) | 13 (30.2) | 0 | 0 | 0 |
| Taiwan, Province of China | 7 (17.1) | 9 (18.4) | 13 (30.2) | |||
| Australia | 0 | 0 | 0 | 3 (8.1) | 0 | 0 |
| Brazil | 0 | 0 | 0 | 15 (40.5) | 5 (15.2) | 8(21.6) |
| India | 0 | 0 | 0 | 15 (40.5) | 27 (81.8) | 25 (67.6) |
| United Kingdom | 0 | 0 | 0 | 4 (10.8) | 1 (3.0) | 4 (10.8) |
| ECOG performance status | ||||||
| 0 | 0 | 8 (16.3) | 7 (16.3) | 10 (27.0) | 12 (36.4) | 9 (24.3) |
| 1 | 38 (92.7) | 40 (81.6) | 34 (79.1) | 23 (62.2) | 16 (48.5) | 26 (70.3) |
| 2 | 3 (7.3) | 1 (2.0) | 2 (4.7) | 3 (8.1) | 5 (15.2) | 2 (5.4) |
| 3 | 0 | 0 | 0 | 1 (2.7) | 0 | 0 |
| EGFR mutation status | ||||||
| Yes | 5 (12.2) | 8 (16.3) | 6 (14.0) | 2 (5.4) | 0 | 3 (8.1) |
| No | 5 (12.2) | 4 (8.2) | 3 (7.0) | 5 (13.5) | 2 (6.1) | 0 |
| Unknown | 31 (75.6) | 37 (75.5) | 34 (79.1) | 30 (81.1) | 31 (93.9) | 34 (91.9) |
| Pathological diagnosis | ||||||
| Adenocarcinoma | 40 (97.6) | 48 (98.0) | 43 (100) | 32 (86.5) | 28 (84.8) | 34 (91.9) |
| Mixed cell lung carcinoma | 1 (2.4) | 0 | 0 | 1 (2.7) | 1 (3.0) | 0 |
| Large cell lung carcinoma | 0 | 1 (2.0) | 0 | 4 (10.8) | 4 (12.1) | 3 (8.1) |
| Stage of diseasea) at entry | ||||||
| IIIA | 0 | 0 | 0 | 0 | 2 (6.1) | 1 (2.7) |
| IIIB | 3 (7.3) | 8 (16.3) | 7 (16.3) | 3 (8.1) | 4 (12.1) | 4 (10.8) |
| IV | 38 (92.7) | 41 (83.7) | 36 (83.7) | 34 (91.9) | 27 (81.8) | 32 (86.5) |
2. Efficacy
1) Primary efficacy measure
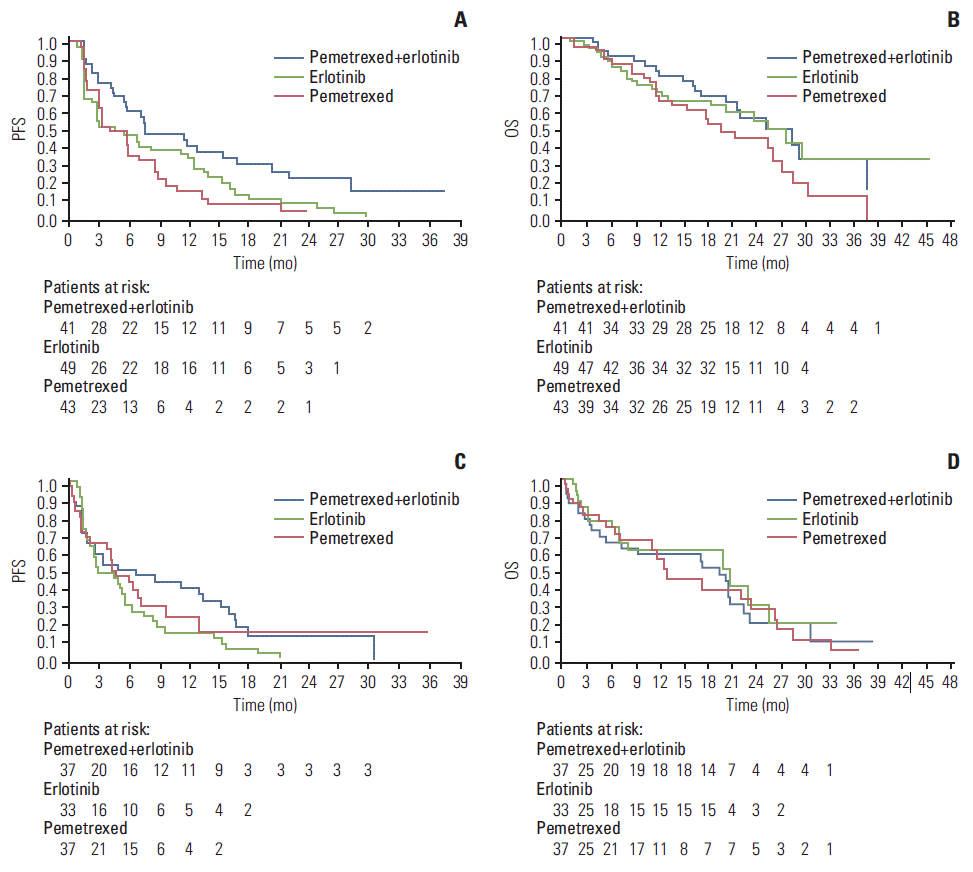
 | Fig. 1.Kaplan-Meier plots of progression-free survival (PFS) and overall survival (OS) for East Asian (EA) and non-EA populations. (A) Kaplan-Meier plot of PFS for EA population. (B) Kaplan-Meier plot of OS for EA population. (C) Kaplan-Meier plot of PFS for non-EA population. (D) Kaplan-Meier plot of OS for non-EA population. For OS, 53.7%, 37.2% and 53.1% of EA patients and 35.1%, 40.5% and 54.5% of non-EA patients treated with pemetrexed-erlotinib, pemetrexed or erlotinib, respectively, were censored. |
Table 2.
| Variable |
East Asian |
Non-East Asian |
||||||
|---|---|---|---|---|---|---|---|---|
|
PFSb) |
OSb) |
PFSb) |
OSb) |
|||||
| HR (95% CI) | p-valuec) | HR (95% CI) | p-valuec) | HR (95% CI) | p-valuec) | HR (95% CI) | p-valuec) | |
| Treatment adjusted by covariates (overall) | 0.003 | 0.114 | 0.210 | 0.528 | ||||
| Pemetrexed+erlotinib vs. erlotinib (reference level) | 0.48 (0.29-0.79) | 0.004 | 0.83 (0.44-1.56) | 0.554 | 0.62 (0.37-1.05) | 0.078 | 1.42 (0.72-2.80) | 0.306 |
| Pemetrexed+erlotinib vs. pemetrexed (reference level) | 0.40 (0.23-0.70) | 0.001 | 0.53 (0.28-1.00) | 0.051 | 0.75 (0.42-1.32) | 0.320 | 1.00 (0.55-1.79) | 0.993 |
| Pemetrexed vs. erlotinib (reference level) | 1.20 (0.76-1.90) | 0.430 | 1.56 (0.88-2.75) | 0.124 | 0.83 (0.48-1.43) | 0.505 | 1.43 (0.72-2.83) | 0.309 |
PFS, progression-free survival; OS, overall survival; ITT, intent-to-treat; HR, hazard ratio; CI, confidence intervals.
a) PFS and OS were adjusted by three covariates: performance status (0-1 vs. 2), histologic subtype (adenocarcinoma vs. non-adenocarcinoma), and sex (female vs. male),
b) PFS was defined as the time from randomization to the first date of progressive disease (either objectively determined or clinical progression) or death from any cause; OS was defined as the time from randomization to the date of death from any cause; survival time was censored at the date of last contact for patients who were still alive or lost to follow-up,
2) Secondary efficacy measures
Table 3.
| Variable |
East Asian |
Non-East Asian |
||||||||||
|---|---|---|---|---|---|---|---|---|---|---|---|---|
|
ORR |
DCR |
ORR |
DCR |
|||||||||
| No. (%) | HR (95% CI)a) | p-value | No. (%) | HR (95% CI)a) | p-value | No. (%) | HR (95% CI)a) | p-value | No. (%) | HR (95% CI)a) | p-value | |
| Pemetrexed+erlotinib | 21/41 (51.2) | (35.1-67.1) | < 0.001b) | 29/41 (70.7) | (54.5-83.9) | 0.107b) | 13/35 (37.1) | (21.5-55.1) | 0.013b) | 20/35 (57.1) | (39.4-73.7) | 0.804b) |
| Erlotinib | 15/49 (30.6) | (18.3-45.4) | 25/49 (51.0) | (36.3-65.6) | 9/33 (27.3) | (13.3-45.5) | 18/33 (54.5) | (36.4-71.9) | ||||
| Pemetrexed | 5/43 (11.6) | (3.9-25.1) | 22/43 (51.2) | (35.5-66.7) | 3/37 (8.1) | (1.7-21.9) | 23/37 (62.2) | (44.8-77.5) | ||||
| Treatment adjusted by covariates (overall)c) | < 0.001d) | 0.071d) | 0.037d) | 0.750d) | ||||||||
| Pemetrexed+erlotinib vs. erlotinib (reference level) | - | 2.73 (1.12-6.68) | 0.027d) | - | 2.72 (1.08-6.80) | 0.033d) | - | 1.58 (0.56-4.52) | 0.389d) | - | 1.08 (0.41-2.89) | 0.873d) |
| Pemetrexed+erlotinib vs. pemetrexed (reference level) | - | 9.45 (2.96-30.16) | < 0.001d) | - | 2.61 (1.01-6.75) | 0.048d) | - | 6.21 (1.54-25.00) | 0.010d) | - | 0.75 (0.29-2.00) | 0.570d) |
| Pemetrexed vs. erlotinib (reference level) | - | 0.29 (0.09-0.89) | 0.031d) | - | 1.04 (0.45-2.40) | 0.923d) | - | 0.26 (0.06-1.06) | 0.060d) | - | 1.44 (0.54-3.85) | 0.473d) |
ORR, objective response rate; DCR, disease control rate; CI, confidence interval; HR, hazard ratio; ITT, intent-to-treat.
b) Chi-square test was used for best ORR and DCR; Fisher exact test was used to compare response rates; all tests were at a two-sided significance level of 0.05,
3. Exploratory analyses
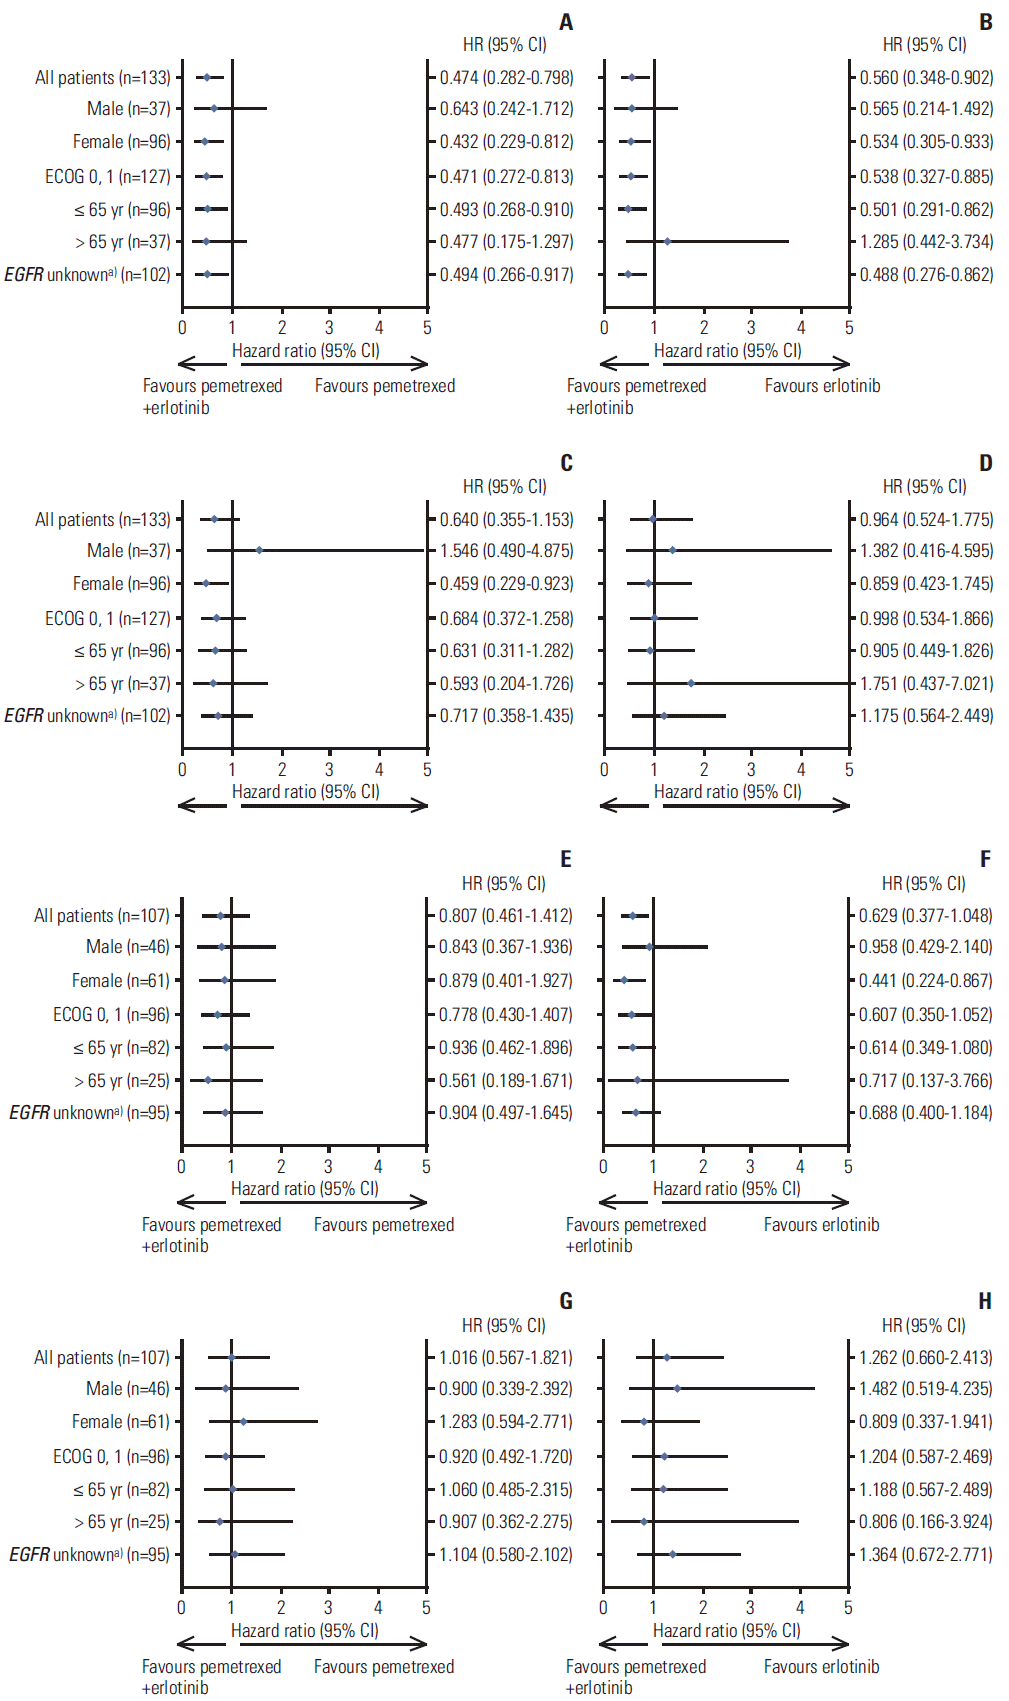
 | Fig. 2.Forest plots by clinical subgroups (qualified intention-to-treat population). (A, B) Forest plots of progression-free survival (PFS) for East Asian (EA) population by clinical subgroups. (C, D) Forest plots of overall survival (OS) for EA population by clinical subgroups. (E, F) Forest plots of PFS for non-EA population by clinical subgroups. (G, H) Forest plots of OS for non-EA population by clinical subgroups. CI, confidence interval; EGFR, epidermal growth factor receptor; HR, hazard ratio. a)Patient with any EGFR mutation detected was categorized as mutated (positive); patient without EGFR mutations detected was categorized as non-mutated (negative); patient without EGFR samples or without valid EGFR samples was categorized as unknown. Note: The results for Eastern Cooperative Oncology Group performance status (ECOG PS) 2 subgroup were removed from the plot due to the extremely small number of patients in the EA (n=6) and non-EA (n=10) populations. |
4. Post-discontinuation treatment
5. Safety
Table 4.
| Toxicity |
East Asian |
Non-East Asian |
||||
|---|---|---|---|---|---|---|
| Pemetrexed + erlotinib (n=40) | Erlotinib (n=50) | Pemetrexed (n=40) | Pemetrexed + erlotinib (n=35) | Erlotinib (n=33) | Pemetrexed (n=36) | |
| Non-laboratory parameters | ||||||
| Grade 3/4 ≥ 5% | ||||||
| Mucositis/stomatitis | 4b) | 0 | 0 | 0 | 0 | 0 |
| Rash: acne/acneiform | 3 | 4 | 0 | 1 | 1 | 0 |
| Diarrhea | 2 | 0 | 0 | 5 | 0 | 0 |
| Fatigue (asthenia, lethargy, malaise) | 2 | 0 | 2 | 2 | 0 | 1 |
| Rash: desquamation | 1 | 0 | 0 | 2 | 0 | 0 |
| Anorexia | 1 | 0 | 0 | 0 | 0 | 2 |
| Grade 5 | ||||||
| Sudden death | 0 | 0 | 0 | 0 | 0 | 1 |
| Viral hepatitis | 0 | 0 | 0 | 0 | 0 | 1 |
| Laboratory parameters | ||||||
| Grade 3/4 ≥ 5% | ||||||
| Neutropenia | 11 | 0 | 5 | 7 | 0 | 5 |
| Leukopenia | 3 | 0 | 3 | 6 | 0 | 3 |
| Anemia | 4 | 0 | 3 | 4 | 0 | 4 |
| Lymphopenia | 3 | 0 | 4 | 6 | 0 | 1 |
| Hyperglycemia | 2 | 0 | 1 | 0 | 0 | 0 |
| Thrombocytopenia | 0 | 0 | 1 | 2 | 0 | 1 |
| Hyponatremia | 0 | 0 | 0 | 1 | 1 | 2 |
| Hypokalemia | 0 | 0 | 0 | 1 | 0 | 2 |
| Grade 5 | ||||||
| Neutropenia | 0 | 0 | 0 | 0 | 0 | 1 |
| Other blood/bone marrow | 0 | 0 | 0 | 2 | 0 | 0 |
Values are presented as number (%).TEAEs, treatment-emergent adverse events; CTCAE, Common Terminology Criteria for Adverse Events; NOS, not otherwise specified.


 PDF
PDF Citation
 Print
Print


 XML Download