Introduction
Materials and Methods
1. Cell cultures
2. Real-time quantitative reverse transcriptase polymerase chain reaction (qRT-PCR)
3. Induction of monocyte/macrophage differentiation
4. Western blot analysis
5. Enzyme-linked immunosorbent assay of PGE2 levels
6. Statistical analysis
Results
1. IL-17 up-regulates expression of COX-2 mRNA and protein in cancer cell lines
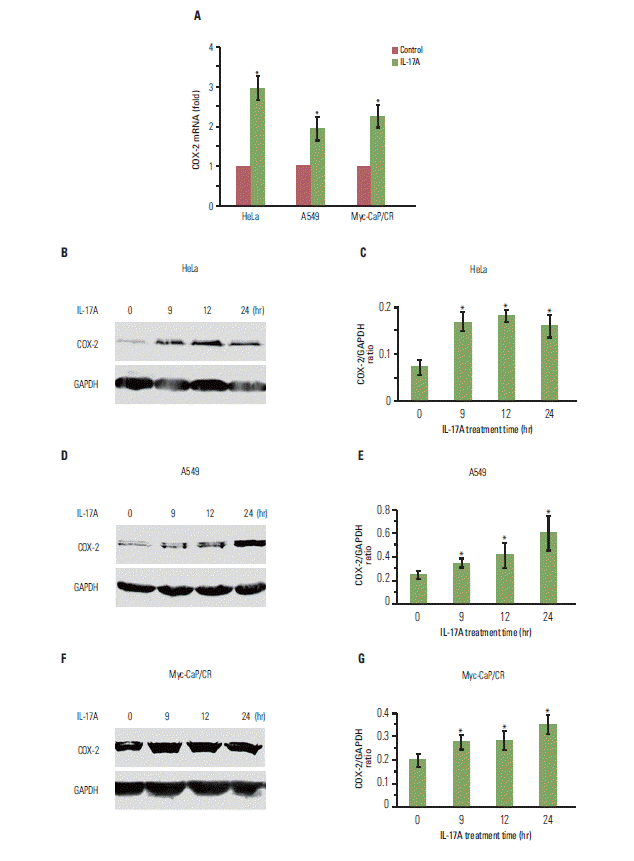 | Fig. 1.Interleukin (IL)-17 up-regulates expression of cyclooxygenase-2 (COX-2) mRNA and protein in cancer cells. (A) The cancer cells were treated without or with 20 ng/mL IL-17A for 2 hours; COX-2 mRNA levels were determined by real-time quantitative reverse transcriptase polymerase chain reaction. (B, D, F) The cancer cells were treated with 20 ng/mL IL-17A; COX-2 protein levels were determined by Western blot analysis. (C, E, G) Quantification of Western blot signals in three independent experiments. The ratio represents COX-2 signal divided by glyceraldehyde 3-phosphate dehydrogenase (GAPDH) signal, where ratio=1 means that COX-2 signal is equal to GAPDH signal. Values are presented as the mean± standard deviation obtained from three independent experiments. *p < 0.05, compared to the control group. |
2. IL-17 activates NF-κB and/or ERK1/2 pathways in cancer cell lines
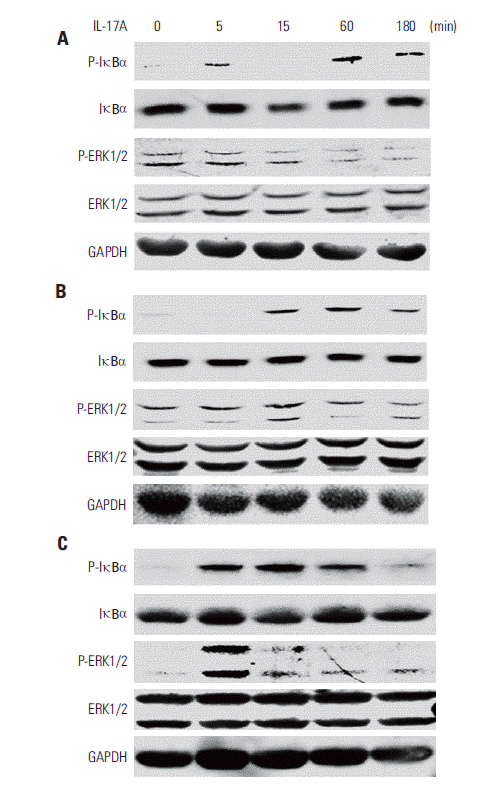 | Fig. 2.Interleukin (IL)-17 activates nuclear factor-κB and/or extracellular signal-regulated kinases 1 and 2 (ERK1/2) signaling pathways in cancer cells. HeLa cells (A), A549 cells (B), and Myc-CaP/CR cells (C) were treated without or with 20 ng/mL IL-17A; protein levels were determined by Western blot analysis. For protein loading control, the blots were stripped and reprobed for glyceraldehyde 3-phosphate dehydrogenase (GAPDH). |
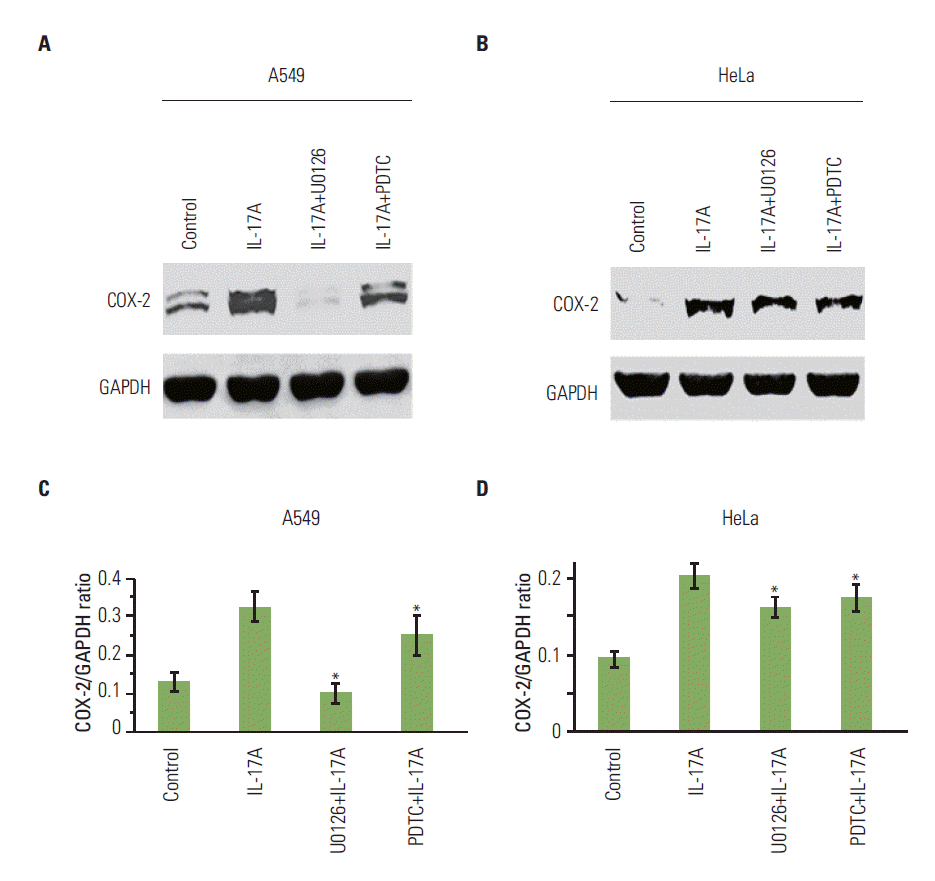 | Fig. 3.U0126 and pyrrolidine dithiocarbamate (PDTC) inhibit interleukin (IL)-17-induced cyclooxygenase-2 (COX-2) protein expression in cancer cells. (A, B) The cancer cells were treated without or with 100 μM nuclear factor-κB (NF-κB) inhibitor PDTC or 10 μM MEK inhibitor U0126 for 30 minutes prior to addition of recombinant IL-17A (20 ng/mL) for 12 hours treatment. COX-2 protein expression was determined by Western blot analysis. (C, D) Quantification of Western blot signals in three independent experiments. GAPDH, glyceraldehyde-3-phosphate dehydrogenase. Values are presented as the mean±standard deviation obtained from three independent experiments. *p < 0.05, compared to the IL-17A treatment group. |
3. IL-17 indirectly promotes M2 macrophage differentiation through induction of PGE2 synthesis
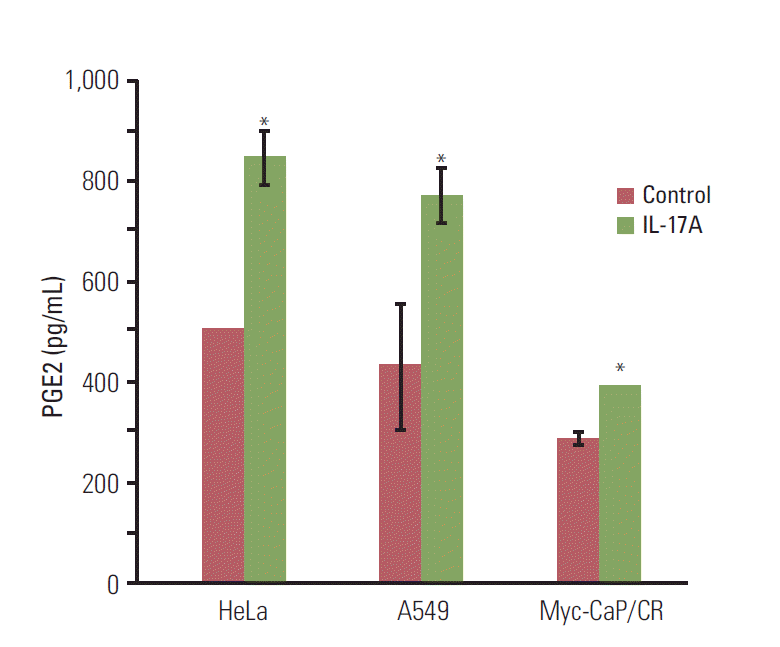 | Fig. 4.Interleukin (IL)-17 induces prostaglandin E2 (PGE2) secretion in cancer cells. The cancer cells were serum starved for 15 hours and then treated without or with 20 ng/mL IL-17A for 24 hours; PGE2 levels were determined using an enzyme-linked immunosorbent assay kit. Values are presented as the mean±standard deviation obtained from three independent experiments. *p < 0.05, compared to the control group. |
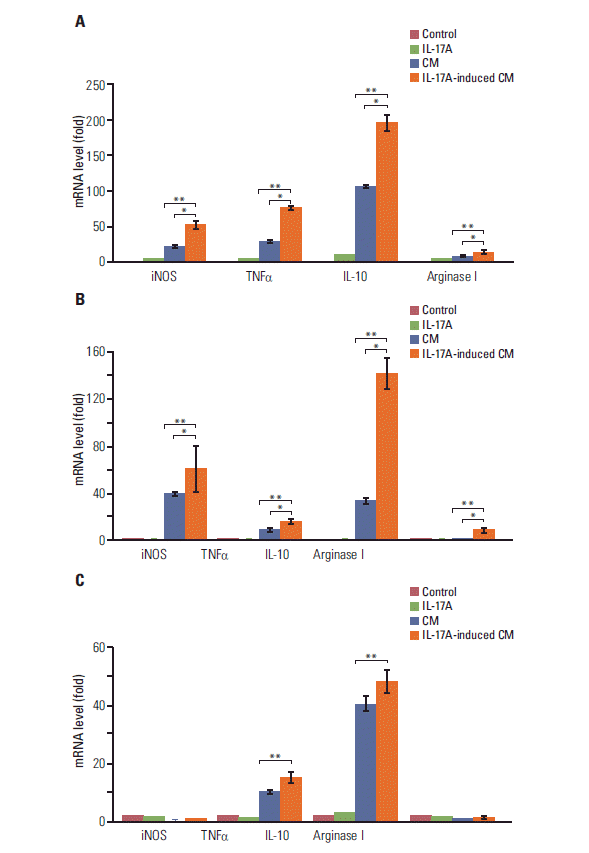 | Fig. 5.Interleukin (IL)-17A-induced conditional medium increases expression of marker genes of M2 macrophages. The conditional medium (CM) or IL-17A-induced CM from human HeLa cancer cells (A) or human A549 cancer cells (B) was used to treat mouse RAW264.7 macrophages; the CM or IL-17A-induced CM from mouse Myc-CaP/CR cancer cells (C) was used to treat human THP-1 monocytes. The control group was treated with serum-free medium that had not been exposed to any cells. The IL-17A group was treated with 20 ng/mL IL-17A in serum-free medium. After 3 hours treatment, mRNA levels of the genes were determined by real-time quantitative reverse transcriptase polymerase chain reaction. Inducible nitric oxide synthase (iNOS) and tumor necrosis factor α (TNFα) are markers for M1 macrophages, and IL-10 and arginase I are markers for M2 macrophages. Values are presented as the mean±standard deviation obtained from three independent experiments. *p < 0.05 or **p < 0.01, compared to the groups as indicated. |


 PDF
PDF Citation
 Print
Print


 XML Download