Introduction
Materials and Methods
1. Cell culture and chemicals
2. Cell proliferation assay
3. Cell counting assay
4. Colony forming assay
5. Cell cycle analysis
6. Apoptosis assay
7. Western blot analysis
8. Immunofluorescence staining
9. Plasmid construction and gene transfection
10. siRNA transfection
11. In vivo study
12. Ex vivo analysis of tumor material
13. Statistical analysis
Results
1. SU11274 shows anticancer effect in lung cancer cells with wild-type p53
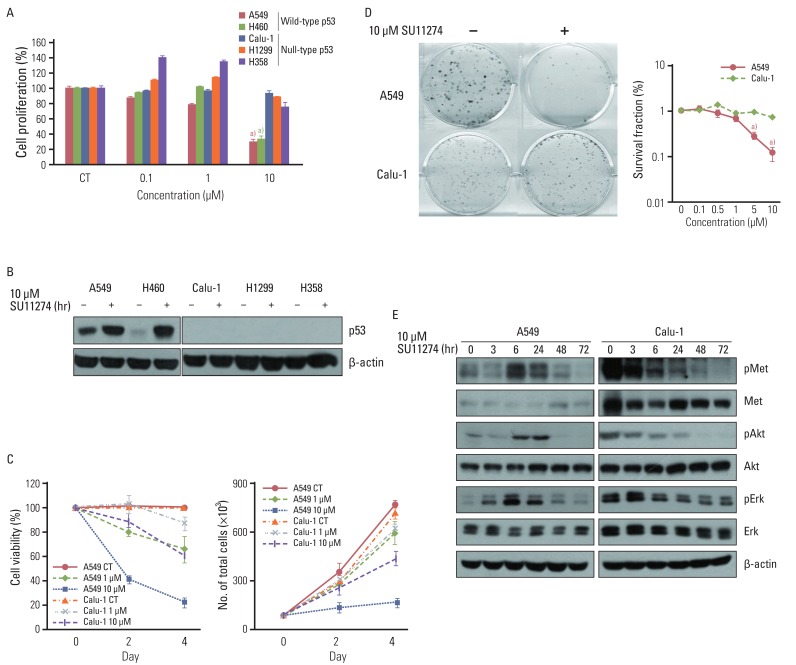 | Fig. 1Effect of SU11274 on growth inhibition in lung cancer cells. (A) The result of MTT assay in lung cancer cells with different p53 statuses treated with the indicated concentrations of SU11274 for 72 hr. Columns, mean value of six identical wells of a single representative experiment; Bars, standard error. a)p<0.001 for comparisons between SU11274-treated and untreated cells. (B) The expression of p53 protein in lung cancer cells. Cells were treated with 10 µM SU11274 for 24 hr, and cell extracts were immunoblotted using p53 antibody. β-actin serves as a loading control. (C) Results of cell counting in A549 and Calu-1 cells treated with 1 and 10 µM SU11274 for 48 hr and 96 hr. Points, mean value of three experiments; bar, standard error, this data presented p < 0.05; CT, control. (D) Results of colony-forming assay in A549 and Calu-1 cells treated with indicated concentrations of SU11274 for ~3 weeks. The surviving fraction (SF) was calculated from the following formula: SF=number of colonies formed/number of cells seeded×plating efficiency of control group. Points, mean values of three experiments; bar, standard error. a)p<0.001. (E) A549 and Calu-1 cells were treated with 10 µM SU11274 for indicated time. Whole cell lysates were prepared and separated by 8% sodium dodecyl sulfate-polyacrylamide gel electrophoresis, and immunoblotted for MET, Akt, Erk and their phosphorylated forms. β-actin was used as a loading control. |
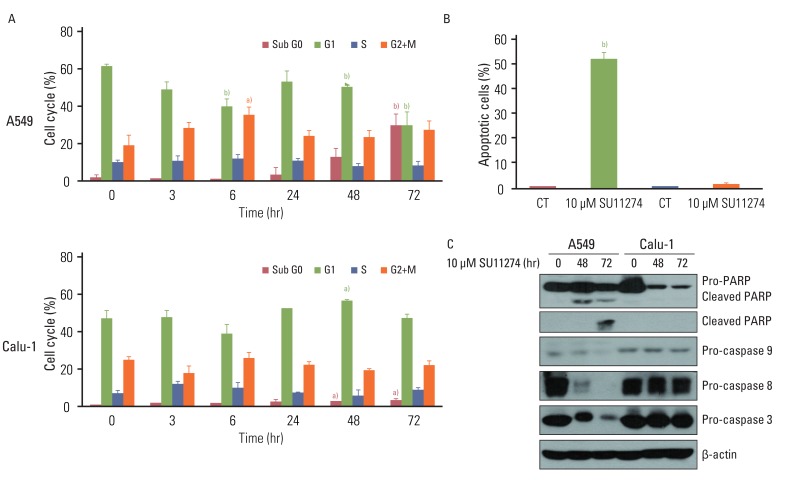 | Fig. 2Effects of SU11274 on apoptosis in A549 and Calu-1 cells. (A) Results of cell cycle analysis using propidium iodide staining in SU11274-treated A549 and Calu-1 cells. Cells were treated with 10 µM SU11274 for indicated period of time, and both adherent and floating cells were harvested for analysis of cell cycle distribution. Columns, mean value of three experiments; bar, standard error. a)p<0.05, b)p<0.001. (B) The results of apoptosis in A549 and Calu-1 cells assessed using APO-BRDU kit. A549 and Calu-1 cells were treated with 10 µM SU11274 for 72 hr, and both adherent and floating cells were harvested. Columns, mean value of three identical experiments; bars, standard error; CT, control. b)p<0.001 for comparisons between SU11274-treated and untreated cells. (C) Expression of poly(ADP-ribose) polymerase (PARP), caspase 9, caspase 8, and caspase 3 in A549 and Calu-1 cells. Cells were treated with 10 µM SU11274 for 48 and 72 hr. Both adherent and floating cells were harvested. |
2. SU11274 increases p53 protein in A549 cells with wild-type p53
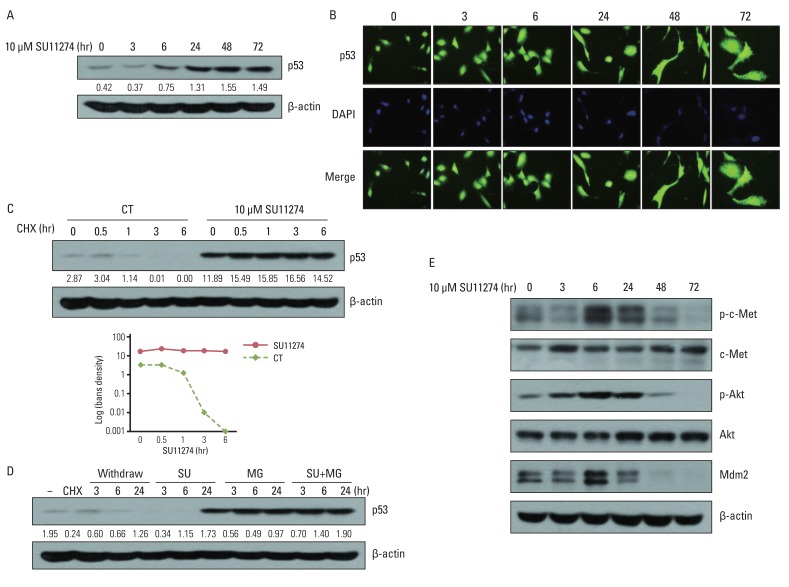 | Fig. 3Effects of SU11274 on p53 protein in A549 cells. (A) The expression of p53 protein in SU11274-treated A549 cells. Cells were treated with SU11274 for the indicated periods of time. Whole cell lysates were prepared and separated by 10% sodium dodecyl sulfatepolyacrylamide gel electrophoresis, and immunoblotted using p53 antibodies. β-actin serves as a loading control. Bands were quantified by densitometry. (B) The effects of SU11274 on cellular localization of p53 protein in A549 cells. SU11274-treated A549 cells immunostained with anti-p53 antibody (green fluorescence) and DAPI (blue fluorescence) in a time-dependent manner, and analyzed by fluorescence microscopy to determine the cellular localization of p53. (C) p53 stability in SU11274-treated A549 cells. Cells were treated with 10 µM SU11274 for 24 hr, followed by 10 µg/mL cycloheximide (CHX) for the indicated periods of time. CT, control. (D) p53 increase in SU11274-treated A549 cells. Cells were treated with 10 µg/mL CHX for 6 hr, followed by change of new growing medium only and new growing medium containing 10 µM SU11274, 10 µM MG132, or both for indicated times. Each band was quantified by densitometry. SU, SU11274; MG, MG132. (E) The expression of phospho-c-Met (p-c-Met), c-Met, phospho-Akt (p-Akt), Akt, and mdm2 protein. Cells were treated with 10 µM SU11274 for the indicated time. |
3. Increased p53 protein by SU11274 induces apoptosis through the regulation of Bax, PUMA, and Bcl-2 in A549 cells
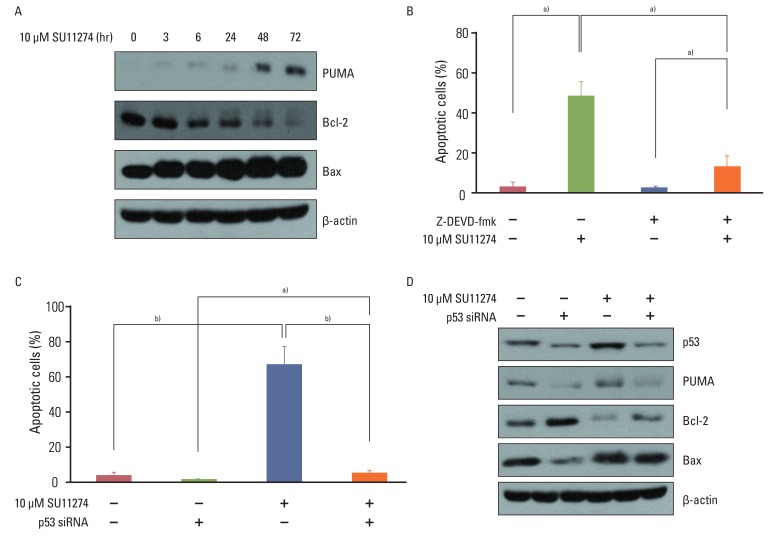 | Fig. 4The role of p53 in SU11274-mediated apoptosis in A549 cells. (A) Expression of Bax, PUMA, and Bcl-2 in SU11274-treated A549 cells. Cells were treated with 10 µM SU11274 for the indicated times. (B) Effects of caspase 3 on apoptosis in SU11274-treated A549 cells. Cells were treated with 10 µM SU11274, 2 µM Z-DEVD-fmk (caspase 3 inhibitor), or both for 72 hr. Both adherent and floating cells were harvested and evaluated by the APO-BRDU kit. Columns, mean value of three experiments; bar, standard error. a)p<0.05. (C) Effects of p53 siRNA on apoptosis in SU11274-induced apoptosis using APO-BRDU kit. Cells were transiently transfected with scramble siRNA or p53 siRNA. After 24 hr, cells were treated with 10 µM SU11274 for 72 hr. Both adherent and non-adherent cells were harvested. Columns, mean value of three experiments; bar, standard error. a)p<0.05, b)p<0.005. (D) Expression of p53, Bax, PUMA, and Bcl-2 protein in p53 siRNA-transfected A549 cells after SU11274 treatment. |
4. p53 plays a critical role in SU11274-mediated apoptosis in lung cancer cells
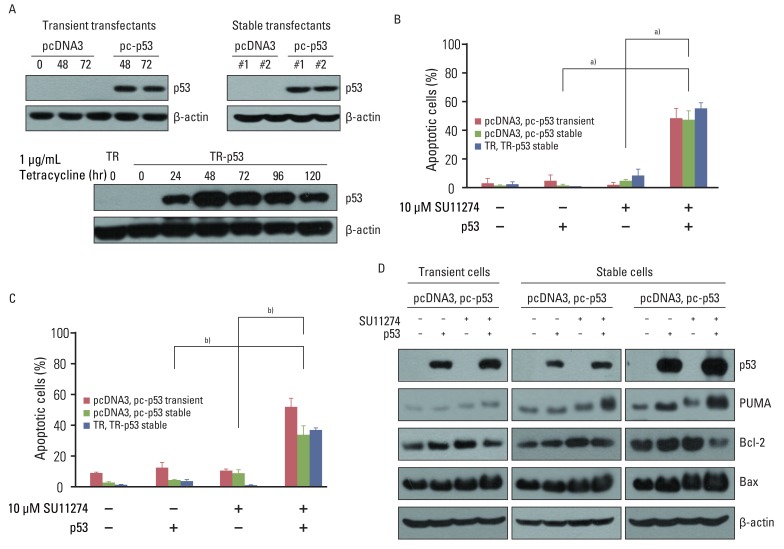 | Fig. 5Effects of exogenous p53 protein on SU11274-mediated apoptosis. (A) Expression of p53 protein in p53 transfectants. Cells were transfected with pcDNA3, pcDNA3-p53 (pc-p53) expression vectors, pcDNA6/TR (TR), or pcDNA6/TR-pcDNA4/TO-p53 (TR-p53) expression vectors. To prepare transient transfectants, cells were transfected with pcDNA3 and pc-p53. After 48 and 72 hr, cells were harvested and immunoblotted using p53 antibodies. Stable transfectants, described in Materials and Methods, were harvested and analyzed by immunoblotting. One µg/mL Tet analogue tetracycline was applied to TR and TR-p53 stable transfectants for 24 hr and the cells were harvested at the indicated times. Cell extracts were analyzed by immunoblotting using p53 antibody. β-actin was used as a loading control. (B) Effects of exogenous p53 protein on SU11274-induced apoptosis in empty vector and p53 transfectants. TR and TR-p53 stable transfectants were pretreated with 1 µg Tet analogue tetracycline for 24 hr and total cells were treated with 10 µM SU11274 for 72 hr. Both adherent and non-adherent cells were harvested. Columns, mean value of three experiments; bar, standard error. a)p<0.005. (C) Result of cell cycle analysis using propidium iodide staining in p53 transfected Calu-1 cell after SU11274 treatment. Cells were transiently transfected with pcDNA3 and pc-p53 DNA. After 24 hr, cells were treated with 10 µM SU11274 for 72 hr. Stable p53 transfectants were also treated with 10 µM SU11274 for 72 hr. Both adherent and floating cells were harvested for analysis of cell cycle distribution. Columns, mean value of three experiments; bar, standard error. b)p<0.001. (D) Expression of p53, Bax, PUMA, and Bcl-2 proteins in empty vector and p53 transfectants. Cells were treated with 10 µM SU11274 for 72 hr. |
5. SU11274 induced apoptosis through the increase of p53 protein in tumor xenograft models
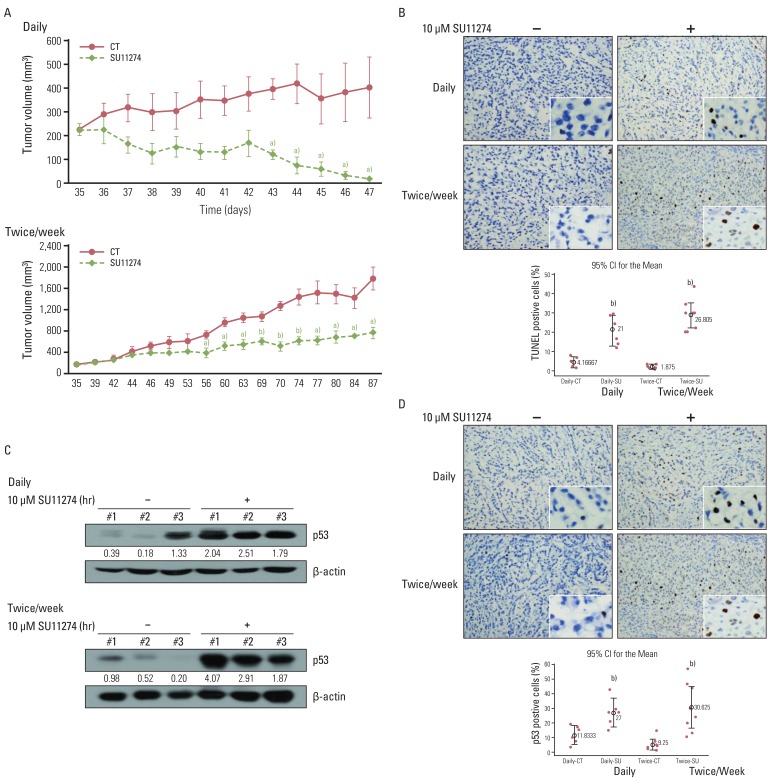 | Fig. 6Effects of SU11274 on tumor growth in A549 xenograft model. (A) Change of tumor volume after treatment with SU11274 daily and twice weekly for the indicated periods in the xenograft model. SU11274 (100 µg per xenograft) was administered on two schedules through intratumoral injections; it was administered daily for 13 days or twice weekly for 53 days. The tumor volume was recorded at the indicated times. n=7 (dimethyl sulfoxide [DMSO]-treated group [n=3] and SU11274-treated group [n=4]). Animal experiments were performed done twice independently. Points, mean value of three or four identical mice; bars, standard error. a)p<0.05, b)p<0.001. (B) Tumors were harvested on the last day, and apoptosis was assessed using the terminal deoxyribonucleotide transferase-mediated nick-end labeling (TUNEL) assay. Cells stained brown indicate apoptotic cells. CT, control; SU, SU11274. (C) Expression of p53 in tumor tissue harvested from A549 xenograft. Tumor tissue was lysed with homogenizer, resolved by 10% sodium dodecyl sulfate-polyacrylamide gel electrophoresis, and immunoblotted using p53 antibodies. Bands were quantified by densitometry. (D) Harvested tumor tissue was immunohistochemically examined with anti-p53 antibody. Brown color indicates the expression of p53 protein. The percentage of positive cells was determined from the following formula: The percentage of terminal deoxyribonucleotide transferase-mediated nick-end labeling/p53-positive cells=positive staining cells/total cells×100. Box, interquartile range of six-eight identical mice;⌖, mean value of six or eight identical mice. b)p<0.001 for comparisons between SU11274-treated and untreated mice. |


 PDF
PDF Citation
 Print
Print


 XML Download