

 PDF
PDF Citation
 Print
Print


Introduction
Glioblastoma multiforme (GBM) is one of the most common primary malignant brain tumors in adults [1,2]. Surgical excision combined with radiotherapy and chemotherapy is the choice of treatment; however, the overall prognosis remains poor, and the median survival rate of GBM patients is less than 18 months [3-5]. Currently, GBM is treated with surgical resection with concurrent radiotherapy and daily temozolomide (TMZ, 75 mg/m2) [6]. TMZ is an oral agent used for the treatment of GBM and melanoma; however, its therapeutic action depends on its ability to alkylate/methylate DNA. Because this methylation induces DNA damage and triggers the death of tumor cells, overexpression of a DNA repair enzyme known as O-6-methylguanine-DNA methyltransferase (MGMT) can diminish the therapeutic efficacy of TMZ. About half of secondary GBM patients show a higher expression profile of MGMT [7]. Other mechanisms including deregulation of cellular enzymes and membrane transporting proteins, genomic aberrations, and altered susceptibility to apoptosis may also be responsible for the higher incidence of chemo-resistance in GBM patients [8].
Mitogen-activated protein kinase phosphatases (MKPs) belong to the family of dual-specificity protein phosphatases, which dephosphorylate both tyrosine and serine/threonine residues of mitogen-activated protein kinases (MAPKs). MKPs are subdivided into three distinct groups based on gene structure, sequence similarity, substrate specificity, and subcellular localization [9,10]. MKP-1 is localized to the nucleus, and has a high specificity to MAPKs including p38 MAPK and c-Jun N-terminal kinase (JNK), but a relatively low specificity to extracellular signal-regulated kinase [11]. MKP-1 is induced by various chemotherapeutics and has been shown to inhibit drug-induced JNK activation and subsequent apoptotic cell death in breast cancers [12,13]. Reduction of MKP-1 expression levels using small interfering RNA (siRNA) increases chemosensitivity and JNK activity in lung and ovarian cancers [14]. In this study, we investigated whether highly expressed MKP-1 in human GBM cells is responsible for the chemo-resistance observed in these cells.
Go to : 
Materials and Methods
1. Reagents
Rabbit polyclonal antibodies against JNK, phospho-JNK, caspase-3, and cleaved caspase-3 were purchased from Cell Signaling Technologies (Beverly, MA). Cisplatin, cyclophosphoamide, doxorubicin, epirubicin, etoposide, 5-fluorouracil, gemcitabine, irinotecan, mitomycin C, and vincristine were purchased from Sigma-Aldrich (St. Louis, MO). Rabbit polyclonal anti-human MKP-1 and MKP-2 antibody were purchased from Santa Cruz Biotechnology (Santa Cruz, CA). JNK inhibitor (SP600125) was purchased from Calbiochem (La Jolla, CA).
2. Cell culture
Human GBM cell lines (U251-MG and LN215-MG) were maintained at 37℃ under an atmosphere of 5% CO2 and 95% air in Dulbecco's modified Eagle's medium (Welgene, Seoul, Korea) supplemented with 10% fetal bovine serum (Gibco, Gaithersburg, MD), 100 U/mL penicillin, 100 µg/mL streptomycin, and minimum essential medium (MEM) nonessential amino acids (Invitrogen, Carlsbad, CA). U373-MG and CRT-MG were maintained at 37℃ under an atmosphere of 5% CO2 and 95% air in RPMI 1640 medium (Welgene) supplemented with 10% fetal bovine serum (Gibco), 100 U/mL penicillin, 100 µg/mL streptomycin, and MEM nonessential amino acids (Invitrogen).
3. Transfection with siRNA for knockdown of MKP-1
siRNA for MKP-1 (5'-CUCAGUGUGUGAUCCGGUU-3') and a random sequence (control, 5'-CCUACGCCAAUUUCGU-3') siRNA were synthesized by Bioneer (Daejeon, Korea) and used for transfection, which was performed using Lipofectamine 2000 (Invitrogen) according to the manufacturer's protocols. For transient transfection, cells were plated at 5×10⁴ cells per well in six-well plates or 6×10⁵ cells per well in 60 mm dishes. The next day, cells were transfected with MKP-1 siRNA oligonucleotides or control siRNA using Lipofectamine 2000 (Invitrogen). After 48 hours of transfection, cells were treated in the presence or absence of various anti-cancer drugs. Transfection efficiency was then assessed using both quantitative real-time polymerase chain reaction (qRT-PCR) and western blotting of MKP-1.
4. Total RNA isolation and qRT-PCR analysis
Total RNA was isolated using an RNeasy Mini Kit (Qiagen, Hilden, Germany). Complementary DNA (cDNA) synthesis was performed with the SuperScript First-Strand Synthesis System (Invitrogen) according to the manufacturer's instructions, and qRT-PCR was performed using a LightCycler FastStart DNA Kit (Roche Applied Science, Mannheim, Germany) with the LightCycler 2.0 System. The MKP-1 primer sequences were 5'-CCTGTCCACTCCACGAACAGT-3' for the forward primer and 5'-GCTGGGAGAGGTCGTAATGG-3' for the reverse primer.
5. Cell viability assay
Cell viability was determined using WST-1 reagent (Nalgene, Rochester, NY) with a microplate reader (Bio-Rad, Richmond, CA) to measure the absorbance at 450 nm. Cell death was confirmed by staining with 100 nmol/L tetramethylrhodamine ethyl ester (Sigma, Taufkirchen, Germany). A total of 10,000 cells were analyzed using an LSRII flow cytometer (BD Bioscience, San Jose, CA).
6. Western blot analysis
Cell lysates were electrophoresed through 10% or 15% polyacrylamide gels and then transferred to polyvinylidene difluoride membranes (Millipore, Bedford, MA). The membranes were subsequently probed with the antibodies listed above, after which bound antibody was detected using the ECLplus Reagent (Amersham Pharmacia Biotech, Little Chalfont, UK) according to the manufacturer's protocols.
7. Microarray data-set
A microarray dataset was obtained from Gene Expression Omnibus (GEO) Series (GSE), and GSE ID GSE2223; probes 5382, 40027, and 40883 were used for MKP-1. Because the probe intensities were recorded on a log2 scale, the intensities were converted to a log10 scale [2^(probe intensity recorded in the dataset)], and averaged to give the final MKP-1 expression level.
8. Statistical analysis
All data are presented as the means±SEM. Statistical analyses of two independent samples were performed using a Student's t-test. Groups were compared by one-way ANOVA with Tukey's post-hoc test, which determines the significance of differences between means. A p < 0.05 was considered to be significant.
Go to :
Results
1. MKP-1 is highly expressed in human GBM tumors and GBM cell lines
Analysis of the cDNA microarray data provided by the GEO databases (GSE ID GSE2223) revealed that the MKP-1 mRNA expression levels were higher in brain tumor samples than normal samples, and that the amount of the increase was correlated with the grade of the tumor. Specifically, MKP-1 levels were only higher in GBM samples (grade IV) when compared to normal brain samples (Fig. 1A). We tested whether MKP-1 was also highly expressed in human GBM cell lines using immunoblot analysis (Fig. 1B). When compared to other cell types and human primary cultured astrocytes, MKP-1 was highly expressed in human GBM cell lines in the absence of any external stimulation. Because MKP-2 has a similar intracellular localization and substrate specificity as MKP-1, we examined the MKP-2 protein levels in the same cell type. Interestingly, there were no differences in the expression levels of MKP-2 between various tumor cell types. However, in two of the cell lines (CRT-MG and HepG2), MKP-2 was expressed at relatively higher levels than in the other cell types (Fig. 1C).
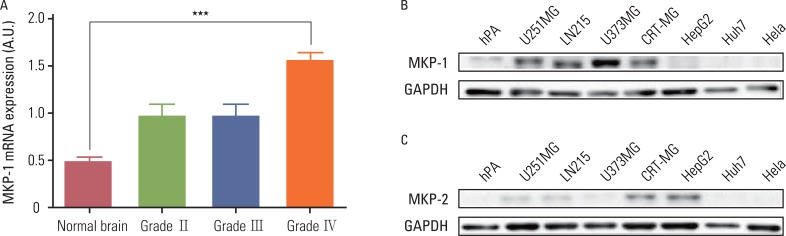 | Fig. 1MAP kinase phosphatase-1 (MKP-1) is highly expressed in human glioblastomas. (A) The expression of MKP-1 was evaluated using the microarray data of brain cancer patients provided by the Gene Expression Omnibus (GEO) database (GSE ID GSE2223). The results are presented as the means±SEM, and Tukey's post-hoc test was applied to significant group effects in ANOVA, ***p<0.001. (B) The expression of MKP-1 was measured by western blot analysis in human primary astrocytes, human glioblastomas (U251MG, LN215 and U373MG), human astroglioma (CRT-MG), human hepatomas (HepG2, Huh7), and human cervical adenocarcinoma (HeLa) cell lines. (C) The expression of MKP-2 was measured by western blot analysis in the same cell lines as in (B). GAPDH, glyceraldehyde 3-phosphate dehydrogenase; hPA, human primary culturesd astrocytes.
|
2. Downregulation of MKP-1 sensitizes GBM cells to cytotoxicity induced by chemotherapeutic agents
Induced expression of MKP-1 has been identified as one of the cancer resistance mechanisms in human breast, lung, and ovarian cancers. Therefore, we tested whether highly expressed MKP-1 plays a role in the high incidence of chemo-resistance in GBMs. To accomplish this, cells were transiently transfected with control or MKP-1-specific siRNA and then tested for drug-induced cytotoxicity. The knockdown efficiency of MKP-1 siRNA was confirmed by qRT-PCR and western blot analysis (Fig. 2A and B). The reduction of MKP-1 expression significantly enhanced drug-induced cytotoxicity in U251-MG cells for all of the drugs tested except doxorubicin, epirubicin, and cisplatin (Fig. 2C). Although the differences were not statistically significant, there were considerable increases in the cytotoxicity of these drugs against cells transfected with MKP-1 siRNA. Similar results were obtained using LN215 cells; however, MKP-1 knockdown did not significantly increase vincristine-induced cell death (data not shown).
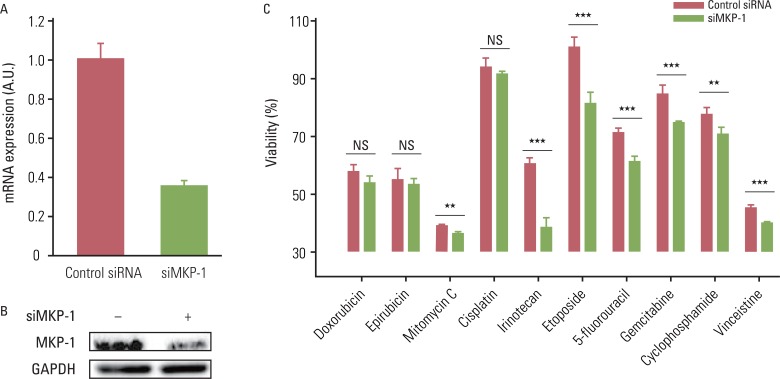 | Fig. 2The reduction of MAP kinase phosphatase-1 (MKP-1) expression increases sensitivity to anti-cancer drugs. (A) U251MG cells were transfected with control or MKP-1 specific siRNA (siMKP-1). After 48 hr of transfection, the transfection efficiency was determined by quantitative real-time polymerase chain reaction and normalized against glyceraldehyde 3-phosphate dehydrogenase (GAPDH) mRNA. (B) MKP-1 protein expression was determined by western blot analysis. (C) Cells were treated with 10 different anti-cancer drugs 24 hr after siRNA transfection at the concentrations listed in Table 1. Cell viability was then evaluated by a WST-1 assay. The results are presented as the mean±SEM (n=4). Asterisks indicate a significant difference as determined by a Student's t-test, **p<0.01, ***p<0.001, and NS, not significant. Table 1The concentrations of anti-cancer drugs used in this study
|
Because the effect of MKP-1 knockdown was most pronounced with irinotecan- and etoposide-induced cytotoxicity, we further examined the effect of MKP-1 siRNA transfection on drug-induced cell death under these conditions. Twenty four hours after transfection with control or MKP-1 siRNAs, cells were incubated in the presence or absence of varying doses of irinotecan or etoposide (Fig. 3). These results clearly indicate that MKP-1 may act as a mechanism of chemo-resistance in human GBM cells.
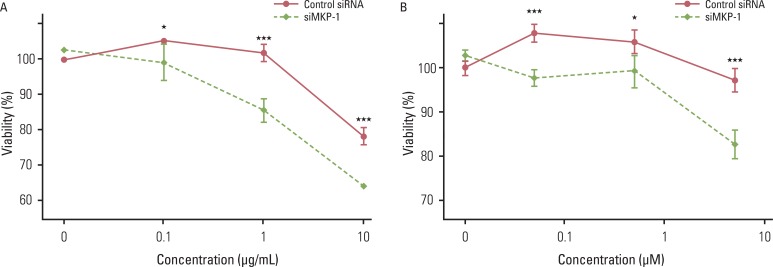 | Fig. 3The effect of MAP kinase phosphatase-1 (MKP-1) knockdown on irinotecan- and etoposide-induced cell death. Cells were transfected with control or MKP-1 specific siRNA (siMKP-1) for 48 hr, after which they were incubated with varying doses of irinotecan (A) or etoposide (B) for an additional 24 hr. Cell viability was evaluated by WST-1 assay. The results are presented as the mean±SEM (n=4). Asterisks indicate a significant difference as determined by a Student's t-test, *p < 0.05 and ***p < 0.001.
|
3. The JNK pathway is involved in MKP-1-mediated tumor resistance to chemotherapeutic agents
Anti-cancer drugs are thought to kill cancer cells via sustained activation of the JNK pathway. Thus, we tested whether the JNK pathway is also involved in MKP-1-mediated resistance to chemotherapeutic agents. Treatment with irinotecan or etoposide increased the phosphorylation of JNK, and this increase was dramatically enhanced by transient transfection with MKP-1 siRNA (Fig. 4A). Cleavage of caspase-3 into active fragments was also induced by treatment with irinotecan or etoposide, while MKP-1 knockdown markedly increased the cleavage of procaspase-3. Consistent with these results, the decrease in viability induced by concomitant treatment with irinotecan and MKP-1 siRNA was reversed by pre-incubation with a JNK inhibitor, SP600125 (Fig. 4B and C).
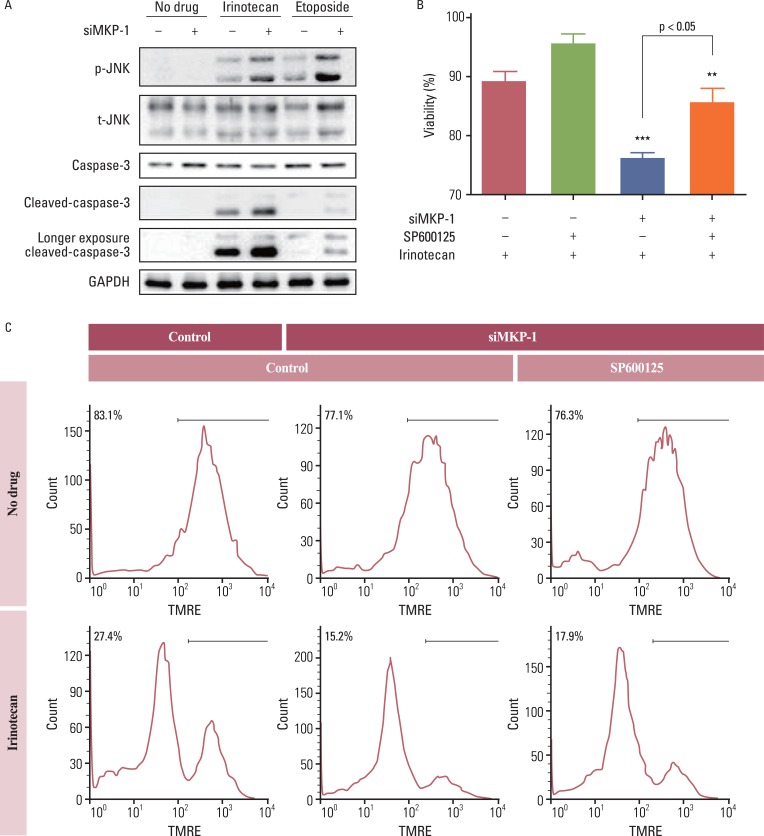 | Fig. 4The involvement of c-Jun N-terminal kinase (JNK) in irinotecan and etoposide-induced cell death. (A) Cells were transiently transfected with control or MAP kinase phosphatase-1 (MKP-1) specific siRNA (siMKP-1) for 48 hr, after which they were incubated in the presence or absence of irinotecan or etoposide (10 mg/L) for 15 min. Western blot analysis was used to determine the protein expression of phospho-JNK, total JNK, caspase-3, and cleaved caspase-3 in total cell lysates. (B) Cells were transiently transfected with control or siMKP-1 for 48 hr, after which they were incubated in the presence or absence of SP600125 (JNK inhibitor, 10 µmol/L) for 1 hr, and then treated in the presence or absence of irinotecan (10 mg/L) for an additional 24 hr. The cell viability was then evaluated by a WST-1 assay. The results are presented as the mean±SEM (n=4). Tukey's post-hoc test was applied to significant group effects in ANOVA, **p<0.01, ***p<0.001. (C) Cell viability was measured by flow cytometry after tetramethylrhodamine ethyl ester (TMRE; 100 nmol/L) staining. The labeled numbers indicate live cells. Images are representative of three independent experiments. p-JNK, phosphorylated JNK; t-JNK, total JNK; GAPDH, glyceraldehyde 3-phosphate dehydrogenase.
|
Go to :
Discussion
We found that MKP-1 is highly expressed in human GBMs and transformed GBM cell lines in the absence of external stimulation. We also found that high levels of MKP-1 are responsible for drug-resistance in a JNK-dependent manner. It has been reported that MKP-1 can be induced by various chemotherapeutic agents and can act as an anti-apoptotic mechanism in certain types of human malignancies. In contrast, our results clearly indicate that MKP-1 is constitutively expressed at relatively high levels in human GBM cells and confers resistance to a variety of chemotherapeutic agents in a JNK-dependent manner.
Due to diverse stimulations triggered by the tumor microenvironment, expression patterns of MKP-1 vary according to tumor types. In human breast cancer, the expression level of MKP-1 is constitutive in tissue surrounding the tumor and greater in tumor lesions [15]. Low-grade human colon cancer showed robust MKP-1 expression, but MKP-1 was down regulated in high-grade tumors [16]. As shown in Fig. 1, MKP-1 expression is higher in glioblastoma cell lines than in human primary astrocytes. These results imply that MKP-1 is highly correlated with tumor progression and contributes to subsequent drug resistance in glioblastoma.
While multiple mechanisms for multi-drug resistance (MDR) have been proposed, there are only a few considered to be primarily responsible for MDR in many human malignancies. First, cancer cells decrease the uptake of water-soluble drugs by downregulating specific transporters. Second, MDR can arise from mechanisms involving the increased activity of DNA damage repair enzymes, reduced apoptosis, and changes in the cell cycle and drug metabolism. Third, the induction of energy-dependent efflux of hydrophobic drugs can cause MDR via increased diffusion through the plasma membrane [17]. Unlike previous studies of MDR that address drug acceptability, we investigated the cell signaling associated with MDR. Because JNK and p38 MAPK are largely responsible for drug-induced apoptosis and are effective downstream targets of MKP-1 [14,18,19], we considered MKP-1 as a potential mechanism for MDR. We observed increased drug sensitivity after MKP-1 knockdown in human GBM cells, found the effect of this knockdown to be most pronounced in irinotecan- and etoposide-induced cytotoxicity. Irinotecan, in combination with bevacizumab was tested in a Phase 2 clinical study for recurrent glioblastoma. Although combination therapy provides impressive response rates, the mechanisms responsible for the clinical benefits in GBM patients remain unclear [20,21]. Etoposide is also being studied in a Phase 2 clinical trial and is commonly used in combination with carboplatin in recurrent GBM patients [22].
Go to :
Conclusion
These studies implicate MKP-1 as an important mediator of chemo-resistance. MKP-1 is highly expressed in the glioblastoma in the basal state, but not in normal brain cells. Overexpressed MKP-1 increases the resistance to anti-cancer drugs through inhibition of JNK phosphorylation. Therefore, MKP-1 is an attractive target for overcoming drug resistance in this highly refractory malignancy.
Go to :
 XML Download