

 PDF
PDF Citation
 Print
Print


Introduction
Breast cancer is one of the most common malignancies in women and is the second leading cause of cancer death [1]. In the modern era of breast cancer treatment, rapid progress has led to a broad spectrum of therapeutic strategies for improving clinical outcomes. In addition to improvements in therapeutic modalities including chemotherapy, radiation, hormone manipulation and surgery, immunotherapy has emerged as an effective adjunct for the treatment of breast cancer [2,3]. The possible use of immunotherapy in breast cancer treatment was suggested by several findings. One such finding was the detection of a protective effect of human leukocyte antigen (HLA) class II alleles in breast cancer [4,5]. Another finding was that T cells recognizing mucin (MUC)-1 and HER2/neu-derived antigens could be isolated from the peripheral blood of breast cancer patients [5,6]. Furthermore, graft-versus-tumor effects were shown to be induced by donor lymphocyte infusion in patients who relapsed after allogeneic stem cell transplantation [7].
Dendritic cells (DCs) are the major antigen-presenting cells of the immune system. Because of their ability to stimulate T cells, DCs act as a link in antitumor immune responses between innate immunity and adaptive immunity [8]. Once activated by inflammatory stimuli or infectious agents, immature DCs undergo maturation, which results in the expression of high levels of major histocompatibility complex (MHC) and co-stimulatory molecules which present antigens to activate T cells [9]. DC-based vaccines are the most attractive tool for cancer immunotherapy and have been used in more than 20 malignancies; most commonly melanoma, prostate cancer, colorectal carcinoma and multiple myeloma. In an attempt to increase the potency of DCs, alpha-type 1 polarized DCs (αDC1s) were developed through the use of cytokine combinations. The αDC1s are induced to mature by addition of an αDC1-polarizing cytokine cocktail containing interleukin (IL)-1β, tumor necrosis factor (TNF)-α, interferon (IFN)-α, IFN-γ and polyinosinic : polycytidylic acid [poly(I : C)]). Compared with standard DCs, αDC1s generate strong, functional cytotoxic T lymphocytes (CTLs) in several diseases [10,11].
The ideal DC-based vaccination in breast cancer would induce tumor-specific immunity to breast cancer without causing clinically significant autoimmunity. One approach to enhancing the specificity of vaccines is to target them against specific protein antigens that are over-expressed on breast cancer cells. These tumor antigens, such as MUC-1, HER2/neu and telomerase, are also expressed on tumor cells of other epithelial-derived cancers and are loaded onto DCs as a source of tumor antigen which will not target multiple tumor variants [12-14]. The use of whole tumor cells instead of a single protein antigen for tumor antigen in DCs, may help to enhance breast cancer-specific cytolytic effects with unfractionated tumor-derived antigens. However, it is not only impractical to obtain sufficient amounts of purified autologous tumor cells for tumor antigens from breast cancer patients, but it is also unsuitable for those with a lower tumor-burden status. Therefore, to overcome this limitation, allogeneic tumor cells or established cancer cell lines from various tumors have been used as an alternative source of tumor-relevant antigens [15-17].
In the present study, we investigated the possibility of immunotherapy using autologous αDC1s loaded with ultraviolet B (UVB)-irradiated cells from the allogeneic breast cancer cell line MCF-7. We studied whether these cells could generate breast-cancer-specific CTLs against autologous cancer cells in patients with breast cancer.
Go to : 
Materials and Methods
1. Generation of αDC1s
The schema for the generation of DCs is shown in Fig. 1. Peripheral blood was collected from HLA-A0201-positive (HLA-A0201+) breast cancer patients after obtaining informed consent according to the protocol approved by the Chonnam National University Hwasun Hospital Institutional Review Board. Monocytes were isolated from peripheral blood by a two-step procedure as previously reported [18]. Briefly, mononuclear cells were isolated from the peripheral blood by density gradient centrifugation with Ficoll-Hypaque (Lymphoprep, Nycomed, Norway). The monocyte and lymphocyte fractions were isolated on density gradients with Percoll (Sigma-Aldrich, St. Louis, MO). The monocyte fraction was resuspended in AIM-V medium (Gibco-BRL, Grand Island, NY) at a density of 5×10⁵ cells/500 µL and was allowed to adhere to 24-well plates for 45 minutes at 37℃ in 5% CO2.
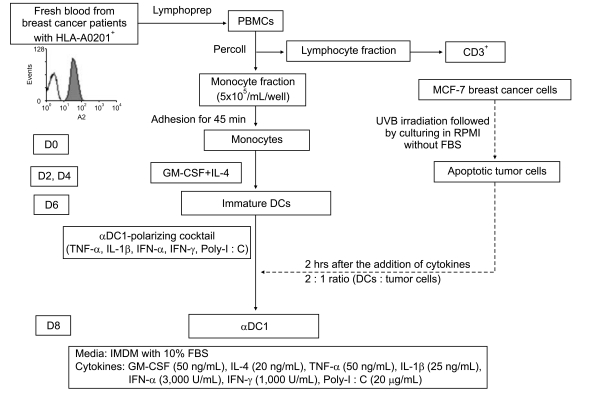 | Fig. 1Schema of the generation of dendritic cells (DCs) in patients with breast cancer in this study. PBMCs, peripheral blood mononuclear cells; D, day; GM-CSF, granulocyte-macrophage colony-stimulating factor; IL, interleukin; TNF, tumor necrosis factor; IFN, interferon; poly-I : C, polyinosinic : polycytidylic acid; αDC1, alpha-type 1 polarized DCs; IMDM, Iscove's Modified Dulbecco's medium; FBS, fetal bovine serum; UVB, ultraviolet B.
|
After removal of nonadherent cells by gentle washing, immature DCs were generated by culturing the adhered monocytes in IMDM (Gibco-BRL) supplemented with 10% heat-inactivated fetal bovine serum (Hyclone, Logan, UT) and 1% penicillin-streptomycin (Gibco-BRL) for 6 days in 24-well plates at a density of 5×10⁵ cells per well, in the presence of 50 ng/mL granulocyte-macrophage colony-stimulating factor (LG Biochemical, Daejeon, Korea) and 20 ng/mL IL-4 (R&D Systems, Minneapolis, MN). On day 6, the immature DCs were maturated with an αDC1-polarizing cocktail composed of IL-1β(25 ng/mL), TNF-α(50 ng/mL), IFN-α(3,000 units/mL, Intron-A-IFN-α-2b, Schering-Plough, Kenilworth, NJ), IFN-γ(1,000 units/mL, Strathmann Biotech, Hamburg, Germany) and poly(I : C) (20 µg/mL, Sigma-Aldrich). The mature αDC1s were then loaded with the UVB-irradiated tumor cells (HLA-A0201+) at a ratio of 2 : 1 at 2 hours after the addition of the maturating cytokines. The αDC1s loaded with apoptotic tumor cells were harvested on day 8.
2. Preparation of the UVB-irradiated tumor cells as an antigen source
To load tumor cells onto DCs, MCF-7 breast cancer cells (HLA-A0201+, adenocarcinoma, estrogen receptor positive) were irradiated with UVB (120 mJ/cm2) followed by overnight culture in RPMI-1640 (Gibco-BRL) without fetal bovine serum to induce apoptosis and were then thoroughly washed. The irradiated tumor cells were then loaded onto DCs 2 hours after the addition of maturating cytokines. The irradiated apoptotic cells were immediately confirmed by using annexin-V and propidium iodide (data not shown).
3. Preparation of breast cancer cells
Tumor tissues obtained from breast cancer patients by surgical resection were minced and lysed for 2-4 hours at 37℃ in AIM-V medium containing 0.4% collagenase type III. The mononuclear cells were separated by density gradient centrifugation with Ficoll-Hypaque (Lymphoprep) and cryopreserved until use as target cells in the cytotoxic assay.
4. Phenotypic expression of αDC1s and tumor-antigen uptake
Flow cytometry was performed using a FACSAria cell sorter (Beckon Dickinson, San Jose, CA) after labeling of cells with CD83-fluorescein isothiocyanate (FITC), CD86-FITC, and CCR7-FITC (PharMingen, San Diego, CA) and the relevant isotype controls (mouse IgG1 and IgG2a, PharMingen). Cell debris was eliminated from the analysis by forward- and side-scatter gating, and the data were analyzed with FACSDiva™ (Becton Dickinson, Heidelberg, Germany) and Win MDI ver. 2.9 (Bio-Soft Net).
To measure tumor-antigen uptake by αDC1s, MCF-7 cells were labeled with PKH67-GL-FITC (Sigma-Aldrich) before UVB-irradiation. After loading of tumor antigen onto DCs at a ratio of 1 : 2 on day 6, the αDC1s loaded with the apoptotic MCF-7 cells were stained with CD11c-phycoerythrin (PE) after harvesting on day 8 and were then analyzed by flow cytometry for tumor cell uptake (CD11c+/PKH67+). To morphologically confirm the tumor uptake of αDC1s, MCF-7 cells were labeled with PKH67-GL-Green and DCs were labeled with PKH26-GL-Red. The morphology of the cells' nuclei was observed by using a confocal microscope (Olympus, Center Valley, PA) at an excitation wave length of 350 nm for 4', 6-diamidino-2-phenylindole (DAPI) staining.
5. Cytokine analyses by enzyme-linked immunosorbent assay (ELISA)
The levels of IL-12p40, IL-12p70, IL-10 and IL-6 in the primary culture supernatants of the αDC1s were measured using Quantikine Immunoassay Kits (R&D Systems). Additionally, αDC1s harvested on day 8 were plated in 96-well plates at a density of 2×10⁴ cells/well and were stimulated with CD40L-transfected J558 cells (as an analogue of CD40L-expressing Th cells; a kind gift of Dr. P. Lane, University of Birmingham, UK) at a density of 5×10⁴ cells/well. After 24 hours, the supernatant was harvested, and the production of IL-12p70 was measured using ELISA kits (R&D Systems).
6. Allogeneic T cell stimulatory capacities
To examine the capacity of the DCs to stimulate the alloreactive T cells, allogeneic CD3+ T cells were obtained from peripheral blood mononuclear cells (PBMCs) from healthy donors by positive selection, using the magnetic activated cell sorter (MACS) system (Miltenyi Biotec, Auburn, CA). T cells (1×10⁶ cells) were labeled with 10 µM carboxyfluorescein diacetate succinimidyl ester (CFSE; Molecular Probes™, Invitrogen, Paisley, UK) for 10 minutes at 37℃. After 2 washes, the CFSE-labeled T cells (2×10⁴) were co-cultured with graded doses of irradiated (30 Gy) DCs. On day 5, the cultured cells were harvested and acquired on a FACSAria cell sorter (Becton Dickinson), and the data were analyzed with WinMDI ver. 2.9 software (Bio-Soft Net) to detect the dilution of CFSE dye. The results are expressed as the percentage of proliferated cells.
7. In vitro priming of CD4+CD45RA+ naïve T cells with DCs
Naïve CD4+ T cells were obtained from PBMCs of healthy volunteers by a negative selection process using a naïve CD4+ T isolation kit (MACS, Miltenyi Biotec). Purity of the isolated CD45RA+ cells was>95%, as determined by FACS assay with CD4-FITC and CD45RA-PE staining. CD4+CD45RA+ naïve T cells (2×10⁴) were stimulated with 2×10⁴ matured DCs that had been pre-incubated with 1 ng/mL of Staphylococcus aureus enterotoxin B in 96-well flat-bottomed plates. On day 5, 10 U/mL rIL-2 (R&D Systems) was added to each well. After 5 days, the cells were stimulated for 1 day with Dynabeads CD3/CD28 T Cell Expander (Invitrogen Dynal AS, Oslo, Norway). Supernatants from the re-stimulated cultures were assayed for Th1 cytokine, IFN-γ, and the Th2 cytokine, IL-4, using the BD OptEIA ELISA Set (BD Bioscience, San Diego, CA).
The production of Th1- and Th2-type cytokines at the single-cell level was measured by FACS analysis, using an intracellular cytokine staining protocol, as described previously [19]. Briefly, harvested T cells were stimulated with phorbol myristate acetate and ionomycin for 5 hours, and Brefeldin A (eBiosciences, San Diego, CA) was added during the last 2 hours of incubation. Cells were collected, fixed, permeabilized with a commercial IntraPrep Permeabilization Reagent (Beckman Coulter, Marseille, France) and were stained with FITC-labeled IFN-γ and PE-labeled IL-4 mAbs. The samples were acquired on a FACSAria cell sorter (Becton Dickinson) and were analyzed using WinMDI ver. 2.9 (Bio-Soft Net).
8. Induction of breast-cancer-specific CTLs
Autologous CD3+ T cells (purity>90%) were positively isolated using MACS (Miltenyi Biotec) from the lymphocyte fraction after Percoll isolation. T cells (1×10⁶ cells) were sensitized by autologous αDC1s (1×10⁵ cells) primed with apoptotic MCF7 cells. On day 3, rhuIL-2 (25 ng/mL, R&D Systems) and IL-7 (10 ng/mL, R&D Systems) were added. On day 10, the CTL lines were restimulated with the same DCs. On day 20, the number of antigen-specific T cells was analyzed by IFN-γ enzyme-linked immunospot (ELISPOT) assay. Autologous MCF-7 cells (HLA-A0201+ breast cancer cells), T-47D (HLA-A0201- breast cancer cells), PC-3 (prostate cancer cells) and K562 cells (chronic myeloid leukemia cells with natural killer [NK] cell activity) were used as target cells. To distinguish MHC-restricted cytotoxicity in CTL lines, IFN-γ-secreting cells were measured in the presence or absence of the mAbs W6/32 (MHC I antigen, 10 µg/mL). Additionally, autologous breast cancer cells obtained from patients were used as target cells with or without anti-MHC I antibody. The ELISOPT data were expressed as the mean number of spots (±standard deviation) per 0.5-2×10⁵ T cells.
Go to :
Results
1. Characteristics of mature and polarized DCs in patients with breast cancer
After induction of the immature DCs, αDC1s were generated by addition of the αDC1 cytokine cocktail. The αDC1s showed typical morphology with large and branching structures that were aggregated among the cells. Phenotypic analysis showed that expressions of maturation marker (CD83), co-stimulatory molecule (CD86) and the predictive marker of migratory ability (CCR7) were significantly higher in αDC1s than in immature DCs. However, there were no differences in phenotypic expression between the αDC1s and the αDC1s loaded with apoptotic MCF-7 cells (Fig. 2).
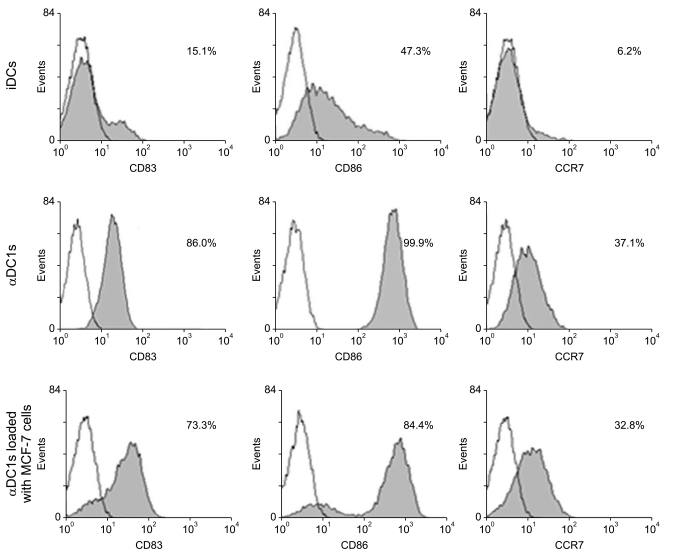 | Fig. 2Phenotypic expression of dendritic cells (DCs). The expressions of several molecules (CD83, CD86 and CCR7) related to DC maturation were significantly higher in the alpha-type 1 polarized DCs (αDC1s) than in the immature DCs (iDCs). However, there were no differences in phenotypic expression between the αDC1s and the αDC1s loaded with apoptotic MCF-7 breast cancer cells. Data are from one representative experiment of four independent experiments.
|
To measure tumor antigen uptake by DCs, DCs loaded with apoptotic tumor cells were stained with CD11c. As shown in Fig. 3A, αDC1s very efficiently incorporated the tumor antigen (median, 22.3±8.5%; n=4) as measured by flow cytometry (CD11c+/PKH-67+). By use of a confocal microscope, apoptotic MCF-7 cells (PKH-67) were morphologically identified in the αDC1s (PKH-26) (Fig. 3B).
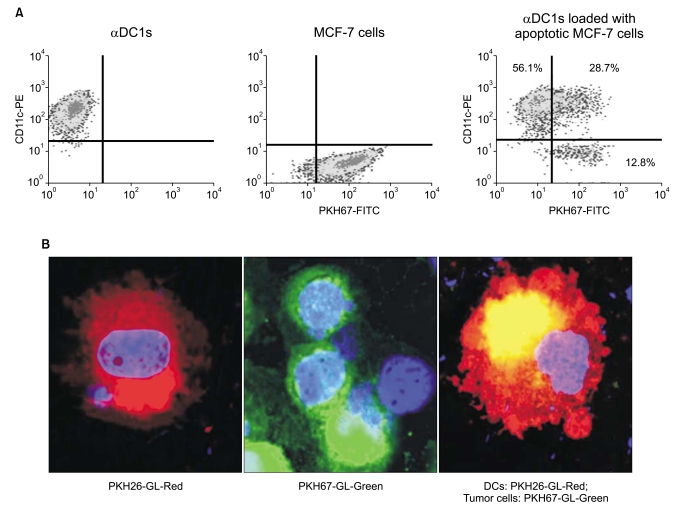 | Fig. 3Efficacy of tumor antigen uptake by dendritic cells (DCs). DCs were loaded with PKH67-labeled UVB-irradiated MCF-7 breast cancer cells (a ratio of 2 : 1) 2 hr after the addition of maturation-inducing cytokines on day 6. Mature DCs were harvested on day 8 and identified by CD11c expression. (A) The tumor antigen uptake of the alpha-type 1 polarized DCs (αDC1s) was measured by the percent of double-positive cells using flow cytometry. (B) After labeling MCF-7 cells with PKH67-GL-Green and DCs with PKH26-GL-Red, cell morphology was observed by using a confocal microscope at an excitation wavelength of 350 nm for DAPI. Apoptotic MCF-7 cells (yellow) were confirmed in the αDC1s.
|
2. High level of IL-12p70 production by αDC1s in breast cancer
One of best ways of determining DC function is to examine cytokine secretion. IL-12p70 is an important cytokine for stimulating naïve T cells for Th1 polarization to benefit cancer treatment, but IL-10 is the main inhibitory cytokine for cancer treatment. As shown in Fig. 4, the αDC1s showed high IL-12p70 production during maturation. Furthermore, the αDC1s showed further production of IL-12p70 after subsequent stimulation with CD40L-transfected J558 cells (Fig. 4). This cytokine capacity of αDC1s was not significantly suppressed by loading the cells with tumor antigen. By contrast, production of the inhibitory cytokine IL-10 by αDC1s was not significant. IL-6 production was significantly higher by the αDC1s than by the immature DCs, which is consistent with the finding of a previous report [20], suggesting Th17 polarization of αDC1s.
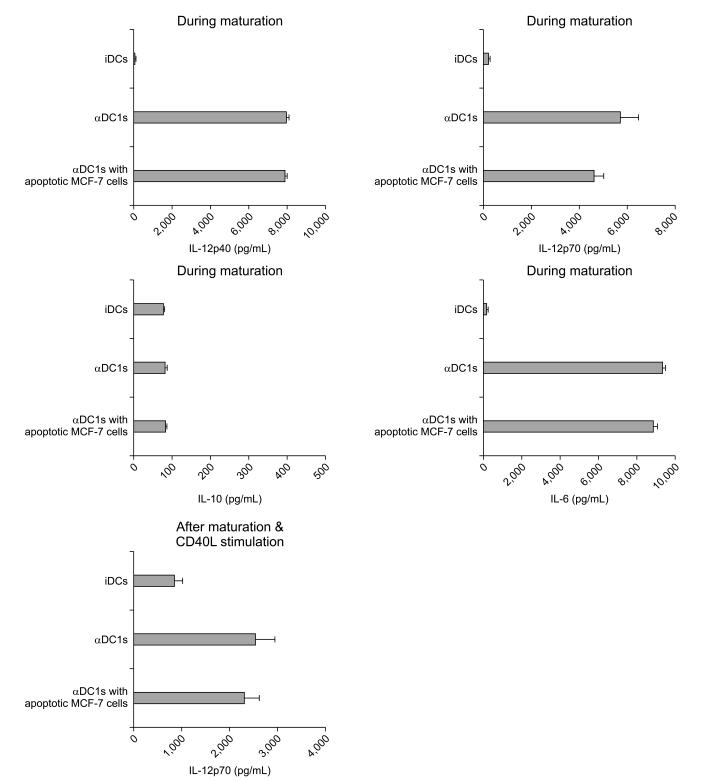 | Fig. 4Comparison of cytokine production by dendritic cells (DCs). Production of interleukin (IL)-12p40, IL-12p70, IL-10 and IL-6 during maturation of the alpha-type 1 polarized DCs (αDC1s) and the αDC1s loaded with apoptotic tumor cells and during re-stimulation with 40L-tranfected J558 cells for 24 hr after maturation. Results, expressed as mean (pg/mL)±standard deviation of triplicate cultures, are from one representative experiment of three. iDCs, immature DCs.
|
3. αDC1s in patients with breast cancer promoted Th1 polarization of naïve T cells
To confirm whether the αDC1s could induce the differentiation of naïve T cells toward Th1, the naïve T cells were stimulated by the DCs. The αDC1s induced naïve T cells to not only increase the level of IFN-γ secretion but also decrease the level of IL-4 secretion (Fig. 5A). This finding suggests that αDC1s strongly promote Th1 polarization of naïve T cells in patients with breast cancer. This Th1 response was confirmed by flow cytometry to analyze the production of Th1-type and Th2-type cytokines at the single-cell level. The αDC1s could induce Th1 polarization (IFN-γ producing cells: 46.9%) compared with immature DCs (30.3%) (Fig. 5B).
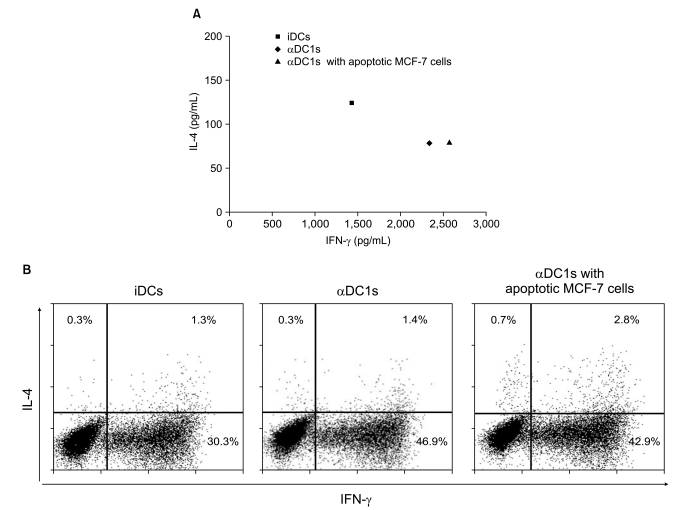 | Fig. 5Alpha-type 1 polarized DCs (αDC1s) induce naïve CD4+ T cells to secrete Th1 cytokines. Allogeneic naïve CD4+CD45RA+ T cells were primed with DCs for 5 days and then stimulated with rIL-2. On day 10, the cells were re-stimulated with Dynabeads CD3/CD28 T cell expander for 1 day. (A) Interleukin (IL)-4 and interferon (IFN)-γ levels measured in culture supernatants by enzyme-linked immunosorbent assay. (B) IL-4 and IFN-γ expression by intracellular staining at the single-cell level. The results are one representative experiment of three independent experiments and are expressed as the percent of cytokine-producing cells. iDCs, immature DCs.
|
4. αDC1s in patients with breast cancer showed strong allogeneic T cell stimulatory capacities
To evaluate the ability of DCs to stimulate T cell proliferation, allogeneic CD3+ T cells obtained from healthy donors were stimulated with DCs and an allogeneic mixed lymphocyte reaction assay was performed using the CFSE-based proliferation assay. As shown in Fig. 6, the percentage of proliferated T cells was significantly higher after stimulation of αDC1s than after stimulation of immature DCs and was dependent on the DC to T cell ratio. Loading of apoptotic tumor cells onto αDC1s did not significantly affect T cell proliferation.
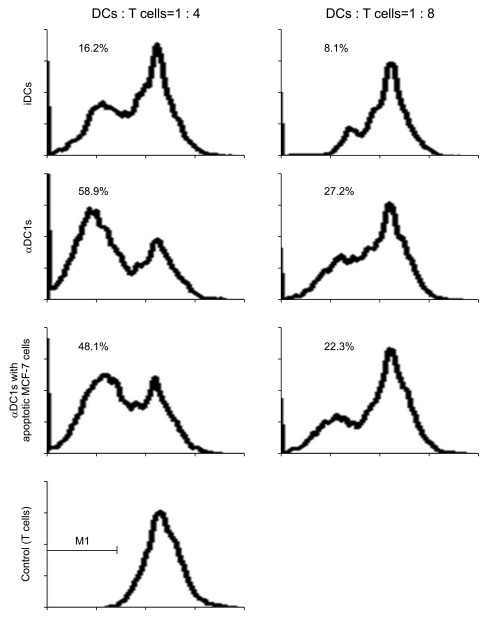 | Fig. 6Comparison of allogeneic T cell stimulatory capacities of dendritic cells (DCs). In a carboxyfluorescein diacetate succinimidyl ester (CFSE)-based proliferation assay, CFSE-labeled allogeneic CD3+ T cells (20,000 cells/well) were stimulated for 5 days with graded doses of irradiated DCs. Flow cytometry was used to measure the percent of CFSE-proliferated cells. The stimulatory capacity of the alpha-type 1 polarized DCs (αDC1s) was significantly higher in a dose-dependent manner than that of the immature DCs (iDCs), and there was no effect on T cell proliferation by loading of apoptotic tumor cells onto αDC1s. Data are representative histograms of fluorescence-activated cell sorting analysis from one of three independent experiments.
|
5. Strong breast-cancer-specific CTLs were induced by potent DCs loaded with apoptotic allogeneic breast cancer cells
We next determined the tumor-specific generation of CTLs by DCs. The secretion of IFN-γ by the CTLs was measured in three independent experiments using the ELISPOT assay. Primed CD3+ T cells generated by the αDC1s loaded with apoptotic MCF-7 breast cancer cells, showed a larger number of IFN-γ-producing cells against MCF-7 breast cancer cells (Fig. 7A) and against autologous breast cancer cells obtained from breast tumor tissue (Fig. 7C), but not against irrelevant target cells such as T-47D (HLA-A0201- breast cancer cells) and PC-3 (prostate cancer cells). The specificity of the CTL response was confirmed by inhibition of IFN-γ-release with MHC class I-blocking mAb, indicating HLA class I-restricted action. When we used αDC1s without loading of apoptotic breast cancer cells as a control, the CTLs generated showed a fewer number of IFN-γ-producing cells against MCF-7 breast cancer cells (Fig. 7B). To evaluate the specificity of the cytotoxic response by CTLs, K562 cells, which are NK cell-sensitive chronic myeloid leukemia cells, were used as the target cells. Fewer IFN-γ-secreting cells were found against K562, which suggests a CTL-mediated, rather than an NK cell-mediated breast cancer response.
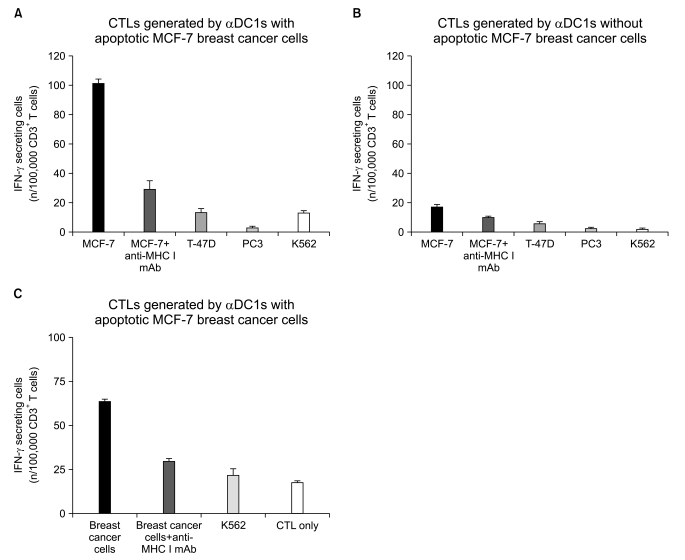 | Fig. 7Ezyme-linked immunospot (ELISPOT) assay to measure the interferon (IFN)-γ release of breast-cancer-specific cytotoxic T lymphocytes (CTLs). Autologous CD3+ T cells were stimulated with dendritic cells (DCs) loaded with apoptotic MCF-7 cells two times every 10 days. On day 20, the CTLs were co-cultured with autologous target cells (MCF-7, HLA-A0201+) and irrelevant target cells (T-47D, HLA-A0201- breast cancer cells; PC3, prostate cancer cells; K562, natural killer cell-sensitive chronic myeloid leukemia cells). (A) Number of IFN-γ-secreting cells from CTLs stimulated with the MCF-7-loaded-alpha-type 1 polarized DCs (αDC1s) (A) and the MCF-7-unloaded-αDC1s (B). Anti-major histocompatibility complex (MHC) class I antibodies were used to confirm the MHC class I-restricted recognition of breast-cancer-specific CTLs. Breast cancer cells were isolated from tumor tissue of patients and the CTLs were co-cultured with the breast cancer cells as target cells (C). The ELISPOT data are the mean (±standard deviation) number of IFN-γ-producing cells of triplicate cultures in three independent experiments.
|
Go to :
Discussion
The development of breast cancer immunotherapies using molecular typing or genomic identification of breast cancer antigen has confirmed that specific biological types of breast cancer exist with different levels and patterns of antigen expression [21,22]. The identification of multiple antigenic targets in breast cancer should enable a potent antigen-specific immune response. In this report we have suggested an alternative approach to immunotherapy in which allogeneic cancer cells are used as a tumor-specific antigen for loading onto DCs. We successfully generated αDC1s from breast cancer patients, and the cells showed a high expression level for molecules related to DC maturation, significant production of IL-12p70, and potent generation of breast-cancer-specific CTLs. Additionally, the αDC1s demonstrated strong IL-12p70 production after CD40L stimulation and had a potent capacity to induce Th1 polarization on the basis of their high production of IFN-γ. The CTLs generated by the αDC1s demonstrated breast-cancer-specific killing effects in an MHC class I-restricted manner.
In clinical practice, allogeneic breast cancer cells prepared from MCF-7 cells might be an effective source of universal tumor antigen that could be used for loading onto αDC1s for the generation of breast-cancer-specific CTLs. This approach is similar to recent studies in other diseases showing that fusion cells generated by autologous DCs and allogeneic tumor cell lines could generate antigen-specific CTL responses [23,24]. The use of allogeneic cancer cells can avoid the necessary process of original tumor cell collection and simplify the culture of tumor cells [23,25]. Vaccination with autologous DCs primed with allogeneic tumor cell lines has potential applicability to the field of antitumor immunotherapy. These universal cell lines would provide several advantages for clinical applications, such as no limiting factor affecting tumor cell preparation and well-characterized features as a source of tumor-associated antigens.
We demonstrated that autologous αDC1s loaded with apoptotic MCF-7 cells could prime T cells to generate the tumor-specific CTLs, which can kill breast cancer cells. More importantly, the pulsed αDC1s from the HLA-A0201+ patients could induce CTL activity against autologous breast cancer cells, and the pulsed αDC1s from HLA0201- patients generated a breast-cancer-specific CTL response with less potency than the response generated from HLA0201+ cells. The autologous αDC1s pulsed with apoptotic MCF-7 cells from HLA-A0201+ patients could stimulate alloreactive T cells due to the presence of allogeneic HLA class I molecules from an allogeneic breast cancer cell line. Moreover, alloreactive T cells could secrete cytokines, which may contribute to enhancement or maintenance of the tumor-specific CTL response. The inhibition of MHC class molecules by use of anti-MHC class antibody prevented the development of CTL responses specific for autologous breast cancer cells from HLA-A0201+ patients. Thus, the use of an allogeneic tumor cell line as a source of tumor antigens could generate MHC class-restricted T cell responses against autologous breast cancer cells. A major drawback of this approach is the need to perform HLA typing of patients and allogeneic tumor cell lines.
Go to :
 XML Download