

 PDF
PDF Citation
 Print
Print


Introduction
Cancer has been the leading cause of death in Korea since 1983 [1] and has drawn much attention in public health. Over 170,000 new cancer cases are diagnosed annually in Korea and one out of four deaths results from cancer [2,3]. This paper gives an overview of the nationwide cancer statistics, including the incidence, mortality, prevalence, survival rates and their trends in Korea.
1. Data sources
The Ministry of Health and Welfare, Korea had initiated a nationwide hospital-based cancer registry as early as 1980 called the Korea Central Cancer Registry (KCCR). The registry collected approximately 80-90% cancer cases from more than 150 training hospitals across the country every year. From 1999, the KCCR expanded cancer registration to cover the whole population under the Population-Based Regional Cancer Registry (PB-RCR) program. Details of the history, objectives, and activities of the KCCR have been documented [4]. Incidence data from 1999 to 2008 were obtained from the Korea National Cancer Incidence Database (KNCI DB). Cancer cases were classified according to the International Classification of Diseases for Oncology 3rd edition [5] and converted according to the International Classification of Diseases 10th edition (ICD-10) [6]. The survival analysis used 1,623,046 cancer cases first diagnosed during 1993-2008 from the KNCI DB, and followed the vital status through 31 December 2009.
Mortality data from 1983 to 2008 were obtained from the Korea National Statistics Office (KNSO) [1]. Cause of death was coded and classified according to the ICD-10. The population data were also obtained from KNSO using the resident registration population on July 1st of specified years.
Go to : 
Analysis
Crude rates (CRs) and age-specific rates of cancer incidence and mortality were calculated. Age-standardized rates (ASRs) were determined using the World Health Organization (WHO) world standard population [7]. The cumulative risks of cancer incidence, which represent the probability of developing cancer to life expectancy, were also calculated. Changes in the annual age-standardized cancer incidence rates were examined by calculating the annual percentage change over a time period as (exp(b)-1)x100, where b is the slope of the regression of log ASR on a calendar year [8].
In order to assess the level of cancer burden, prevalence was also estimated which represents new and pre-existing cancer cases diagnosed during a given period of time and still alive on an index date. Using the cancer incidence database from 1999 to 2008, we calculated the limited-duration prevalence, such as 1, 5, and 10-year prevalence. In this study, for example, 10-year prevalence was calculated from the number of people alive on January 1, 2009 who were diagnosed with cancer within the previous 10 years. We applied the counting method using SEER*Stat software [9] to calculate the number of prevalent cases while adjusting for the patients lost in follow-up [8].
The survival duration of each case was determined as the time difference between the date of initial diagnosis and the date of death, date of loss to follow-up, or closing date for follow-up. Observed survival rates were calculated using a life table method and relative survival rates were examined with the Ederer II method [10] using an algorithm written in SAS by Dickman [11], with some minor modifications.
Go to :
Selected Findings
1. Incidence
Table 1 presents the overall number of cancer incident cases, deaths and prevalent cases during 2008 in Korea by sex and cancer site. In 2008, 178,816 cancer incident cases and 68,912 deaths were observed in Korea. As of January 1, 2009, there were 724,663 10-year cancer prevalent cases observed in Korea. The cumulative risks for developing cancer to the life expectancy were 37.2% for men and 30.5 for women in 2008.
Table 1
Number of cancer incidence cases, deaths, and prevalent cases by sex during 2008 in Korea
| Sites | New cases | Deaths | 10-yr prevalent cases a) | ||||||
|---|---|---|---|---|---|---|---|---|---|
|
|
|
|
|||||||
| Both sexes | Male | Female | Both sexes | Male | Female | Both sexes | Male | Female | |
| All sites | 178,816 | 93,017 | 85,799 | 68,912 | 43,785 | 25,127 | 724,663 | 334,329 | 390,334 |
| Lip, oral cavity, and pharynx | 2,557 | 1,899 | 658 | 969 | 761 | 208 | 11,304 | 7,728 | 3,576 |
| Esophagus | 2,181 | 1,986 | 195 | 1,385 | 1,244 | 141 | 5,216 | 4,717 | 499 |
| Stomach | 28,078 | 18,898 | 9,180 | 10,312 | 6,712 | 3,600 | 134,722 | 89,616 | 45,106 |
| Colon and rectum | 22,623 | 13,536 | 9,087 | 6,802 | 3,809 | 2,993 | 103,033 | 60,448 | 42,585 |
| Liver | 15,663 | 11,776 | 3,887 | 11,292 | 8,512 | 2,780 | 36,036 | 27,085 | 8,951 |
| Gallbladder b) | 4,378 | 2,149 | 2,229 | 3,459 | 1,698 | 1,761 | 9,935 | 5,076 | 4,859 |
| Pancreas | 4,320 | 2,404 | 1,916 | 3,767 | 2,135 | 1,632 | 4,780 | 2,663 | 2,117 |
| Larynx | 1,073 | 998 | 75 | 409 | 364 | 45 | 6,385 | 5,977 | 408 |
| Lung | 18,774 | 13,384 | 5,390 | 14,791 | 10,899 | 3,892 | 34,926 | 23,465 | 11,461 |
| Breast | 12,659 | 75 | 12,584 | 1,731 | 13 | 1,718 | 79,468 | 381 | 79,087 |
| Cervix uteri | 3,888 | - | 3,888 | 954 | - | 954 | 33,102 | - | 33,102 |
| Corpus uteri | 1,562 | - | 1,562 | 210 | - | 210 | 9,084 | - | 9,084 |
| Ovary | 1,816 | - | 1,816 | 834 | - | 834 | 9,732 | - | 9,732 |
| Prostate | 6,471 | 6,471 | - | 1,168 | 1,168 | - | 23,940 | 23,940 | - |
| Testis | 176 | 176 | - | 14 | 14 | - | 1,408 | 1,408 | - |
| Kidney | 3,228 | 2,220 | 1,008 | 655 | 461 | 194 | 15,243 | 10,265 | 4,978 |
| Bladde | 3,230 | 2,582 | 648 | 1,007 | 752 | 255 | 18,260 | 14,845 | 3,415 |
| Brain and CNS | 1,620 | 876 | 744 | 1,040 | 568 | 472 | 6,273 | 3,289 | 2,984 |
| Thyroid | 26,923 | 4,275 | 22,648 | 347 | 108 | 239 | 107,693 | 15,252 | 92,441 |
| Hodgkin lymphoma | 210 | 127 | 83 | 46 | 31 | 15 | 1,253 | 796 | 457 |
| Non-Hodgkin lymphoma | 3,475 | 1,936 | 1,539 | 1,343 | 814 | 529 | 16,142 | 8,873 | 7,269 |
| Multiple myeloma | 893 | 480 | 413 | 615 | 316 | 299 | 2,464 | 1,295 | 1,169 |
| Leukemia | 2,561 | 1,432 | 1,129 | 1,507 | 867 | 640 | 9,936 | 5,442 | 4,494 |
| Other and ill-defined | 10,457 | 5,337 | 5,120 | 4,255 | 2,539 | 1,716 | 44,328 | 21,768 | 22,560 |
CNS, central nervous system. a)10-yr prevalent cases: limited-duration prevalent cases on January 1, 2009. These are patients that were diagnosed between January 1, 1999 and December 31, 2008 and were alive on January 1, 2009. Multiple primary cancer cases were counted multiple times, b)Includes gallbladder and other/unspecified parts of biliary tract.
![]()
Table 2 shows the cancer incidence rates by sex in 2008. The CRs of all sites combined in 2008 were 375.7 and 348.1 per 100,000 in men and women, respectively. The ASRs of all sites combined were 318.5 and 245.3 per 100,000 in men and women, respectively. In males, the five leading primary sites of cancer were the stomach (CR, 76.3; ASR, 63.8), colon and rectum (CR, 54.7; ASR, 45.9), lung (CR, 54.1; ASR, 46.9), liver (CR, 47.6; ASR, 38.9), and prostate (CR, 26.1; ASR, 23.0), accounting for 68.9% of all newly diagnosed cancers in 2008. In females, the most common cancer sites were the thyroid (CR, 91.9; ASR, 68.6), breast (CR, 51.1; ASR, 36.8), stomach (CR, 37.2; ASR, 24.9), colon and rectum (CR, 36.9; ASR, 24.7), lung (CR, 21.9; ASR, 13.9), and cervix uteri (CR, 15.8; ASR, 11.2), accounting for 73.2% of all newly diagnosed cancers. Thyroid cancer alone accounted for 26.4% (22,648) of incident cases in women in 2008.
Table 2
Crude and age-standardized cancer mortality rates by sex during 2008 in Korea
| Sites | Crude incidence rates/100,000 | Age-standardized incidence rates/100,000 a) | ||||
|---|---|---|---|---|---|---|
|
|
|
|||||
| Both sexes | Male | Female | Both sexes | Male | Female | |
| All sites | 361.9 | 375.7 | 348.1 | 271.1 | 318.5 | 245.3 |
| Lip, oral cavity, and pharynx | 5.2 | 7.7 | 2.7 | 3.9 | 6.4 | 1.9 |
| Esophagus | 4.4 | 8.0 | 0.8 | 3.3 | 6.9 | 0.5 |
| Stomach | 56.8 | 76.3 | 37.2 | 42.2 | 63.8 | 24.9 |
| Colon and rectum | 45.8 | 54.7 | 36.9 | 34.1 | 45.9 | 24.7 |
| Liver | 31.7 | 47.6 | 15.8 | 23.7 | 38.9 | 10.5 |
| Gallbladder b) | 8.9 | 8.7 | 9.0 | 6.4 | 7.5 | 5.5 |
| Pancreas | 8.7 | 9.7 | 7.8 | 6.3 | 8.3 | 4.8 |
| Larynx | 2.2 | 4.0 | 0.3 | 1.6 | 3.4 | 0.2 |
| Lung | 38.0 | 54.1 | 21.9 | 27.7 | 46.9 | 13.9 |
| Breast | 25.6 | 0.3 | 51.1 | 18.7 | 0.3 | 36.8 |
| Cervix uteri | 7.9 | - | 15.8 | 5.8 | - | 11.2 |
| Corpus uteri | 3.2 | - | 6.3 | 2.4 | - | 4.6 |
| Ovary | 3.7 | - | 7.4 | 2.8 | - | 5.5 |
| Prostate | 13.1 | 26.1 | - | 9.6 | 23.0 | - |
| Testis | 0.4 | 0.7 | - | 0.4 | 0.7 | - |
| Kidney | 6.5 | 9.0 | 4.1 | 5.0 | 7.4 | 3.0 |
| Bladder | 6.5 | 10.4 | 2.6 | 4.7 | 9.0 | 1.6 |
| Brain and CNS | 3.3 | 3.5 | 3.0 | 2.9 | 3.3 | 2.6 |
| Thyroid | 54.5 | 17.3 | 91.9 | 40.8 | 13.1 | 68.6 |
| Hodgkin lymphoma | 0.4 | 0.5 | 0.3 | 0.4 | 0.5 | 0.3 |
| Non-Hodgkin lymphoma | 7.0 | 7.8 | 6.2 | 5.5 | 6.7 | 4.6 |
| Multiple myeloma | 1.8 | 1.9 | 1.7 | 1.4 | 1.6 | 1.2 |
| Leukemia | 5.2 | 5.8 | 4.6 | 5.0 | 5.7 | 4.3 |
| Other and ill-defined | 21.2 | 21.6 | 20.8 | 16.5 | 19.1 | 4.3 |
![]()
2. Mortality
There were 68,912 cancer deaths reported in Korea during 2008, accounting for 28.0% of all deaths (Table 3). In 2008, The CRs of all sites combined were 176.9 and 101.9 per 100,000 for men and women, respectively. The ASRs of all sites combined were 154.1 and 63.5 per 100,000 for men and women, respectively. Cancers of the lung, liver, stomach and colon and rectum were the most common fatal cancers, which accounted for about 62.7% of all cancer deaths in 2008 (Table 4).
Table 3
Ten leading causes of death during 2008 in Korea
| Rank | Cause of deaths | No. of death | Percent of all deaths | Age-standardized death rate a) |
|---|---|---|---|---|
| All causes | 246,113 | 100 | 365.3 | |
| 1 | Cancer | 68,912 | 28 | 101.0 |
| 2 | Cerebrovascular disease | 27,932 | 11.3 | 39.1 |
| 3 | Heart disease | 21,429 | 8.7 | 30.6 |
| 4 | Intentional self harm (suicide) | 12,858 | 5.2 | 20.3 |
| 5 | Diabetes mellitus | 10,234 | 4.2 | 14.5 |
| 6 | Chronic lower respiratory diseases | 7,338 | 3.0 | 10.1 |
| 7 | Transport accidents | 7,287 | 3.0 | 12.1 |
| 8 | Disease of liver | 7,164 | 2.9 | 10.7 |
| 9 | Pneumonia | 5,461 | 2.2 | 7.7 |
| 10 | Hypertensive diseases | 4,724 | 1.9 | 6.6 |
| Others | 72,774 | 29.6 | 112.6 |
![]()
Table 4
Crude and age-standardized cancer mortality rates by sex during 2008 in Korea
| Sites | Crude mortality rates/100,000 | Age-standardized mortality rates/100,000 a) | ||||
|---|---|---|---|---|---|---|
|
|
|
|||||
| Both sexes | Male | Female | Both sexes | Male | Female | |
| All sites | 139.5 | 176.9 | 101.9 | 101.0 | 154.1 | 63.5 |
| Lip, oral cavity, and pharynx | 2.0 | 3.1 | 0.8 | 1.4 | 2.6 | 0.5 |
| Esophagus | 2.8 | 5.0 | 0.6 | 2.1 | 4.4 | 0.3 |
| Stomach | 20.9 | 27.1 | 14.6 | 14.8 | 23.5 | 8.7 |
| Colon and rectum | 13.8 | 15.4 | 12.1 | 9.8 | 13.5 | 7.3 |
| Liver | 22.9 | 34.4 | 11.3 | 16.9 | 28.5 | 7.2 |
| Gallbladder b) | 7.0 | 6.9 | 7.1 | 4.9 | 6.1 | 4.1 |
| Pancreas | 7.6 | 8.6 | 6.6 | 5.5 | 7.5 | 4.0 |
| Larynx | 0.8 | 1.5 | 0.2 | 0.6 | 1.3 | 0.1 |
| Lung | 29.9 | 44.0 | 15.8 | 21.3 | 38.7 | 9.4 |
| Breast | 3.5 | 0.1 | 7.0 | 2.6 | 0.0 | 4.9 |
| Cervix uteri | 1.9 | - | 3.9 | 1.4 | - | 2.5 |
| Corpus uteri | 0.4 | - | 0.9 | 0.3 | - | 0.6 |
| Ovary | 1.7 | - | 3.4 | 1.2 | - | 2.3 |
| Prostate | 2.4 | 4.7 | - | 1.6 | 4.6 | - |
| Testis | 0.0 | 0.1 | - | 0.0 | 0.1 | - |
| Kidney | 1.3 | 1.9 | 0.8 | 1.0 | 1.6 | 0.5 |
| Bladder | 2.0 | 3.0 | 1.0 | 1.4 | 2.8 | 0.5 |
| Brain and CNS | 2.1 | 2.3 | 1.9 | 1.7 | 2.0 | 1.4 |
| Thyroid | 0.7 | 0.4 | 1.0 | 0.5 | 0.4 | 0.5 |
| Hodgkin lymphoma | 0.1 | 0.1 | 0.1 | 0.1 | 0.1 | 0.0 |
| Non-Hodgkin lymphoma | 2.7 | 3.3 | 2.1 | 2.0 | 2.8 | 1.4 |
| Multiple myeloma | 1.2 | 1.3 | 1.2 | 0.9 | 1.1 | 0.8 |
| Leukemia | 3.1 | 3.5 | 2.6 | 2.6 | 3.2 | 2.0 |
| Other and ill-defined | 8.6 | 10.3 | 7.0 | 6.3 | 9.1 | 4.4 |
![]()
In men, the five leading primary cancer sites for mortality in 2008 were the lung (CR, 44.0; ASR, 38.7), liver (CR, 34.4; ASR, 28.5), stomach (CR, 27.1; ASR, 23.5), colon and rectum (CR, 15.4; ASR, 13.5), and pancreas (CR, 8.6; ASR, 7.5). In women, lung cancer mortality (CR, 15.8; ASR, 9.4) increased gradually being the first cancer site for mortality in 2008, followed by stomach (CR, 14.6; ASR, 8.7), colon and rectum (CR, 12.1; ASR, 7.3), liver (CR, 11.3; ASR, 7.2), and gallbladder (CR, 7.1; ASR, 4.1).
3. Trends in cancer incidence
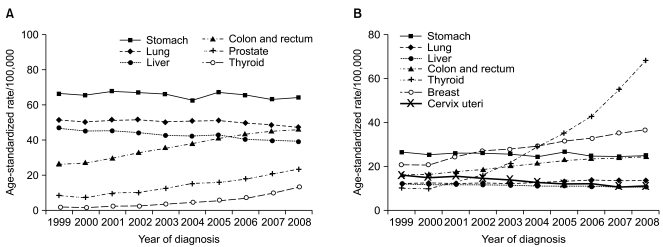
Tables 5-7 present the cancer incidence rates during 1999-2008 in Korea for all sites combined and for selected cancer sites. The incidence rate for all sites combined increased by 3.1% annually from 1999 to 2008. The incidence rate for all sites combined increased by 1.5% annually in men and by 5.1% in women from 1999 to 2008. The rapid increase in cancer incidence is also illustrated in Fig. 1.
 | Fig. 1Annual age-standardized cancer incidence and death rates for all sites by sex during 1983-2008 in Korea. Age-standardization was based on the World Health Organization (WHO) world standard population.
|
Table 5
Trends in cancer incidence rates in both sexes during 1999-2008 in Korea
| Sites | Year | APC a) | |||||||||
|---|---|---|---|---|---|---|---|---|---|---|---|
|
|
|||||||||||
| 1999 | 2000 | 2001 | 2002 | 2003 | 2004 | 2005 | 2006 | 2007 | 2008 | ||
| All sites | 210.5 | 205.1 | 216.7 | 220.1 | 227.1 | 234.1 | 246.7 | 250.5 | 260.8 | 271.1 | 3.1 b) |
| Lip, oral cavity, and pharynx | 3.6 | 4.4 | 3.6 | 3.7 | 3.8 | 3.8 | 3.8 | 3.7 | 3.8 | 3.9 | 0.1 |
| Esophagus | 4.1 | 3.7 | 3.9 | 3.8 | 3.6 | 3.5 | 3.5 | 3.4 | 3.3 | 3.3 | -2.1 b) |
| Stomach | 43.6 | 42.3 | 44.0 | 43.6 | 43.2 | 41.1 | 44.3 | 42.7 | 41.6 | 42.2 | -0.3 |
| Colon and rectum | 20.4 | 21.0 | 22.9 | 24.7 | 26.8 | 28.5 | 30.8 | 32.2 | 33.3 | 34.1 | 6.4 b) |
| Liver | 27.9 | 26.7 | 27.3 | 26.5 | 25.7 | 25.5 | 25.8 | 24.5 | 24.2 | 23.7 | -1.7 b) |
| Gallbladder c) | 6.5 | 6.4 | 6.7 | 6.7 | 6.7 | 6.9 | 7.1 | 6.6 | 6.5 | 6.4 | 0.1 |
| Pancreas | 5.6 | 5.5 | 5.5 | 5.8 | 5.8 | 6.0 | 6.3 | 6.1 | 6.3 | 6.3 | 1.7 |
| Larynx | 2.3 | 2.2 | 2.4 | 2.2 | 2.1 | 1.9 | 2.0 | 1.8 | 1.8 | 1.6 | -3.9 b) |
| Lung | 28.5 | 27.7 | 28.3 | 28.5 | 27.8 | 28.7 | 28.9 | 28.6 | 28.2 | 27.7 | 0.0 |
| Breast | 10.7 | 10.8 | 12.7 | 13.9 | 14.2 | 14.9 | 16.1 | 16.8 | 17.9 | 18.7 | 6.5 b) |
| Cervix uteri | 8.5 | 7.9 | 8.3 | 7.7 | 7.4 | 6.8 | 6.5 | 6.3 | 5.7 | 5.8 | -4.6 b) |
| Corpus uteri | 1.4 | 1.3 | 1.5 | 1.7 | 1.9 | 1.9 | 2.0 | 2.1 | 2.1 | 2.4 | 6.0 b) |
| Ovary | 2.7 | 2.5 | 2.5 | 2.6 | 2.7 | 2.7 | 2.8 | 2.8 | 3.0 | 2.8 | 1.6 b) |
| Prostate | 3.1 | 2.7 | 3.6 | 3.9 | 4.8 | 5.9 | 6.3 | 7.2 | 8.5 | 9.6 | 15.2 b) |
| Testis | 0.3 | 0.3 | 0.3 | 0.3 | 0.3 | 0.3 | 0.3 | 0.4 | 0.4 | 0.4 | 3.5 b) |
| Kidney | 3.0 | 2.9 | 3.3 | 3.4 | 3.5 | 3.7 | 4.1 | 4.4 | 4.7 | 5.0 | 6.4 b) |
| Bladder | 4.6 | 4.6 | 4.9 | 4.7 | 5.1 | 5.1 | 5.1 | 4.9 | 4.9 | 4.7 | 0.5 |
| Brain and CNS | 2.9 | 2.8 | 2.8 | 2.6 | 2.9 | 2.9 | 3.1 | 2.9 | 3.1 | 2.9 | 1.0 b) |
| Thyroid | 6.3 | 6.1 | 7.9 | 9.5 | 12.7 | 17.2 | 20.6 | 25.3 | 32.6 | 40.8 | 25.1 b) |
| Hodgkin lymphoma | 0.2 | 0.3 | 0.3 | 0.3 | 0.3 | 0.4 | 0.3 | 0.3 | 0.4 | 0.4 | 4.5 b) |
| Non-Hodgkin lymphoma | 4.5 | 4.2 | 4.5 | 4.6 | 4.9 | 5.2 | 5.3 | 5.5 | 5.5 | 5.5 | 3.3 b) |
| Multiple myeloma | 1.0 | 1.0 | 1.1 | 1.1 | 1.1 | 1.2 | 1.3 | 1.3 | 1.4 | 1.4 | 4.0 b) |
| Leukemia | 4.7 | 4.3 | 4.7 | 4.8 | 4.7 | 4.8 | 4.7 | 4.9 | 4.8 | 5.0 | 0.9 b) |
| Other and ill-defined | 14.3 | 13.5 | 13.9 | 13.5 | 15.1 | 15.1 | 16.0 | 15.9 | 16.8 | 16.5 | - |
![]()
Table 7
Trends in cancer incidence rates in females during 1999-2008 in Korea
| Sites | Year | APC a) | |||||||||
|---|---|---|---|---|---|---|---|---|---|---|---|
|
|
|||||||||||
| 1999 | 2000 | 2001 | 2002 | 2003 | 2004 | 2005 | 2006 | 2007 | 2008 | ||
| All sites | 161.1 | 157.4 | 169.0 | 174.6 | 183.8 | 192.8 | 206.7 | 215.0 | 229.7 | 245.3 | 5.1 b) |
| Lip, oral cavity, and pharynx | 1.6 | 2.4 | 1.7 | 1.7 | 1.7 | 1.8 | 1.9 | 1.8 | 1.9 | 1.9 | 0.5 |
| Esophagus | 0.6 | 0.6 | 0.6 | 0.5 | 0.6 | 0.5 | 0.4 | 0.5 | 0.5 | 0.5 | -2.2 b) |
| Stomach | 26.7 | 25.2 | 26.2 | 26.3 | 25.9 | 24.7 | 26.8 | 25.0 | 24.7 | 24.9 | -0.6 |
| Colon and rectum | 16.4 | 16.4 | 17.9 | 18.8 | 20.4 | 21.4 | 22.8 | 23.9 | 24.2 | 24.7 | 5.3 b) |
| Liver | 12.3 | 11.8 | 12.2 | 11.8 | 11.5 | 11.3 | 11.3 | 11.1 | 11.0 | 10.5 | -1.5 b) |
| Gallbladder c) | 5.3 | 5.5 | 5.7 | 5.8 | 5.8 | 5.9 | 6.0 | 5.5 | 5.6 | 5.5 | 0.2 |
| Pancreas | 4.0 | 4.0 | 4.0 | 4.2 | 4.4 | 4.4 | 4.7 | 4.7 | 4.7 | 4.8 | 2.5 b) |
| Larynx | 0.4 | 0.3 | 0.3 | 0.3 | 0.3 | 0.3 | 0.3 | 0.2 | 0.2 | 0.2 | -9.0 b) |
| Lung | 12.4 | 12.5 | 12.3 | 12.6 | 12.4 | 13.0 | 13.5 | 13.9 | 13.8 | 13.9 | 1.5 b) |
| Breast | 20.9 | 20.9 | 24.7 | 27.2 | 27.8 | 29.1 | 31.7 | 33.1 | 35.4 | 36.8 | 6.7 b) |
| Cervix uteri | 16.3 | 15.1 | 15.8 | 14.8 | 14.2 | 13.1 | 12.4 | 12.2 | 11.0 | 11.2 | -4.5 b) |
| Corpus uteri | 2.8 | 2.6 | 3.0 | 3.3 | 3.8 | 3.7 | 3.9 | 4.0 | 4.2 | 4.6 | 6.2 b) |
| Ovary | 5.0 | 4.8 | 4.8 | 5.0 | 5.1 | 5.2 | 5.4 | 5.4 | 5.8 | 5.5 | 1.8 b) |
| Kidney | 1.7 | 1.8 | 1.9 | 2.0 | 2.1 | 2.2 | 2.5 | 2.7 | 2.8 | 3.0 | 6.5 b) |
| Bladder | 1.6 | 1.6 | 1.7 | 1.7 | 1.8 | 1.7 | 1.7 | 1.6 | 1.7 | 1.6 | -0.1 |
| Brain and CNS | 2.6 | 2.5 | 2.5 | 2.4 | 2.5 | 2.7 | 2.8 | 2.7 | 2.8 | 2.6 | 1.0 |
| Thyroid | 10.4 | 10.1 | 13.2 | 16.2 | 21.7 | 29.5 | 35.2 | 43.0 | 55.2 | 68.6 | 25.4 b) |
| Hodgkin lymphoma | 0.1 | 0.2 | 0.2 | 0.2 | 0.2 | 0.2 | 0.2 | 0.3 | 0.3 | 0.3 | 7.1 b) |
| Non-Hodgkin lymphoma | 3.4 | 3.2 | 3.4 | 3.5 | 3.9 | 4.1 | 4.4 | 4.3 | 4.3 | 4.6 | 4.2 b) |
| Multiple myeloma | 0.8 | 0.8 | 0.9 | 0.8 | 1.0 | 1.0 | 1.2 | 1.1 | 1.2 | 1.2 | 5.3 b) |
| Leukemia | 3.9 | 3.8 | 4.1 | 4.0 | 4.1 | 4.1 | 4.0 | 4.3 | 4.1 | 4.3 | 1.1 b) |
| Other and ill-defined | 11.8 | 11.5 | 11.8 | 11.5 | 12.6 | 12.9 | 13.7 | 13.9 | 14.4 | 14.3 | - |
![]()
As shown in Fig. 2, the incidence rates have continued to increase for colon and rectum and thyroid cancer in both sexes, along with breast cancer in females and prostate cancer in males. On the contrary, the incidences of liver cancer in both sexes and cervix cancer in women have decreased. Stomach cancer incidence rates remained the same in men and women. One notable aspect was the sharp increase (25.4% annually) in the incidence of female thyroid cancer. As diagnostic techniques for thyroid cancer have become more sensitive, such as with the advent of ultrasound and fine-needle aspiration, the detection of subclinical disease has become possible. Therefore, the increased incidence of thyroid cancer may reflect improved diagnostic techniques for previously undetected disease, rather than a true increase in the occurrence of thyroid cancer [12,13]. Furthermore, from the construction of a KNCI DB for 1999 onward to 2008, the completeness of the Korea cancer registry data has improved gradually. This might have contributed in part to the gradual overall increase in cancer incidence, especially among the elderly.
4. Age-specific incidence rates for selected cancer sites
Table 8 presents the most common cancer sites by sex and age group in 2008. Leukemia and thyroid were the most common forms in both sexes, for ages 0-14 and 15-34 years, respectively. For males, stomach cancer was the most common in 35-64-year-olds, while lung cancer was more frequent for patients aged 65 and over. Thyroid cancer was the most common site for mid-aged Korean women (35-64-year-olds), and colorectal cancer was the most common among old aged women (≥65 year-olds).
Table 8
Five major sites of cancer incidence by age group and sex during 2008 in Korea
| Rank | Age (yr) | |||
|---|---|---|---|---|
|
|
||||
| 0-14 | 15-34 | 35-64 | ≥65 | |
| Males | ||||
| 1 | Leukemia (4.5) | Thyroid (8.2) | Stomach (92.1) | Lung (447.5) |
| 2 | Brain and CNS (2.3) | Leukemia (3.3) | Liver (69.5) | Stomach (443.6) |
| 3 | Non-Hodgkin lymphoma (1.4) | Stomach (2.9) | Colon and rectum (64.5) | Colon and rectum (323.3) |
| 4 | Kidney a) (0.5) | Colon and rectum (2.7) | Lung (41.4) | Prostate (245.3) |
| 5 | Testis a) (0.5) | Non-Hodgkin lymphoma (2.4) | Thyroid (30.0) | Liver (211.6) |
| Females | ||||
| 1 | Leukemia (3.7) | Thyroid (44.5) | Thyroid (166.0) | Colon and rectum (161.9) |
| 2 | Brain and CNS (1.9) | Breast (9.2) | Breast (98.8) | Stomach (154.0) |
| 3 | Non-Hodgkin lymphoma (0.9) | Cervix uteri (5.3) | Stomach (40.9) | Lung (117.7) |
| 4 | Thyroid (0.7) | Stomach (4.4) | Colon and rectum (39.0) | Liver (74.5) |
| 5 | Ovary (0.7) | Ovary (2.7) | Cervix uteri (24.2) | Thyroid (69.3) |
![]()
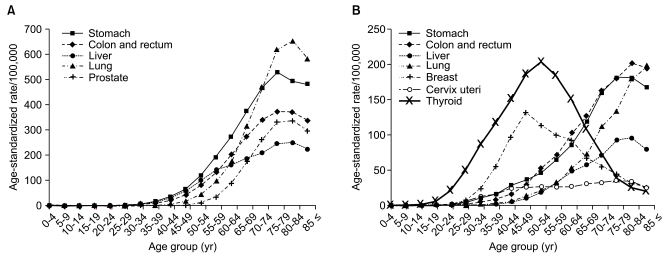
Fig. 3 shows the age-specific incidence rates of the selected cancers for men and women in 2008. The data show that the incidence of stomach, lung, liver and colorectal cancers increased gradually with age. Female breast and thyroid cancers showed highest incidence rates for women in their late forties and early fifties, respectively, and then leveled off. This pattern is very different from the rates observed in Western countries [14].
5. Trends in cancer mortality
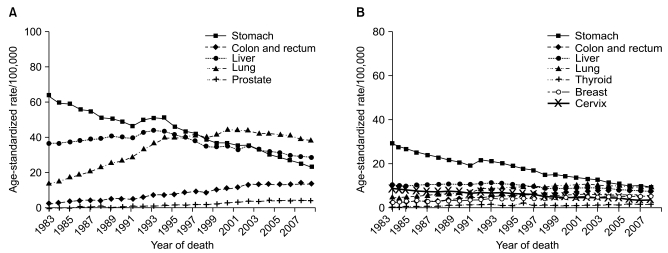
Figs. 1 and 4 show the trends in cancer deaths for all sites combined and for selected cancer sites. Age-standardized mortality rates have decreased for all sites combined in both sexes since 2002. Lung cancer surpassed stomach cancer as the leading cause of cancer death in 1999, and is expected to account for 21.5% of all cancer deaths in 2008. The age-standardized mortality rates of lung have decreased slightly for men since 2001, but increased in women. The age-standardized mortality rates of stomach and cervix uteri cancer have decreased continuously. Along with the significant increases in colorectal, prostate and female breast cancer incidence, the mortality rates of these cancers have also continued to increase.
6. Survival rates
Table 9 shows the 5-year relative survivals for four periods of diagnosis time: 1993-1995, 1996-2000, 2001-2005 and 2004-2008. Cancer patients that were diagnosed in the recent period (2004-2008) had 5-year relative survival rates of 59.5% for all sites combined in both sexes, 50.8% in males and 69.2% in females. When compared with earlier periods, notable improvements have been observed in the 5-year relative survival rates for all sites combined. Observation of higher female cancer survival rates than male cancer survival rates may be partly explained by common female cancers (e.g., thyroid, breast, and uterine cervix) that are known to have relatively good prognoses.
Table 9
Trends in the 5-yr relative survival rates (%) by year of diagnosis during 1993-2008 in Korea
| Sites | Total | Male | Female | ||||||||||||
|---|---|---|---|---|---|---|---|---|---|---|---|---|---|---|---|
| 1993-1995 | 1996-2000 | 2001-2005 | 2004-2008 | Change a) | 1993-1995 | 1996-2000 | 2001-2005 | 2004-2008 | Change a) | 1993-1995 | 1996-2000 | 2001-2005 | 2004-2008 | Change a) | |
| All sites | 41.2 | 44.0 | 53.4 | 59.5 | 18.3 | 31.7 | 35.3 | 44.9 | 50.8 | 19.1 | 53.4 | 55.3 | 63.5 | 69.2 | 15.8 |
| Lip, oral cavity, and pharynx | 41.1 | 46.7 | 53.7 | 57.5 | 16.4 | 35.8 | 41.1 | 48.9 | 53.1 | 17.3 | 58.1 | 63.8 | 67.3 | 69.3 | 11.2 |
| Esophagus | 12.7 | 15.2 | 20.7 | 24.7 | 12.0 | 11.8 | 14.3 | 20.0 | 24.0 | 12.2 | 23.7 | 24.2 | 28.4 | 32.2 | 8.5 |
| Stomach | 42.8 | 46.6 | 57.4 | 63.1 | 20.3 | 43.0 | 46.9 | 58.1 | 63.8 | 20.8 | 42.6 | 46.0 | 55.9 | 61.6 | 19.0 |
| Colon and rectum | 54.8 | 58.0 | 66.3 | 70.1 | 15.3 | 55.3 | 59.0 | 68.3 | 72.0 | 16.7 | 54.2 | 56.8 | 63.8 | 67.5 | 13.3 |
| Liver | 10.7 | 13.2 | 19.7 | 23.3 | 12.6 | 9.9 | 12.9 | 19.7 | 23.4 | 13.5 | 13.6 | 14.2 | 19.7 | 22.9 | 9.3 |
| Gallbladder b) | 17.3 | 19.7 | 22.3 | 24.9 | 7.6 | 16.6 | 20.3 | 22.9 | 25.9 | 9.3 | 18.0 | 19.1 | 21.7 | 23.9 | 5.9 |
| Pancreas | 9.4 | 7.6 | 7.5 | 7.6 | -1.8 | 8.8 | 7.3 | 7.5 | 7.3 | -1.5 | 10.1 | 8.1 | 7.5 | 7.9 | -2.2 |
| Larynx | 59.7 | 62.3 | 65.9 | 69.2 | 9.5 | 60.2 | 62.8 | 66.5 | 69.9 | 9.7 | 55.4 | 57.8 | 57.5 | 59.1 | 3.7 |
| Lung | 11.3 | 12.7 | 15.8 | 17.5 | 6.2 | 10.4 | 11.6 | 14.6 | 15.9 | 5.5 | 14.2 | 16.2 | 19.1 | 21.5 | 7.3 |
| Breast | 77.9 | 83.2 | 88.2 | 89.9 | 12.0 | 75.1 | 85.6 | 86.0 | 81.5 | 6.4 | 78.0 | 83.2 | 88.2 | 90.0 | 12.0 |
| Cervix uteri | 77.5 | 80.0 | 81.0 | 80.5 | 3.0 | - | - | - | 77.5 | 80.0 | 81.0 | 80.5 | 3.0 | ||
| Corpus uteri | 81.5 | 81.8 | 84.5 | 84.6 | 3.1 | - | - | - | - | 81.5 | 81.8 | 84.5 | 84.6 | 3.1 | |
| Ovary | 58.7 | 58.9 | 61.0 | 59.9 | 1.2 | - | - | - | - | 58.7 | 58.9 | 61.0 | 59.9 | 1.2 | |
| Prostate | 55.9 | 67.2 | 79.5 | 86.2 | 30.3 | 55.9 | 67.2 | 79.5 | 86.2 | 30.3 | - | - | - | - | - |
| Testis | 85.4 | 90.4 | 90.4 | 91.2 | 5.8 | 85.4 | 90.4 | 90.4 | 91.2 | 5.8 | - | - | - | - | - |
| Kidney | 62.0 | 66.1 | 73.2 | 76.4 | 14.4 | 60.8 | 64.4 | 72.6 | 76.4 | 15.6 | 64.5 | 69.7 | 74.3 | 76.4 | 11.9 |
| Bladder | 69.1 | 73.1 | 75.3 | 76.1 | 7.0 | 70.0 | 74.8 | 77.1 | 77.8 | 7.8 | 65.5 | 66.3 | 68.1 | 68.9 | 3.4 |
| Brain and CNS | 38.5 | 39.0 | 40.4 | 42.0 | 3.5 | 37.2 | 37.5 | 39.7 | 41.3 | 4.1 | 40.2 | 40.7 | 41.1 | 42.7 | 2.5 |
| Thyroid | 94.2 | 94.9 | 98.1 | 99.3 | 5.1 | 87.2 | 89.5 | 95.6 | 98.3 | 11.1 | 95.4 | 95.9 | 98.5 | 99.5 | 4.1 |
| Hodgkin lymphoma | 68.0 | 71.2 | 75.9 | 80.9 | 12.9 | 67.6 | 68.1 | 73.9 | 78.9 | 11.3 | 68.6 | 77.4 | 80.0 | 84.7 | 16.1 |
| Non-Hodgkin lymphoma | 46.6 | 50.8 | 59.6 | 62.8 | 16.2 | 45.3 | 48.9 | 57.7 | 61.0 | 15.7 | 48.7 | 53.5 | 62.1 | 65.0 | 16.3 |
| Multiple myeloma | 22.1 | 19.8 | 28.9 | 33.2 | 11.1 | 21.1 | 17.8 | 29.1 | 33.7 | 12.6 | 23.3 | 22.1 | 28.6 | 32.8 | 9.5 |
| Leukemia | 26.5 | 33.3 | 41.2 | 44.9 | 18.4 | 26.2 | 32.3 | 41.1 | 44.5 | 18.3 | 26.8 | 34.6 | 41.4 | 45.4 | 18.6 |
| Other and ill-defined | 42.1 | 45.9 | 55.0 | 60.4 | 18.3 | 37.4 | 42.4 | 51.4 | 56.3 | 18.9 | 47.4 | 50.0 | 59.1 | 64.9 | 17.5 |
![]()
When examined by the year of diagnosis and cancer site, the 5-year relative survival rates appeared to be higher for most major cancer sites in patients diagnosed during 2004-2008 compared to 1993-1995, except for pancreatic cancer. The greatest improvements were seen in prostate, stomach, leukemia, and non-Hodgkin lymphoma. The improving survival rates could be attributable to early detection, as well as to improved treatments [15,16], but this needs to be evaluated further. Lack of progress in early detection and treatment could explain the observed absence of improvement in the survival rate of pancreatic cancer [17].
7. Prevalence rates
Table 10 shows the 10-year cancer prevalent rates on January 1, 2009 in Korea by sex and cancer site. The 10-year cancer prevalence CRs of all sites combined were 1,350.4 and 1,583.7 per 100,000 in men and women, respectively, and the 10-year cancer prevalence ASRs of all sites combined were 1,145.0 and 1,136.2 per 100,000 in men and women, respectively. In males, the five leading primary sites of cancer for prevalence were the stomach (CR, 362.0; ASR, 302.0), colon and rectum (CR, 244.2; ASR, 206.1), liver (CR, 109.4; ASR, 90.2), prostate (CR, 96.7; ASR, 86.3), and lung (CR, 94.8; ASR, 81.1), accounting for 67.2% of all cancer prevalent cases. In females, the most common cancer sites were the thyroid (CR, 375.1; ASR, 277.7), breast (CR, 320.9; ASR, 232.2), stomach (CR, 183.0; ASR, 123.6), colon and rectum (CR, 172.8; ASR, 115.8), cervix uteri (CR, 134.3; ASR, 95.1), and lung (CR, 46.5; ASR, 31.2), accounting for 77.8% of all cancer prevalent cases.
Table 10
Crude and age-standardized cancer 10-yr prevalent rates on January 1, 2009 by sex during 2008 in Korea
| Sites | Crude mortality rates/100,000 | Age-standardized mortality rates/100,000 a) | ||||
|---|---|---|---|---|---|---|
|
|
|
|||||
| Both sexes | Male | Female | Both sexes | Male | Female | |
| All sites | 1,466.8 | 1,350.4 | 1,583.7 | 1,107.4 | 1,145.0 | 1,136.2 |
| Lip, oral cavity, and pharynx | 22.9 | 31.2 | 14.5 | 17.4 | 25.8 | 10.5 |
| Esophagus | 10.6 | 19.1 | 2.0 | 8.0 | 16.4 | 1.3 |
| Stomach | 272.7 | 362.0 | 183.0 | 203.2 | 302.0 | 123.6 |
| Colon and rectum | 208.5 | 244.2 | 172.8 | 155.1 | 206.1 | 115.8 |
| Liver | 72.9 | 109.4 | 36.3 | 56.0 | 90.2 | 25.9 |
| Gallbladder b) | 20.1 | 20.5 | 19.7 | 14.8 | 17.5 | 12.9 |
| Pancreas | 9.7 | 10.8 | 8.6 | 7.2 | 9.0 | 5.8 |
| Larynx | 12.9 | 24.1 | 1.7 | 9.7 | 20.8 | 1.0 |
| Lung | 70.7 | 94.8 | 46.5 | 52.8 | 81.1 | 31.2 |
| Breast | 160.9 | 1.5 | 320.9 | 118.5 | 1.3 | 232.2 |
| Cervix uteri | 67.0 | - | 134.3 | 49.1 | - | 95.1 |
| Corpus uteri | 18.4 | - | 36.9 | 13.9 | - | 27.2 |
| Ovary | 19.7 | - | 39.5 | 15.4 | - | 30.4 |
| Prostate | 48.5 | 96.7 | - | 34.6 | 86.3 | - |
| Testis | 2.8 | 5.7 | - | 2.6 | 5.2 | - |
| Kidney | 30.9 | 41.5 | 20.2 | 23.9 | 34.2 | 15.0 |
| Bladder | 37.0 | 60.0 | 13.9 | 26.9 | 51.8 | 8.6 |
| Brain and CNS | 12.7 | 13.3 | 12.1 | 11.6 | 12.4 | 10.8 |
| Thyroid | 218.0 | 61.6 | 375.1 | 163.1 | 47.1 | 277.7 |
| Hodgkin lymphoma | 2.5 | 3.2 | 1.9 | 2.2 | 2.8 | 1.7 |
| Non-Hodgkin lymphoma | 32.7 | 35.8 | 29.5 | 26.1 | 30.5 | 22.3 |
| Multiple myeloma | 5.0 | 5.2 | 4.7 | 3.8 | 4.4 | 3.3 |
| Leukemia | 20.1 | 22.0 | 18.2 | 20.0 | 22.0 | 18.1 |
| Other and ill-defined | 89.7 | 87.9 | 91.5 | 71.1 | 78.0 | 65.7 |
![]()
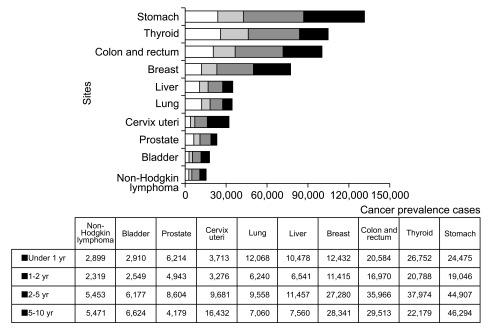
Fig. 5 shows the prevalence by time since diagnosis. For all cancers combined, the 1- to 2-year prevalence represented 37% of the total prevalent cases. The 1- to 2-year prevalence as a percentage of the total was highest for thyroid cancer (18%) following stomach (16%), and colorectal cancer (14%), which has high incidence rates and a good prognosis. For all cancers combined, the 2- to 5-year prevalence and the 5- to 10-year prevalence constituted 33% and 30% of the total prevalence in both sexes, respectively. The long-term prevalence of lung and liver cancer was relatively low due to lower rates of survival.
Go to :
 XML Download