

 PDF
PDF Citation
 Print
Print


Introduction
Locally advanced sarcomas are tumors that invade nerves, vessels, and joints, or extra-compartmental extensions of tumors that infiltrate other surrounding structures. Although a variety of therapeutic modalities for treatment of locally advanced soft tissue sarcomas (STS) are available, including radiotherapy, chemotherapy, combined chemotherapy and radiotherapy (with and without regional hyperthermia), and isolated limb perfusion [1], the efficacy of clinically available chemotherapeutic agents in STS is limited [2].
Tumor necrosis factor (TNF)-related apoptosis-inducing ligand (TRAIL), a type II transmembrane protein that exhibits sequence homology to TNF-α and FasL, induces apoptosis in a variety of transformed or cancer cells but not in normal cells [3]. TRAIL modulates the apoptotic response by binding to receptors, including the death receptor 4 (DR4, TRAIL-R1) [4], KILLER/DR5 (TRAIL-R2) [5], TRID (DcR1, TRAIL-R3) [6], TRUNDD (DcR2, TRAIL-R4) [7], and osteoprotegerin (OPG) [8]. Both DR4 and DR5 have a C-terminal death domain that signals through downstream caspase activation. In contrast, TRAIL-R3 and TRAIL-R4 lack a functional cytoplasmic death domain. These two receptors serve as decoys, protecting cells from TRAIL-induced apoptosis by competing with death-inducing TRAIL receptors for TRAIL binding [9]. OPG binds TRAIL, but has lower affinity at physiological temperature [10]. Despite considerable interest in the potential of TRAIL in novel anticancer therapies, many tumor cell lines are partially or completely resistant to this agent when used alone [11,12]. Hence, a great deal of research has focused on improving the potency of TRAIL-based therapeutic approaches, some by establishing new modalities for combined treatment with TRAIL and other agents.
The proteasome is a multi-catalytic proteinase complex responsible for ubiquitin-mediated protein degradation and maintenance of homeostasis in eukaryotic cells. This complex is primarily involved in the degradation of misfolded and short-lived regulatory proteins essential for cell cycle progression, apoptosis, and signal transduction. Malignant cells, which frequently contain mutations in cell cycle and apoptotic checkpoint proteins responsible for tumorigenesis, are more susceptible to certain proteasome inhibitors [13]. Recent reports have demonstrated that a variety of tumor cell types can be sensitized to TRAIL-induced apoptosis by combining TRAIL with proteasome inhibitors such as bortezomib [14,15].
In the present study, we investigated susceptibility to TRAIL in STS cell lines of various origins, and examined the efficacy of combination therapy with TRAIL and the proteasome inhibitor MG132.
Go to : 
Materials and Methods
1. STS cell lines
Human HTB-82 (rhabdomyosarcoma), HTB-93 (synovial sarcoma), and HTB-94 (chondrosarcoma) cell lines were obtained from the American Type Culture Collection (ATCC, Rockville, MD). The human HT-1080 (fibrosarcoma) cell line was obtained from the Korean Cell Line Bank (Seoul, Korea). HTB-93 and HTB-94 cell lines were cultured in Leibovitz's L-15 medium; the HTB-82 cell line was cultured in modified McCoy's 5a Medium; the HT-1080 cell line was cultured in RPMI 1640 medium with 10% heat-inactivated fetal calf serum (WelGENE Inc., Seoul, Korea), 50 U/mL penicillin and 50 µg/mL streptomycin.
2. Measurement of cell viability
Cell viability was assessed by dimethylthiazolyl-2,5-diphenyltetrazolium bromide (MTT) assay using a cell proliferation kit (Roche, Roche Diagnostics GmbH, Mannheim, Germany). In this assay, the membrane permeable tetrazolium dye is reduced by mitochondrial reductase in living cells to an insoluble form that is dissolved in detergent and measured spectrophotometrically to identify and quantify viable cells. Equal numbers of cells (5×10⁴) of each of the four different STS cell lines were cultured in wells of a 96-well plate at 37℃ for 24 hours. Cells were treated with 10 and 20 ng/mL of TRAIL (R&D Co., Minneapolis, MN); 1, 2, and 10 µM of MG132 (Calbiochem, Darmstadt, Germany); or a combination of TRAIL and MG132. After culturing with TRAIL and/or MG132 at 37℃ for 24 hours, 10 µL of MTT labeling reagent was added to each well. Four hours later, 100 µL of a solubilization solution was added to dissolve the formazan crystals. The absorbance was measured using an enzyme-linked immunosorbent assay plate reader at a wavelength of 562 nm.
3. Western blot analysis
For western blot analyses, cells were lysed in ice-cold phosphate-buffered saline (PBS) containing 1% Nonidet P 40, 0.5% sodium deoxycholate, 0.1% sodium dodecyl sulfate (SDS), 2.0 µg/mL aprotinin and protease inhibitor cocktail II (Sigma-Aldrich, St. Louis, MO). The lysed cells were centrifuged at 12,000 rpm to remove cellular debris. The protein concentration in the extracts was determined by colorimetric bicinchoninic acid analysis (Micro BCA protein assay reagent kit, Pierce, Rockford, IL). Proteins (40 µg total) were separated by SDS-polyacrylamide gel electrophoresis on a 10% gel, and than electrophoretically transferred to a polyvinylidene difluoride membrane (Bio-Rad Laboratories, Hercules, CA). The membrane was blocked in TTBS (50 mM Tris-HCl pH 7.5, 150 mM NaCl, 0.1% v/v Tween 20) containing 5% nonfat dry milk (TTBS/5% milk) for 1 hour at room temperature, and then incubated for 4 hours at room temperature with primary antibodies diluted 1 : 1,000 in TTBS/5% milk. DR4, DR5 (ProSci Inc., Poway, CA), BID and BAX (Santa Cruz Inc., Santa Cruz, CA) were detected using rabbit polyclonal antibodies; caspase-3, caspase-8 (Assay Designs, Inc., Victoria, BC, Canada) and Fas associated death domain (FADD, BD Pharmingen, Franklin Lakes, NJ) were detected using mouse monoclonal antibodies. After washing the membrane three times with TTBS for 15 minutes, the membrane was incubated for 1 hour at room temperature with horseradish peroxidase-conjugated secondary immunoglobulins (Dako, Glostrup, Denmark) diluted 1 : 3,000 with TTBS/5% milk. The membrane was then washed three times as described above, and developed using an enhanced chemiluminescence detection system (Amersham Corp., Buckinghamshire, UK).
4. Measurement of surface expression of TRAIL receptors
After 24 hours treatment with MG132, cells were harvested with 0.05% trypsin-EDTA and washed twice with isotonic PBS. Cells (2×10⁶) were incubated with phycoerythrin (PE) anti-human DR4 (TRAIL-R1, CD261) and PE anti-human DR5 (TRAIL-R2, CD262) antibodies (20 µL; BioLegend, San Diego, CA) for 45 minutes at 4℃. After washing, 1×10⁵ cells were analyzed using a FACSVantage SE Flow Cytometer (BD Pharmingen, Franklin Lakes, NJ). Data analysis was conducted using Cell Quest software (BD Pharmigen).
5. Statistical analysis
Data are expressed as means±standard error of the means calculated from three separate experiments, each performed in triplicate. Statistical significance of differences between two groups was determined using the paired two-tailed Student's t-test.
Go to :
Results
1. Cytotoxic effects of TRAIL and MG132 in STS cell lines
To assess possible cytotoxic effects of TRAIL on STS cells, we tested the viability of four STS cell lines, by MTT assay, after treatment with TRAIL. TRAIL sensitivity was defined as a reduction in cell viability to less than 75% that of controls after a 24 hours incubation with TRAIL. The four STS cell lines were variably sensitive to TRAIL. In the HTB-93 cell line, a 24 hours incubation with TRAIL (10 or 20 ng/mL) showed cell viability decreases as a function of increasing TRAIL concentration (p<0.05); in contrast, HTB-82, HT-1080, and HTB-94 cells were resistant to TRAIL (Fig. 1A). In all four cell lines, MG132 alone (1-10 µM) induced a dose-dependent reduction in cell viability after 24 hours of incubation. However, sensitivity varied among cell lines, with <2 µM of MG132 significantly decreasing cell viability (p<0.05) in HTB-93 and HTB-94 cell lines, but not in HTB-82 or HT-1080 cells (Fig. 1B).
 | Fig. 1Cell viability of soft tissue sarcomas (STS) cell lines treated with tumor necrosis factor-related apoptosis-inducing ligand (TRAIL), MG132 and a combination of both agents. (A, B) Cells were incubated for 24 hr in the presence of different concentrations of TRAIL and/or MG132. *p<0.05, compared to control or lower dose of each treatment. Cell viability was quantified by MTT assay; each treatment was performed in triplicate. (C) Adding MG132 to TRAIL augmented the apoptosis compared to exposure to a single agent, TRAIL or MG132, in TRAIL-sensitive cells (HTB-93) and TRAIL-resistant cells (HTB-82, HT-1080, and HTB-94). *p<0.05, compared to TRAIL 10 ng/mL, MG132 1 µM, and MG132 2 µM. (T10/M1: 10 ng/mL TRAIL+1 µM MG132; T10/M2: 10 ng/mL TRAIL+2 µM MG132).
|
2. Enhancement of TRAIL-induced apoptosis in STS cell lines by co-treatment with the proteasome inhibitor, MG132
To determine whether combining TRAIL with MG132 sensitized STS cells to TRAIL-induced apoptosis, we exposed TRAIL-sensitive and TRAIL-resistant STS cell lines to different concentrations of MG132 (1 or 2 µM) in the presence or absence of a fixed concentration of TRAIL (10 ng/mL) for 24 hours. The results showed a significant decrease in viability in all four lines of STS cells treated with a combination of TRAIL and MG132 compared with either agent alone (p<0.05) (Fig. 1C), demonstrating that MG132 restores TRAIL sensitivity to TRAIL-resistant STS cells.
3. Detection of apoptosis
We next investigated whether the decrease in STS cell viability observed using a combination of TRAIL and MG132 was attributable to apoptosis. Because stimuli that trigger apoptosis all appear to act through caspase activation, we evaluated the effects of 24-hour treatment with TRAIL and/or MG132 in STS cells pre-incubated for 1 hour with or without the broad-spectrum irreversible caspase inhibitor, z-VAD-fmk. MTT assays showed that cell death induced by the combination of TRAIL and MG132 was markedly reduced in all cell lines by z-VAD-fmk (20 µM). In contrast, a caspase-8 inhibitor, z-IETD-fmk, had less striking effects on cell death elicited by the combination of TRAIL and MG132 in the four STS cell lines (Fig. 2A and B). These results indicate that enhanced cell death is caspase-dependent and imply an apoptotic mechanism. This latter interpretation was confirmed by terminal transferase-mediated dUTP nick-end labeling staining using the in situ cell death detection kit (Chemicon, Temecula, CA) according to the manufacturer's protocol, which detects a characteristic stain in apoptotic cells (data not shown).
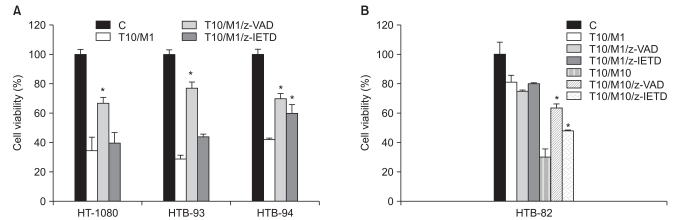 | Fig. 2Evaluation of apoptosis. The broad-spectrum caspase inhibitor z-VAD-fmk or the caspase-8 inhibitor z-IETD-fmk was applied for 1 hr before treatment of soft tissue sarcomas (STS) cells with tumor necrosis factor-related apoptosis-inducing ligand (TRAIL) and MG132 for 24 hr. (A, B) The decrease in cell viability induced by combined treatment with MG132 and TRAIL and measured by MTT assay was caspase dependent. Similar results were obtained in three separate experiments. *p<0.05 compared to the combination of TRAIL and MG132.
|
4. Expression of apoptotic proteins and sensitivity to TRAIL
Because TRAIL mostly induces apoptosis directly via the FADD caspase-8 dependent signaling pathway [9], the variable sensitivity of STS cell lines to TRAIL could reflect variable expression of death receptors and signal pathway molecules. To assess this possibility, we measured protein levels of receptors and signaling pathway components by western blotting. Of the five TRAIL receptors, two (DR4 and DR5) are involved in caspase activation; the remaining TRAIL receptors, TRAIL-R3, TRAIL-R4, and OPG, are not. We found that DR4 was expressed in TRAIL-sensitive HTB-93 cells but not in TRAIL-resistant HT-1080 and HTB-94 cells, consistent with the idea that TRAIL sensitivity is correlated with expression of TRAIL receptors involved in caspase activation. However, this observation was not confirmed in HTB-82 cells, which, despite being TRAIL-resistant, expressed both DR4 and DR5 receptors, suggesting that the mechanism of resistance was different in these cells. In addition, DR5 was expressed in both TRAIL-sensitive (HTB-93) and TRAIL-resistant (HTB-82, HT-1080, and HTB-94) cells, indicating that DR5 expression is not correlated with TRAIL sensitivity in STS cell lines (Fig. 3A). Thus, differences in TRAIL sensitivity among the different STS cell lines could not be distinguished on the basis of expression of the TRAIL receptors DR4 and DR5. In addition, FADD/caspase-8 signal pathway molecules were expressed in the four different STS cells; thus, TRAIL resistance was not attributable to the absence of death receptor signaling molecules (Fig. 3A).
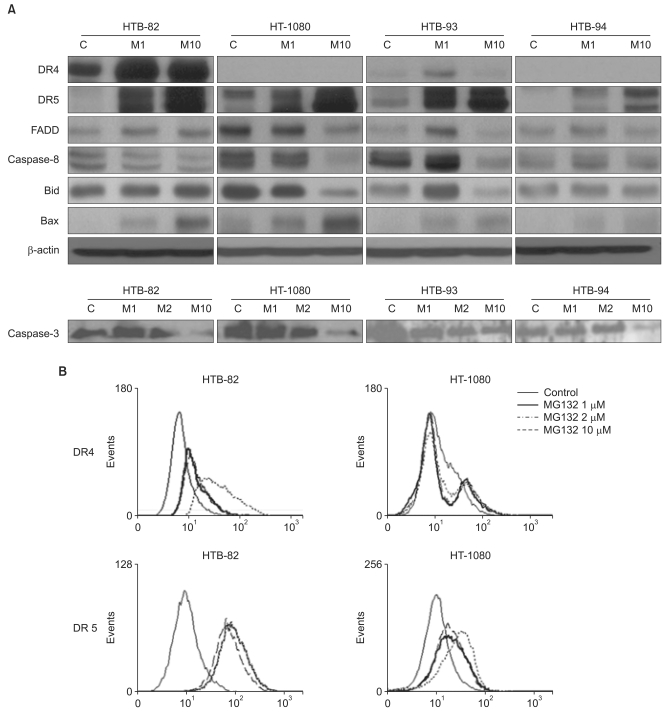 | Fig. 3Expression of tumor necrosis factor-related apoptosis-inducing ligand (TRAIL) receptors and apoptotic molecules in soft tissue sarcomas (STS) cells. (A) After incubating each of the four STS cell lines for 24 hr with different concentrations of MG132, expression levels of TRAIL receptors and apoptotic molecules were determined by western blot analysis. (B) Analysis of the surface expression of death receptor (DR)4 and DR5 was determined by flow cytometry in HT-1080 and HTB-82 cells. C, control; M1, 1 µM MG132; M2, 2 µM MG132; M10, 10 µM MG132.
|
5. Changes in the expression of TRAIL receptors and downstream apoptosis pathway components induced by MG132
To identify the mechanism by which combined treatment with MG132 and TRAIL restores sensitivity to TRAIL-induced apoptosis, we investigated changes in TRAIL receptors and receptor signaling molecules after treatment with MG132. Western blot analyses showed that treatment with different concentrations of MG132 for 24 hours variably affected TRAIL receptor expression in the four cell lines. DR4 expression was increased in HTB 82 (TRAIL-resistant) and HTB-93 (TRAIL-sensitive) cells; however, DR5 expression was elevated in all four STS cells (Fig. 3A).
Using flow cytometry, we confirmed that these MG132-induced changes in whole-cell TRAIL receptor expression are reflected in an increase in the levels of DR4 and DR5 at the cell surface. These results suggest that the reactivation of TRAIL sensitivity in TRAIL-resistant cells by MG132 is related to an increase in the cell surface expression of TRAIL receptors (Fig. 3B).
The binding of TRAIL to death receptors causes trimerization of the death receptor, which recruits a specific adapter molecule, FADD, leading to activation of the receptor-mediated pathway. Because MG132 upregulated TRAIL receptor levels, we next tested whether expression of downstream molecules, FADD, caspase-8, and caspase-3, are affected by MG132. We found that MG132 induced an increase in FADD in HTB-82, HTB-93, and HTB-94 cells, but not in HT-1080 cells. As the concentration of MG132 was increased to 10 µM, the expression of pro-caspase-8 and pro-caspase-3 fell (Fig. 3A).
Mitochondria-dependent apoptosis through activation of proapoptotic BCL-2 family members such as BID and BAX is another important apoptotic pathway. Cleavage of the pro-apoptotic BCL-2 family protein BID by caspase-8 is required for apoptosis in some cells [9,10,16,17]. Activated truncated BID causes mitochondrial damage, and therefore acts as an amplifying signal that links the extrinsic to the intrinsic apoptotic death pathways. MG132 had shown various effects in the expression of BID in STS cell lines, but it had little effect on the expression of BID in HTB-82 and HTB-94 cell lines. MG132 caused a dose-dependent decrease in the expression of BID in HT-1080 cells. It induced a rise in BID expression at 1 µM and a fall at 10 µM in HTB-93 cells. As the concentration of MG132 was increased in all four STS cell lines (Fig. 3A) BAX expression was increased.
Go to :
Discussion
Promising results from the introduction of high-dose TNF for treatment of STS [18] has led to a large phase II multicenter study that demonstrated the efficacy of this approach. However, because of severe systemic toxicity, TNF-α administration could be performed only via isolated limb perfusion. Similarly, the therapeutic usefulness of FasL was hampered by Fas expression on hepatocytes, resulting in lethal hepatic apoptosis upon intravenous FasL administration [19]. In contrast to TNF and FasL, TRAIL selectively promotes apoptosis in cancer cells that express death receptors, and has little or no effect on normal cells [3]. In addition, it has been shown that TRAIL-induced apoptosis in a variety of tumor cells is augmented by combining TRAIL with proteasome inhibitors. The mechanisms by which proteasome inhibitors sensitize cells to TRAIL-induced apoptosis appear to differ among cell types, but involve an increase in caspase-8 activation, with or without a decrease in the level of c-FLIP; an increase in the levels of BH3-only pro-apoptotic BCL-2 proteins, such as BIK and BIM; and inhibition of nuclear factor-κB activation [20]. In the present report, we show that TRAIL sensitivity varies among different STS cell lines, and demonstrate that a combination of TRAIL and the proteasome inhibitor MG132 can overcame TRAIL resistance, augmenting the apoptotic activity of TRAIL.
Although TRAIL receptor expression was different in the various STS cell lines studied, it is difficult to define TRAIL sensitivity according to TRAIL-receptor expression. Recent studies have demonstrated that activation of either of the two caspase-coupled TRAIL receptors, DR4 or DR5, is sufficient to fully trigger the apoptotic machinery of the cell [21]. An increase in DR5 expression in response to a proteasome inhibitor and chemotherapy has been reported, suggesting that DR5 could also be a crucial contributor to the sensitization of cells to TRAIL [15]. The notion that an increased ability to induce apoptosis of cancer cells is of key importance in sensitization is highlighted by the results described here using TRAIL/MG132 combination therapy. The data showed that combined treatment enhanced induction of apoptosis in both TRAIL-resistant and -sensitive STS cells. As shown in Fig. 3, enhanced apoptosis was mediated through upregulation of TRAIL receptors at both the whole-cell and surface-expression levels, resulting in increased caspase-8 activation in some STS cells and BAX activation in other STS cells. This finding suggests that MG132 upregulated TRAIL receptors and activated the mitochondrial pathway through BAX activation. In addition, as its concentration increases, MG132 may promote an amplification loop, in which activation of the extrinsic apoptotic pathway enhances activation of the mitochondrial apoptotic pathway. Although our studies did not directly address the mechanism by which the proteasome inhibitor, MG132, increased the expression of DR4 and DR5, previous reports have shown that proteasome inhibitors increase DR5 transcriptional levels [15] via reactive oxygen species-mediated p53 activation, which enhances binding of p53 to the DR5 intron [22]. The broad-spectrum irreversible caspase inhibitor z-VAD-fmk attenuated apoptosis induced by combined treatment with TRAIL and MG132 in all four cells lines; however, the caspase-8 inhibitor, z-IETD-fmk, showed differential effects. Apoptosis induced by combined treatment with TRAIL and MG132 was largely unaffected by z-IETD-fmk in HTB-93 and HT-1080 cells, but was influenced to a greater extent in HTB-82 and HTB 94 cells. This difference might be attributable to differences in BID expression. In HTB-93 and HT-1080 cells, higher concentrations of MG132 induced a decrease in BID expression, whereas BID expression was unchanged in HTB 82 and HTB-94 cells.
In some STS cells, MG132 restored TRAIL sensitivity through up-regulation of TRAIL receptors, whereas in other cells TRAIL resistance was overcome through activation of the mitochondrial pathway by BAX. Thus, the combination of TRAIL and the proteasome inhibitor, MG132, could affect both extrinsic and intrinsic apoptotic pathways.
Go to :
Conclusion
In this study, we have investigated the effects of TRAIL and MG132 on STS cell lines in vitro. Such cells exhibited differential sensitivity to TRAIL, but there was no correlation between TRAIL sensitivity and TRAIL receptor expression levels. Combining MG132 with TRAIL enhanced apoptosis and overcame TRAIL resistance. This restoration of TRAIL sensitivity occurred through increases in expression of TRAIL receptors and in BAX, a pro-apoptotic BCL-2 family member.
Go to :
 XML Download