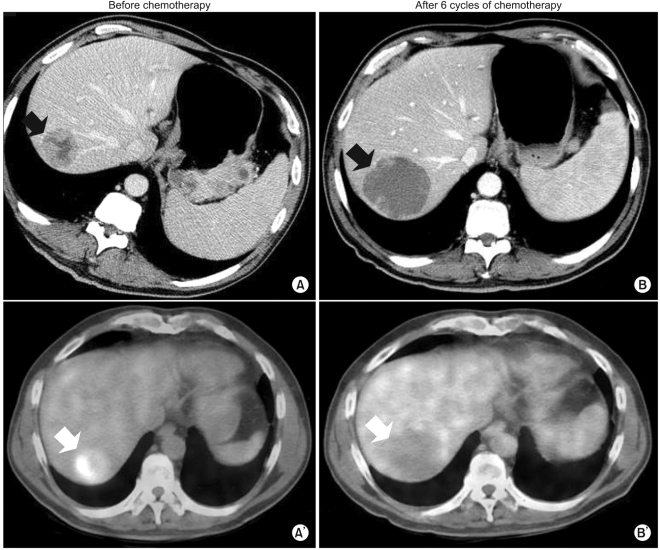
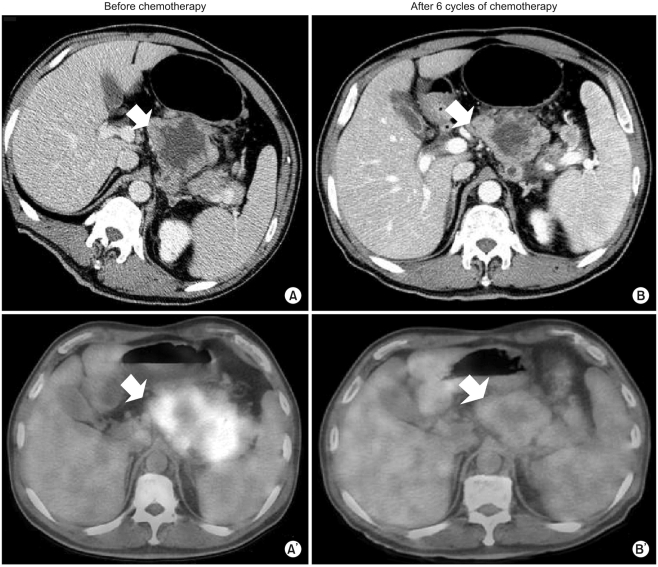
Our patient was a 54-year-old man diagnosed with gastric adenocarcinoma with multiple enlarged lymph nodes and liver metastases. His chief complaints were abdominal discomfort and easy fatigue. Baseline CT was performed before chemotherapy (
Fig. 1A,
2A). Tumor markers such as αFP, CEA, and CA19-9 were within normal limits. Baseline FDG-PET was also performed (
Fig. 1A',
2A'). The patient was treated with combination chemotherapeutic agents composed of oxaliplatin, 5-fluorouracil (5-FU), and leucovorin, called for in the modified FOLFOX-6 regimen (oxaliplatin 85 mg/m
2 on day 1, leucovorin 75 mg/m
2 on days 1 and 2, 5-FU IV bolus 400 mg/m
2 on days 1 and 2, 5-FU continuous infusion 1,500 mg/m
2 on days 1 and 2). This regimen was repeated every two weeks. After three cycles of chemotherapy (six weeks after the start of chemotherapy), CT scans were performed. The response was "stable disease" according to RECIST, though the sizes of the metastatic hepatic masses and lymph nodes had slightly increased (less than 20%). There were no new lesions. After six cycles of chemotherapy, the sizes of the metastatic liver masses had definitively increased more than 20% above the original tumor size according to CT scans (
Fig. 1B). However, the maximum paraaortic lymph node diameter had decreased from 8.8 cm to 7.0 cm (
Fig. 2). The hepatic masses had also developed a cystic and necrotic appearance, in contrast to the original masses, which contained mostly solid portions with little central necrosis (
Fig. 1). We were not sure that this increase in diameter on CT represented true tumor progression in light of the metabolic activity of the tumor, because the patient showed clinical improvement. Abdominal discomfort and easy fatigue disappeared after chemotherapy. In addition to preservation of good performance status, the albumin level, cholesterol, and body weight reflected the clinical benefits of chemotherapy. Tumor markers such as αFP, CEA, and CA 19-9 remained at normal levels. We required more information to determine if we should change the chemotherapy regimen. The metabolic activity was checked using FDG-PET. Interestingly, we did not identify hypermetabolism in the hepatic metastases on FDG-PET images compared to the initial images, which showed a maximum standardized uptake value (SUV) of 5.2 (
Fig. 1). The maximum SUV of the lymph nodes decreased from 7.6 to 2.4 (
Fig. 2). Collectively, the patient showed metabolic partial remission (PR) according to the maximum SUV on FDG-PET. We decided to continue the same chemotherapy regimen because we regarded the overall tumor response as good. The patient successfully underwent palliative chemotherapy until the twelfth chemotherapy cycle, with the same regimen. The patient is still alive 12 months after diagnosis.
 | Fig. 1(A, A') Baseline CT and FDG-PET before chemotherapy. (B, B') CT and FDG-PET after 6 cycles of chemotherapy. After 6 cycles of chemotherapy, the sizes of the metastatic liver masses definitively increased 20% above the original tumor sizes according to CT. This patient showed disease progression according to RECIST criteria. However, the hepatic masses also turned cystic and necrotic compared to the original masses. In addition to that finding on CT, there was no metabolic activity in the liver masses on FDG-PET after chemotherapy. 
|
 | Fig. 2(A, A') Baseline CT and FDG-PET before chemotherapy. (B, B') CT and FDG-PET after 6 cycles of chemotherapy. The maximum SUV of the lymph nodes decreased from 7.6 into 2.4. Taken together, the patient showed metabolic PR according to maximum SUV on FDG-PET. 
|


 PDF
PDF Citation
 Print
Print


 XML Download