

 PDF
PDF Citation
 Print
Print


INTRODUCTION
Pulmonary fibrosis is perhaps the most universal late effect of organ injury after a chemical insult or irradiation in the treatment of lung cancer. The use of chemotherapy and radiation therapy alone or in combination can be associated with clinically significant pulmonary toxicity, which can lead to pneumonitis and pulmonary fibrosis (1). It was reported that approximately 5 to 15% of patients who receive high-dose external-beam radiation therapy develop pulmonary fibrosis (2). The incidence is even higher in child patients (2). For this reason, pulmonary fibrosis has been the focus of many studies. Some research groups used bleomycin-induced pulmonary fibrosis to investigate the molecular mechanisms of fibrosis and monitored the total gene expression using genomics (3,4). Several possible mechanisms underlying radiation-induced pulmonary injuries have also been documented (5~9). Nevertheless, the mechanisms of pulmonary fibrosis are still unclear.
This study approached RIF with proteomic analysis to identify some marker proteins such as TGF-β, PDGF, and collagen that are known to directly cause RIF. Proteomic analysis of RIF was generated with the whole lung tissue protein extracted from C57BL/6 (RIF sensitive) mice 21 weeks after γ-irradiation (25 Gy, dose rate 0.5 Gy/min), and an analysis of the 2-DE gel images revealed that the levels of the α1-protease inhibitor and galectin-1 were significantly higher in the lung with RIF.
Go to : 
MATERIALS AND METHODS
1) Induction of early phase of pulmonary fibrosis
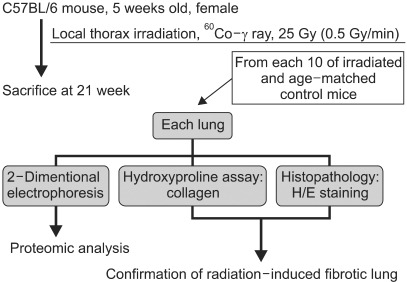
Five-week-old C57BL/6 (fibrosis-sensitive) female mice (Jung-Ang Inc., Korea) were allowed to acclimatize to the experimental environment for 1 week. The mice were anesthetized with a solution containing ketamine (1 mg/ml) and rompun (1 ml/ml). The thoracic region of the mice was placed in the field defined by collimators and locally irradiated with a dose of 25 Gy using a 60Co γ-ray source (0.5 Gy/min, Theratron 780, Atomic Energy of Canada, Ltd). The remainder of the body was additionally shielded with 5-cm lead blocks. The irradiated and control mice (10 mice/group) were sacrificed by a cervical dislocation at 21 weeks after irradiation. The right lung was used for protein analysis, while the left was kept frozen for histological and hydroxyproline assays.
2) Histological studies
Pieces of murine lung were fixed in buffered 10% formalin for 72 h, embedded in paraffin and stained with hematoxylineosin (H-E). The stained sections were evaluated by optical microscopy.
3) Hydroxyproline assay
The collagen concentration was determined by measuring the amount of hydroxyproline. The lyophilized tissue sample was homogenized thoroughly in distilled water using a polytron homogenizer (Biospec Products, Tissue-Tearer™). The test samples were mixed with sodium hydroxide (2N final concentration), and hydrolyzed at 121℃ for 20 min in an autoclave. The hydrolyzed samples were gently mixed with a buffered chloramine-T reagent, and oxidation was allowed to proceed for 25 min at room temperature. The color was then developed by adding Ehrlich's reagent, and the absorbance of the reddish purple complex was measured at 550 nm using a spectrophotometer (10).
4) Sample preparation for 2-DE
The protein samples were prepared according to the procedure previously described (11). The lung tissues were homogenized in a lysis buffer containing 5 mM NaPO4 (pH 7.4), 5 mM EDTA, 0.32 M sucrose, 1 mM 2-ME, and 0.04% protease inhibitor cocktail (Complete, Roche, Swiss) using polytron homogenizer. The cell debris was removed by centrifugation at 12,000 g for 45 min at 4℃, and the supernatant was treated with DNase (100 mg/ml) and RNase A (25 mg/ml) for 1 h on ice. The sample was then desalted four times using Centri-con with a 3K cut-off membrane (Amicon, Millipore, Bedford, MA), and the proteins were precipitated by adding a solution containing 10% TCA, 10% cold acetone and 20 mM DTT at 4℃. After washing and drying, the pellets were redissolved in a buffer containing 40 mM Tris-HCl (pH 8.0), 7 M urea, 2 M thiourea, 100 mM DTT, 2% CHAPS, and 0.04% protease inhibitor cocktail. The total protein in the final protein solution was determined using a Bradford protein assay and stored at -70℃ until needed.
5) Isoelectric focusing (IEF) and sodium dodecyl sulfate-polyacrylamide gel electrophoresis (SDS-PAGE)
IEF and SDS-PAGE were performed using a previously described procedure (12). Immobilized pH gradient (IPG) strips (pH 3~10 linear, length 24 cm) were loaded with 40 mg of the total lung protein during the rehydration of the IPG strip for 12 h at 20℃. IEF was performed using an IPGphor IEF System (Amersham Biosciences, Uppsala, Sweden) for a total of 109 KVh. The strips were applied to a gradient of 10~16% of poly-acrylamide gel (24 m×18 cm). SDS-PAGE was performed at 55 V for 1 h, 160 V for 1 h and 380 V for 4 h using an Ettan DALT system (Amersham Biosciences). The proteins were visualized using the silver-staining method. The spot densities were comparatively analyzed using PDQuest computer software (Bio-rad, Hercules, CA).
6) In-gel digestion and MALDI-TOF analysis
The removal of silver ions, in-gel digestion and peptide extraction were carried out using the method described by Gharahaghi et al. (13). The protein spots of interest were excised, soaked in a 1 : 1 mixing solution of potassium ferricyanide (30 mM) and sodium thiosulfate (100 mM) for 10min, and washed three times with distilled water for 5 min. The gel fragments were then repeatedly dehydrated and dried in a vacuum centrifuge for approximately 2 h. The destained gel fragments were incubated with 5~10 ng/µl of trypsin and 50 mM ammonium bicarbonate overnight at 37℃, and the individual peptides were collected by sequential extraction with 20µl of 5% TFA in 50% acetonitrile. All the analyses were carried out using a MALDI-TOF Voyager DE-PRO Mass spectrometer (Applied Biosystems, Foster City, CA). The MS spectra of the protein digests were interpreted by comparing the resulting peptide mass fingerprints with the NCBInr and Swissprot database using the MASCOT search program (www.matrixscience.com).
7) Statistical analysis
There were 10 mice in each group, and all the values are expressed as the mean±SE. The statistical significance of the differences between the groups was determined using a Student's t-test, and p values <0.05 were considered significant.
Go to :
RESULTS
1) Establishment of mouse RIF model
The fibrotic lungs need to be collected efficiently in order to analyze the RIF using proteomics. Therefore, the RIF mouse model was first established by adjusting the radiation doses and the adequate fibrosis induction times after irradiation. At each screening, the degree of RIF was evaluated by H-E staining and a hydroxyproline assay for collagen accumulation. In these experiments, RIF was induced by 25 Gy at 21 weeks after irradiation, and is represented by the experimental scheme shown in Fig. 1.
The development of fibrosis of the lung is generally characterized by the increased number of alveolar macrophages, moderate patch inflammatory cell infiltration, and most importantly, the increased moderate amount of collagen deposition (9). The fibrotic lung induced by radiation in these experiment showed the above characteristics and portions of the fibrosis region comprised a 10~15% area of the lung section (Fig. 2A). Furthermore, the hydroxyproline level in the RIF was 1.45 times higher than that in the control animals (p=0.03) (Fig. 2B). Although the irradiation protocol could not produce fully developed pulmonary fibrosis, an analysis of these lung samples was sufficient to identify a novel disease marker predicting the early phase of RIF.
 | Fig. 2Confirmation of pulmonary fibrosis using H/E staining and the hydroxyproline assay. The mice were local thorax irradiated at a dose of 25 Gy (0.5 Gy/min). Twenty-one weeks later, severe collagen deposition and the initial phase of fibrosis developed. (A) Alveolar congestion, alveolar cell infiltration, and collagen lay-down can be seen in the 25 Gy irradiation slide (original magnification×40). (B) The increase in the level of collagen can be confirmed by the data (means±SD) representing two comparable experiments with four mice per group.
|
2) Analysis of two-dimensional electrophoresis gel image
Proteomic analysis was carried out using the mouse lung tissues isolated from age-matched controls and the early phase of RIF by 2-DE. In order to compare the measurements of the protein spots in different gels accurately, the volume of the spots was calculated using single spot normalization. Therefore, the quantity of each spot is expressed as a relative intensity. As shown in Fig. 3, more than 1,000 protein spots in the silver stained gels of 8 paired samples could be detected by gel matching and statistical analysis at pH ranging from 3 to 10 and the molecular masses ranging from 10 to 100 kDa. The volumes of the 31 protein spots in the early phase of RIF were significantly different compared with the control. However, some of the protein spots could not be identified by MALDI-TOF mass analysis (Table 1) and others such as carbonate dehydratase were identified but with a low confidence level.
 | Fig. 32-DE of mouse lung. (A) representative proteome image of RIF. (B) normal lung tissue. (C) radiation-induced pulmonary fibrosis lung tissue. The proteins from the whole lung were extracted and separated on pH 3 to 10 linear immobilized pH-gradient strips, followed by a 10~16% sodium dodecyl sulfate/polyacrylamide gel. The gels were stained by silver staining. A total of 70 spots are tagged by numbers. (A) indicates the total up-regulated or down-regulated protein. The upper arrows indicate the protein spots corresponding to the α1-protease inhibitor, and the lower arrows indicate the protein spots corresponding to galectin-1.
|
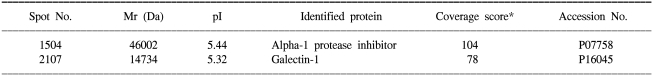
Table 1
Proteins identified by MALDI-TOF MS analysis in mouse RIF
The protein spots were excised and digested in a gel containing trypsin for protein identification using MALDI-TOF/MS. The MS spectra of the protein digests were searched against NCBInr and Swissprot, which are accessible at http://www.ncbi.nlm.nih.gov/ and http://www.expasy.com. *The scores are the confidence level of the match from the MASCOT program.
![]()
3) Up-regulation of α1-protease inhibitor and galectin-1 expression in RIF
Two up-regulated proteins were identified by MALDI-TOF, as shown in Figs. 4 and 5. Computer-assisted comparative analysis of the 2-DE patterns revealed significantly higher expression levels of the α1-protease inhibitor and galectin-1 in the early phase of RIF, approximately 4 and 2.5 fold, respectively, relative to that of the age-matched control tissue. The α1-protease inhibitor and galectin-1 were further validated by mass fingerprinting of the selected peaks of the peptides by applying a mass tolerance (<±100 ppm) with recalibration. This confirmed that the proteins detected in all 16 samples by 2DE were unquestionably the α1-protease inhibitor and galectin-1.
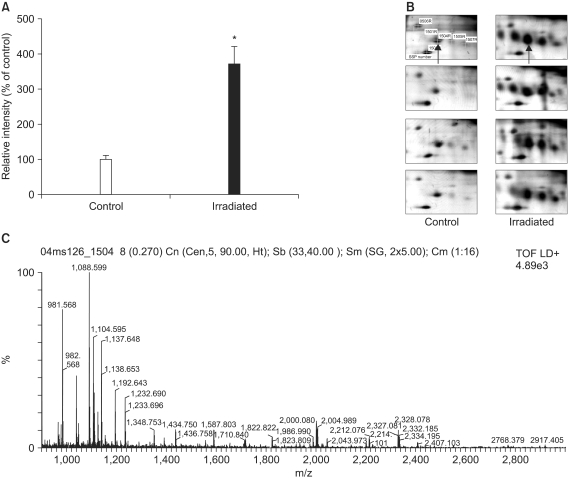 | Fig. 42-DE of murine α1-protease inhibitor. (A) Quantitation of the serine protease inhibitor in the normal lung tissues and RIF tissues. The protein spots that appeared in the 2DE gels were quantified using PDQuest computer software. The average intensities (n=8) of the spots corresponding to the α1-protease inhibitor in 2DE gels are shown. *p<0.005 compared to control. (B) 2DE gel images of α1-protease inhibitor. The arrow indicates the protein spot corresponding to the α1-protease inhibitor. (C) MALDI-TOF MS peptide mass spectrum of the tryptic digestion of the α1-protease inhibitor.
|
 | Fig. 52-DE of murine galectin-1. (A) Quantitation of galectin-1 in the normal lung tissues and RIF tissues. The protein spots that appeared in the 2DE gels were quantified using PDQuest computer software. The average intensities (n=8) of the spots corresponding to galectin-1 in 2DE gels are shown. *p<0.005 compared to control. (B) 2DE gel images of galectin-1. The arrow indicates the protein spot corresponding to galectin-1. (C) MALDI-TOF MS peptide mass spectrum of the tryptic digestion of the gallectin-1.
|
Go to :
DISCUSSION
The treatment of cancer has constantly evolved with the development of new chemotherapeutic agents and radiation therapy techniques. Although new therapeutic approaches have improved the survival of cancer patients, each improvement also has the potential of generating adverse effects. One of the side effects of treatment with both chemotherapeutic agents and radiation is pulmonary fibrosis. Because current therapies using anti-inflammatory drugs, including corticosteroids and cyclophosphamide are aimed at inhibiting of pulmonary inflammation that often precedes fibrosis and is effective only in a minority of patients, novel therapeutic approaches are needed (14).
Many studies have investigated chemotherapeutically and radiotherapy induced pulmonary fibrosis using various agents such as radiation, bleomycin, mitomycins, actinomycins, etc. However, the detailed and accurate mechanism of pulmonary fibrosis has not been identified. Therefore, the identification of a number of biomarker proteins should help in the therapeutic development or diagnosis. This study used high resolution 2-DE and MALDI-TOF to identify the proteins that are significantly expressed in the lungs of RIF subjects. To best of our knowledge, this is the first study to use proteomic analysis to analyze the whole lung tissue proteins in the early phase of RIF. Two proteins, α1-protease inhibitor and galectin-1, were found to be up-regulated during the process of RIF.
Several studies revealed that procollagen, fibronectin, TGF-beta (15), various chemokines (16) and some anti-oxidants are overexpressed in RIF (8). In addition, the level of galectin-3, which modulates the growth of fibroblasts by interacting with their glycoconjugate, has also been shown to be higher in RIF (17). The proteomic analysis in this study also suggests that another galectin subtype, galectin-1, was overexpressed in the early phase of RIF model. Galectin-1 is a type of β-galactoside binding animal lectin, and more than 10 galectins have been identified in mammals. Galectin-1 forms a homodimer of 14 kDa subunits, which play roles in cell proliferation, differentiation, and apoptosis. In addition, they promote the proliferation of rat pulmonary arterial endothelial cells and vascular smooth muscle cells via binding between the β-galactoside-containing moieties of their cell surface receptor (18). Therefore, some galectin subtypes might be used as a good disease marker of pulmonary fibrosis. Their overexpression may partly be due to a tissue remodeling process during radiation-induced pulmonary damage or the development of fibrosis because the induction of galectin-1 appears to be related to the development of liver fibrosis via a cell-to-cell interaction mediated by galectin and the galectin receptor protein. Moreover, it was recently reported that in some cell types, galectin-1 induces the phosphorylation of mitogen-activated protein kinase/extracellular signal-regulated kinase kinase (MEK) and extracellular signal-regulated kinase (ERK) (19). The phosphorylation of MEK and ERK leads to the inhibition of SMAD transportation to the nucleus via the TGF-β signal transduction pathway. Therefore, galectin-1 might have a protective role in RIF, partly through the inhibition of fibrotic cytokine TGF-β (8). Other recent studies have shown that galectin-1 suppresses the inflammatory response in collagen-induced arthritis via T-cell apoptosis (20) or inhibits both the soluble and cellular mediators of the inflammatory response (21), further supporting other protective roles of galectin-1.
One of the typical features of pulmonary fibrosis is the involvement of neutrophils, which appear to play a role in the pathogenesis of various pulmonary lung diseases. An increase in polymorphnuclear neutrophils in the brochoalveolar lavage (BAL) fluid, neutrophil infiltration and neutrophilc alveolitis in the lung tissues have frequently been observed in various pulmonary diseases, including belomycin and radiation-induced pulmonary fibrosis (22,23). Neutrophil elastase, which is a powerful proteinase released by neutrophils, destroys the extracellular matrix, modifies the airway epithelial cells and interferes with the respiratory host defense mechanisms (24). In vivo, neutrophil elastase is normally regulated by serum antiproteinase, the α1-protease inhibitor, which inactivates the free enzyme by rapidly forming complexes with it (25). Taooka et al. investigated the efficiency of a new synthetic neutrophil elastase inhibitor in a murine model with bleomycin-induced pulmonary fibrosis, and suggested that the neutrophil elastase inhibitor could be a novel therapeutic agent for pulmonary fibrosis (23). However, they failed to provide direct evidence of α1-protease inhibitor expression. The formation of α1-protease inhibitor complex was confirmed in the lung parenchyma as well as in the BAL fluid and serum from idiopathic pulmonary fibrosis (IPF) patients (24,25). This strengthens the value of the α1-protease inhibitor as a disease marker, showing high levels of neutrophil elastase.
The number of proteins identified in this study was much less than expected compared with other reports dealing with pulmonary diseases using immunohistochemistry (24,25), which might have been due to the time point in starting the experiment after irradiation. RIF might not have been fully developed. Nevertheless, this is the first study to analyze the whole lung tissue of RIF using proteomic approaches together with a histological examination because it is believed that an analysis of the whole tissue with specific disease states would be more reliable and provide more comprehensive information than separate investigations of the speculated molecules. However, further studies will be needed to confirmthe value of the α1-protease inhibitor and galectin-1 as therapeutic targets or a disease markers of RIF, and determine if the α1-protease inhibitor and galectin-1 can be detected in the blood or BAL fluid from RIF patients.
Go to :
CONCLUSIONS
This study showed for the first time that the expression levels of the α1-protease inhibitor and galectin-1 were significantly higher in the early phase of radiation-induced fibrotic lungs. Together with the other findings, these results suggest that the overexpression of the α1-protease inhibitor and galectin-1 in lung tissue has some protective benefits against radiation-induced pulmonary fibrosis. It is expected that the α1-protease inhibitor and galectin-1 would be promising prognostic markers of RIF patients.
Go to :
 XML Download