MATERIALS AND METHODS
Patients
Histopathological examination
Tumor-infiltrating lymphocytes
PD-L1 expression
Mutation analysis
Clinical details
Statistical analysis
RESULTS
Table 1
| Characteristic | Total (n = 128) | Adenocarcinoma (n = 67) | SqCC (n = 61) | p-value |
|---|---|---|---|---|
| Age (yr) | 59.5 ± 11.1 | 57.5±11.4 | 61.8 ± 10.5 | .047 |
| Male sex | 103 (80.5) | 45 (67.2) | 58 (95.1) | < .001 |
| Smokersa | 95 (74.2) | 39 (58.2) | 56 (94.9) | < .001 |
| Body mass index (kg/m2) | 20.3 ± 4.0 | 20.9 ± 3.9 | 19.7 (4.0) | .093 |
| ECOG PS score ≥ 2 | 19 (14.8) | 9 (13.4) | 10 (16.4) | .638 |
| TNM stage at diagnosisa | .024b | |||
| I | 2 (1.6) | 2 (3.0) | 0 | |
| II | 5 (4.0) | 2 (3.0) | 3 (5.1) | |
| IIIA | 13 (10.3) | 2 (3.0) | 11 (18.6) | |
| IIIB | 27 (21.4) | 9 (13.4) | 18 (30.5) | |
| IV | 79 (62.7) | 52 (77.6) | 27 (45.8) | |
| Extrathoracic diseasec | 56 (44.8) | 41 (61.2) | 15 (25.9) | < .001 |
| Biopsy sitec | .087d | |||
| Lung | 103 (82.4) | 50 (75.8) | 53 (89.8) | |
| Lymph node | 10 (8.0) | 6 (9.1) | 4 (6.8) | |
| Pleura | 5 (4.0) | 5 (7.6) | 0 | |
| Other | 7 (5.6) | 5 (7.6) | 2 (3.4) | |
| EGFR-positive | 8 (6.2) | 8 (11.9) | 0 | .005 |
| ALK-positive | 7 (5.4) | 7 (10.4) | 0 | .009 |
| First-line treatment | .011 | |||
| Chemotherapy | 95 (74.2) | 49 (73.1) | 46 (75.4) | |
| Targeted therapye | 16 (12.5) | 13 (19.4) | 3 (4.9) | |
| Other | 17 (13.3) | 5 (7.5) | 12 (19.7) |
SqCC, squamous cell carcinoma; ECOG PS, Eastern Cooperative Oncology Group performance status; EGFR, epidermal growth factor receptor; ALK, anaplastic lymphoma kinase; SD, standard deviation.
e Patients who had a high probability of underlying EGFR mutation (e.g., non-smoking females) in whom molecular testing could not be performed (inadequate tissue for molecular analysis in the initial sample with the patient unwilling or unfit for a repeat invasive procedure) and whose performance status did not permit the use of chemotherapy were provided targeted therapy on compassionate grounds. Therefore, the number of patients with driver mutations and the number of patients who received targeted therapy was not equal.
Fig. 2

Table 2
| Variable | Total (n = 128) | Adenocarcinoma (n = 67) | SqCC (n = 61) | p-value |
|---|---|---|---|---|
| PD-L1 TC score | .335a | |||
| TC0 | 79 (61.7) | 44 (65.7) | 35 (57.4) | |
| TC1 | 27 (21.1) | 8 (11.9) | 19 (31.1) | |
| TC2 | 22 (17.2) | 15 (22.4) | 7 (11.5) | |
| TIL scoreb | .126c | |||
| TIL0 | 30 (23.4) | 18 (26.9) | 12 (19.7) | |
| TIL1 | 40 (31.3) | 22 (32.8) | 18 (29.5) | |
| TIL2 | 24 (18.8) | 10 (14.9) | 14 (23.0) | |
| TIL3 | 10 (7.8) | 4 (6.0) | 6 (9.8) |
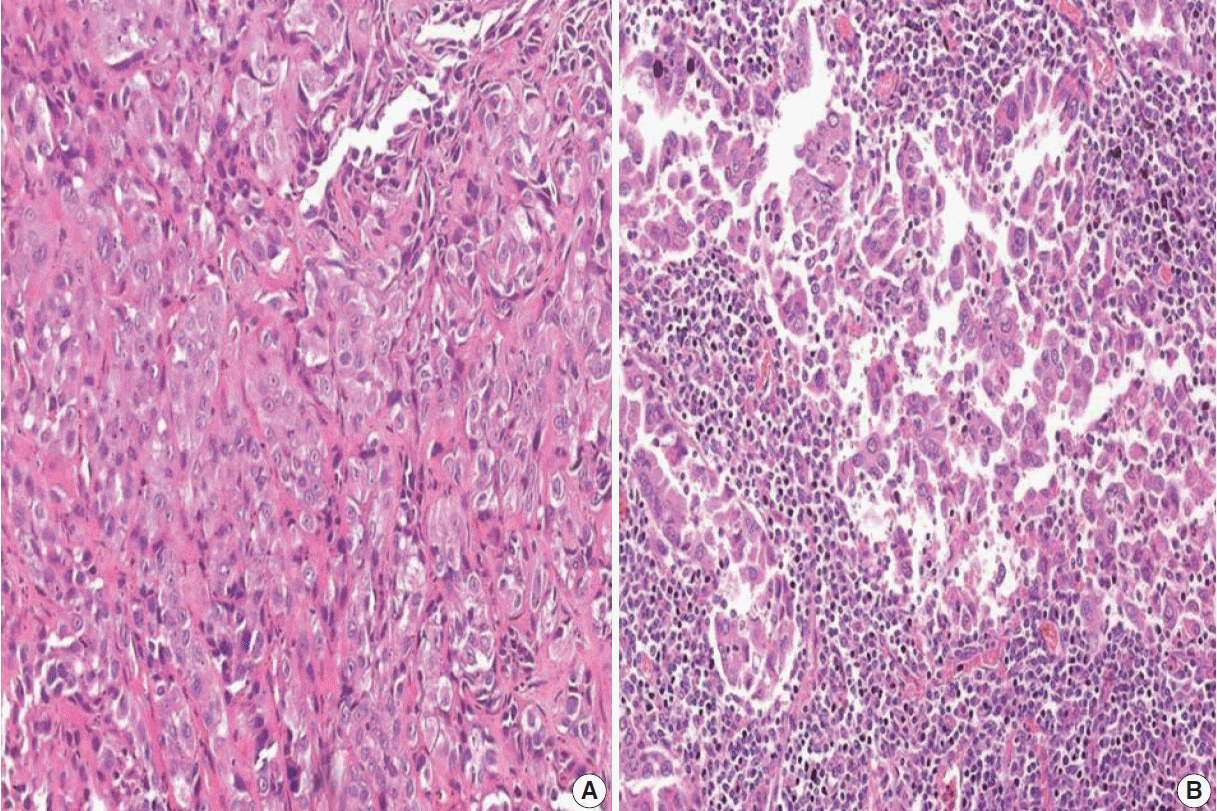
The TC score was assigned based on the proportion of tumor cells expressing PD-L1 (TC0: < 1%, TC1: ≥ 1 but ≤ 50%, TC2: > 50%). The TIL score was assigned based on the proportion of tumor stroma occupied by TILs (TIL0: ≤ 5%, TIL1: ≤ 25%, TIL2: > 25 but ≤ 50%, TIL3: > 50%).
SqCC, squamous cell carcinoma; PD-L1, programmed death-ligand 1; TC, tumor cell; TILs, tumor-infiltrating lymphocytes.
Fig. 3

Table 3
| Variable | PD-L1 negative (n = 106) | PD-L1 positive (n = 22) | p-value |
|---|---|---|---|
| Age (yr) | 59.6 ± 10.6 | 59.5 ± 13.6 | .934 |
| Male sex | 88 (83.0) | 15 (68.2) | .240 |
| Smokersa | 82 (77.3) | 13 (59.1) | .051 |
| Body mass index (kg/m2) | 20.5 ± 4.0 | 19.3 ± 3.7 | .308 |
| ECOG score ≥ 2 | 17 (16.0) | 2 (9.1) | .525 |
| TNM stage at diagnosisa | .649 | ||
| I | 2 (1.9) | 0 | |
| II | 4 (3.8) | 1 (4.5) | |
| IIIA | 11 (10.4) | 2 (9.1) | |
| IIIB | 25 (23.6) | 2 (9.1) | |
| IV | 62 (58.5) | 17 (77.3) | |
| Extrathoracic disease at baselineb | 44 (41.5) | 12 (54.5) | .311 |
| Liver metastasis | 3 (2.8) | 4 (18.2) | .018 |
| Biopsy siteb | .022 | ||
| Lung | 91 (85.8) | 12 (54.5) | |
| Lymph node | 6 (5.7) | 4 (18.2) | |
| Pleura | 3 (2.8) | 2 (9.1) | |
| Other | 4 (3.8) | 3 (13.6) | |
| Histology | .102 | ||
| Adenocarcinoma | 52 (49.1) | 15 (68.2) | |
| Squamous cell carcinoma | 54 (50.9) | 7 (31.8) | |
| EGFR-positive | 5 (4.7) | 3 (13.6) | .138 |
| ALK-positive | 5 (4.7) | 2 (9.1) | .345 |
| First-line treatment | .664 | ||
| Chemotherapy | 80 (75.5) | 15 (68.2) | |
| Targeted therapy | 12 (11.3) | 4 (18.2) | |
| None | 14 (13.2) | 3 (13.6) | |
| TIL score (%)c | .890 | ||
| 0–5 | 23 (28.0) | 7 (31.8) | |
| 6–25 | 33 (40.2) | 7 (31.8) | |
| 26–50 | 18 (22.0) | 6 (27.3) | |
| > 50 | 8 (9.8) | 2 (9.1) |


 PDF
PDF Citation
 Print
Print


 XML Download