Abstract
Background
Methods
Results
Supplementary Materials
Notes
Ethics Statement
The present study was approved by the Institutional Review Board of the University of Kufa (IRB approval No. UK-2018-0456) in accordance with the 1964 Helsinki declaration and its later amendments. Formal written informed consent was not required with a waiver issued by the Institutional Review Board of the University of Kufa. All the authors will be held responsible for any false statements or failure to follow the ethical guidelines.
Author contributions
Conceptualization: ASJ, MMS. Data curation: ASJ. Formal analysis: ASJ, MMS. Methodology: ASJ, HSA, MMS. Project administration: HSA, MMS. Resources: HSA. Software: ASJ, MMS. Supervision: ASJ, AAY. Validation: MMS, HSA. Visualization: HSA, MMS. Writing—original draft: ASJ, AAY, KAM. Writing—review & editing: AAY, ASJ, KAM. Approval of final manuscript: all authors.
References
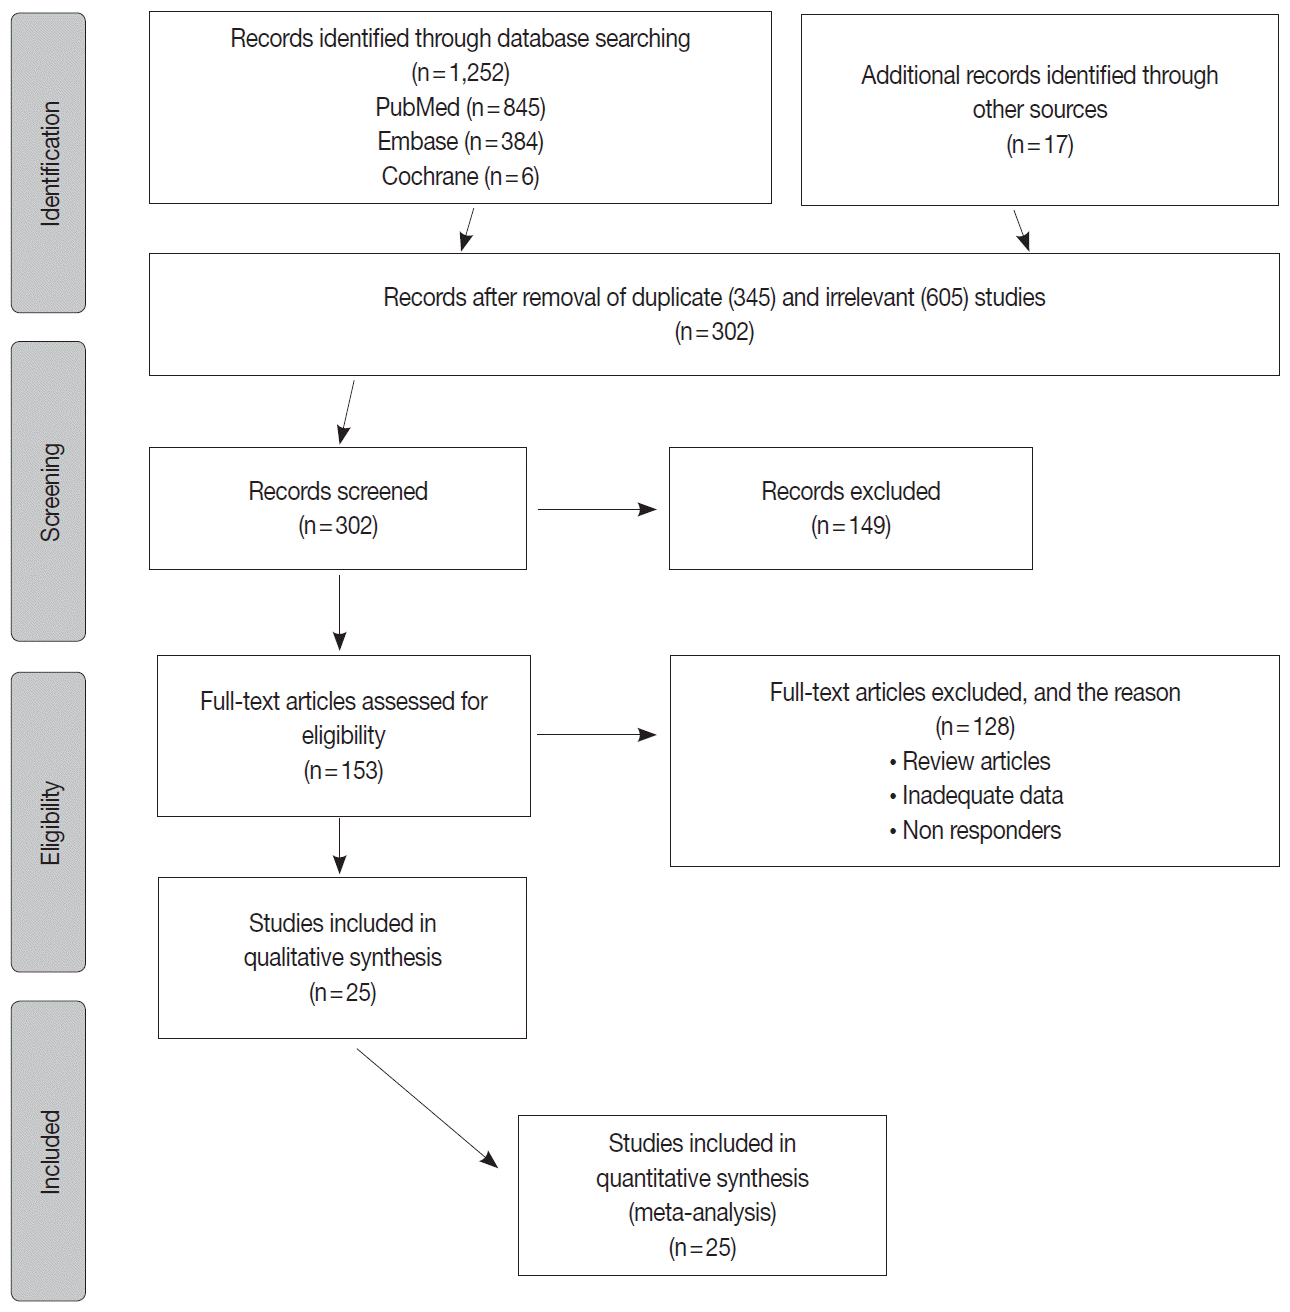
Fig. 1.

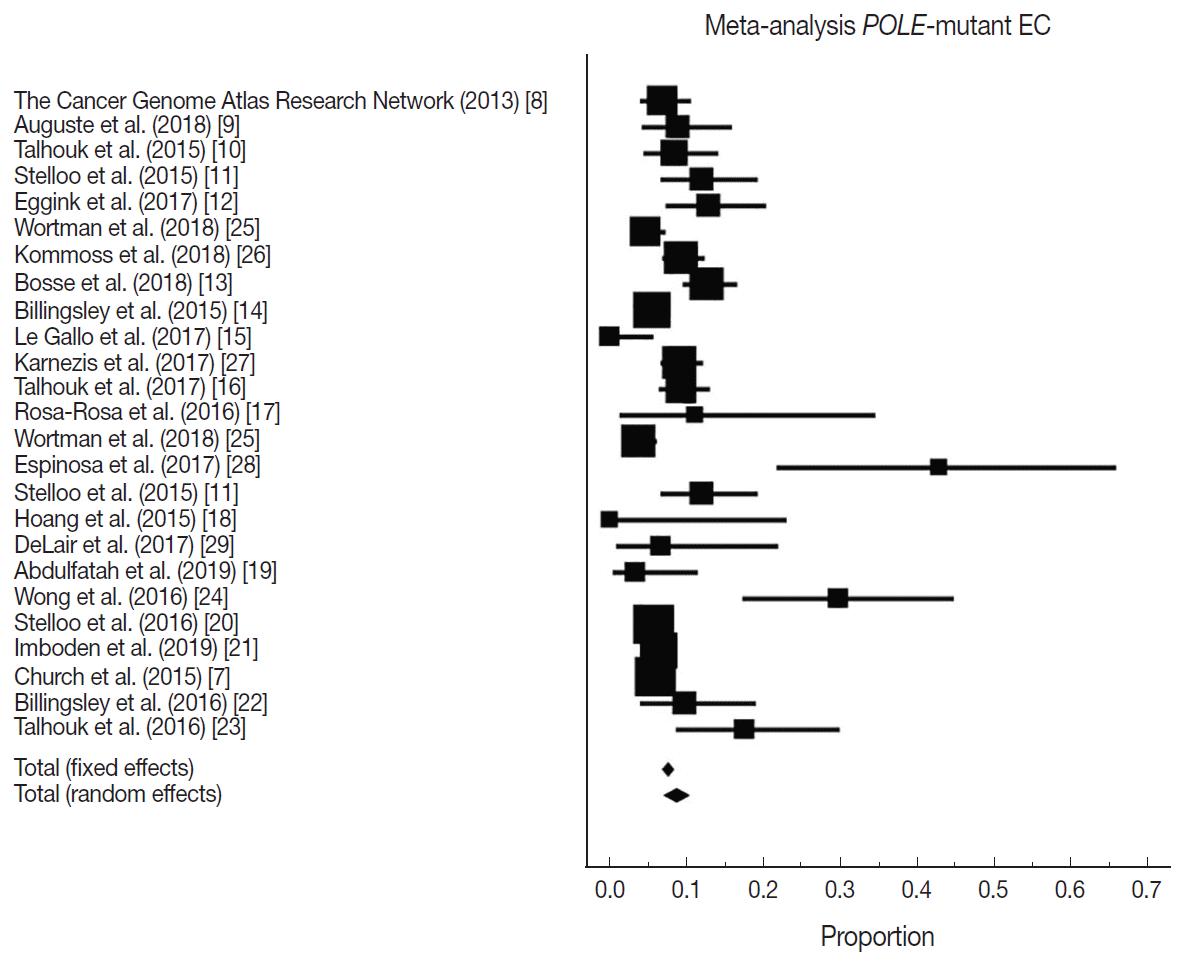
Fig. 2.

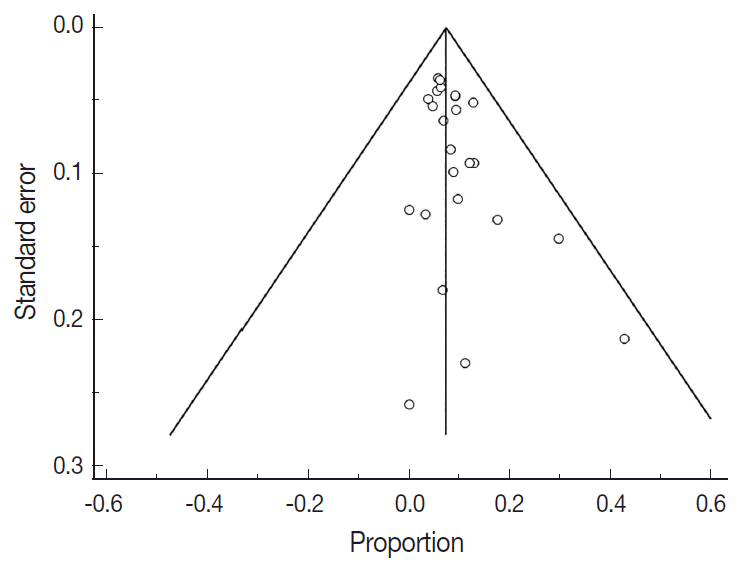
Fig. 3.

Table 1.
| Study | EC cohort size | Proportion POLE-mutant | Country | Sequencing method | Location of exonuclease mutations |
|---|---|---|---|---|---|
| The Cancer Genome Atlas Research Network (2013) [8] | 248 | 17 | USA | Exome sequencing | Hotspots: Pro286Arg and Val411Leu |
| Auguste et al. (2018) [9] | 102 | 9 | Canada and Europe | Sanger sequencing | Exons 9 and 13 |
| Talhouk et al. (2015) [10] | 143 | 12 | Canada | Fluidigm-MiSeq and sanger sequencing | Exons 9–14 |
| Stelloo et al. (2015) [11] | 116 | 14 | Europe and Australia | Sanger sequencing | Exons 9 and 13 |
| Eggink et al. (2017) [12] | 116 | 15 | Europe and Australia | Sanger sequencing | Exons 9, 13 and 14 |
| Wortman et al. (2018) [25] | 344 | 16 | Netherlands | Sequencing | Not reported |
| Kommoss et al. (2018) [26] | 452 | 42 | Germany | Sequencing | Exons 9–14 |
| Bosse et al. (2018) [13] | 376 | 48 | USA, Canada, and Europe | Sanger or next-generation approaches | Hotspots in the exonuclease domain (exons 9–14) |
| Billingsley et al. (2015) [14] | 535 | 30 | USA | Sanger sequencing | Residues 268–471 |
| Le Gallo et al. (2017) [15] | 63 | 0 | USA and Europe | Sanger sequencing | Not reported |
| Karnezis et al. (2017) [27] | 460 | 42 | Canada | Sequencing | Not reported |
| Talhouk et al. (2017) [16] | 319 | 30 | Canada | Sanger sequencing | Exons 9–14 |
| Rosa-Rosa et al. (2016) [17] | 18 | 2 | USA and Europe | Sanger sequencing | Exons 9 and 13 |
| Wortman et al. (2018) [25] | 416 | 16 | Netherlands | Sequencing | Not reported |
| Espinosa et al. (2017) [28] | 21 | 9 | Spain | Sequencing | Exons 9 to 14 |
| Stelloo et al. (2015) [11] | 116 | 14 | Europe | Sanger sequencing | Exons 9 and 13 |
| Hoang et al. (2015) [18] | 14 | 0 | Canada | Sanger sequencing | Exons 9–14 |
| DeLair et al. (2017) [29] | 30 | 2 | USA | Sequencing | Exons 9–14 |
| Abdulfatah et al. (2019) [19] | 60 | 2 | USA | Sanger sequencing | Exons 9 and 13 |
| Wong et al. (2016) [24] | 47 | 14 | Singapore | Next generation sequencing | Exons 9–14 |
| Stelloo et al. (2016) [20] | 834 | 49 | Netherlands | Sanger sequencing | Exons 9 and 13 |
| Imboden et al. (2019) [21] | 599 | 38 | Sweden | Sanger sequencing | Exons 9–14 |
| Church et al. (2015) [7] | 788 | 48 | Europe | Sanger sequencing | Exons 9 and 13 |
| Billingsley et al. (2016) [22] | 72 | 7 | USA | Sanger sequencing | Residues 268–471 |
| Talhouk et al. (2016) [23] | 57 | 10 | USA and Canada | Ultra-deep MiSeq or sanger sequencing | Exons 9–14 |
Table 2.
Table 3.
Table 4.
| Study | OS estimated HR (95% CI) | DSS estimated HR (95% CI) | PFS estimated HR (95% CI) | Survival analysis test | Method |
|---|---|---|---|---|---|
| Talhouk et al. (2017) [16] | 1.01 (0.29–3.42) | 0.42 (0.30–0.57) | - | Multivariable analysis | Kaplan-Meier survival analysis |
| Talhouk et al. (2015) [10] | 0.17 (0.01–1.98) | 0.170 (0.01–1.99) | - | Multivariable analysis | Kaplan-Meier with log-rank significance testing and Cox proportional hazard regression models |
| Church et al. (2015) [7] | 1.06 (0.58–1.91) | 0.19 (0.02–1.31) | - | Multivariable analysis | Kaplan-Meier method and compared by the log-rank test |
| Karnezis et al. (2017) [27] | 0.59 (0.21–1.60) | 0.49 (0.12–1.90) | 0.26 (0.04–1.49) | Univariable survival analysis | Kaplan-Meier survival curve |
| Stelloo et al. (2016) [20] | 1.10 (0.39–3.10) | Multivariable analysis | Kaplan-Meier survival analysis | ||
| Bosse et al. (2018) [13] | 0.23 (0.06–0.76) | Multivariable analysis | Kaplan-Meier survival curve | ||
| Pooled HR (95% CI) | 0.90 (0.59–1.38) | 0.41 (0.30–0.55) | 0.23 (0.08–0.64) | ||
| I2 (95% CI, %) | 0.00 (0.00–73.28) | 0.00 (0.00–67.34) | 0.00 (0.00–0.00) |


 PDF
PDF Citation
 Print
Print


 XML Download